Epidemiology/Health Services Research O R I G I N A L
A R T I C L E
Association of Prediabetes and Diabetes With Stroke Symptoms The REasons for Geographic And Racial Differences in Stroke (REGARDS) study* APRIL P. CARSON, PHD1 PAUL MUNTNER, PHD1,2 BRETT M. KISSELA, MD, MS3 DAWN O. KLEINDORFER, MD3 VIRGINIA J. HOWARD, PHD1
M
JAMES F. MESCHIA, MD4 LINDA S. WILLIAMS, MD5,6 RONALD J. PRINEAS, MD, PHD7 GEORGE HOWARD, DRPH8 MONIKA M. SAFFORD, MD2
OBJECTIVEdStroke symptoms among individuals reporting no physician diagnosis of stroke are associated with an increased risk of future stroke. Few studies have assessed whether individuals with diabetes or prediabetes, but no physician diagnosis of stroke, have an increased prevalence of stroke symptoms. RESEARCH DESIGN AND METHODSdThis study included 25,696 individuals aged $45 years from the REasons for Geographic And Racial Differences in Stroke (REGARDS) study who reported no history of stroke or transient ischemic attack at baseline (2003–2007). Glucose measurements, medication use, and self-reported physician diagnosis were used to categorize participants into diabetes, prediabetes, or normal glycemia groups. The presence of six stroke symptoms was assessed using a validated questionnaire. RESULTSdThe prevalence of any stroke symptom was higher among participants with diabetes (22.7%) compared with those with prediabetes (15.6%) or normal glycemia (14.9%). In multivariable models, diabetes was associated with any stroke symptom (prevalence odds ratio [POR] 1.28 [95% CI 1.18–1.39]) and two or more stroke symptoms (1.26 [1.12–1.43]) compared with normal glycemia. In analyses of individual stroke symptoms, diabetes was associated with numbness (1.15 [1.03–1.29]), vision loss (1.52 [1.31–1.76]), half-vision loss (1.54 [1.30–1.84]), and lost ability to understand people (1.34 [1.12–1.61]) after multivariable adjustment. No association was present between prediabetes and stroke symptoms. CONCLUSIONSdIn this population-based study, almost one in four individuals with diabetes reported stroke symptoms, which suggests that screening for stroke symptoms in diabetes may be warranted. Diabetes Care 35:1845–1852, 2012
c c c c c c c c c c c c c c c c c c c c c c c c c c c c c c c c c c c c c c c c c c c c c c c c c
From the 1Department of Epidemiology, School of Public Health, University of Alabama at Birmingham, Birmingham, Alabama; the 2Department of Medicine, University of Alabama at Birmingham, Birmingham, Alabama; the 3Department of Neurology, University of Cincinnati College of Medicine, Cincinnati, Ohio; the 4Department of Neurology, Mayo Clinic, Jacksonville, Florida; the 5Veterans Administration Medical Center, Health Services Research and Development Center on Implementing Evidence-Based Practice, Indianapolis, Indiana; the 6Department of Neurology, Indiana University School of Medicine, Indianapolis, Indiana; the 7Division of Public Health Sciences, Wake Forest University School of Medicine, WinstonSalem, North Carolina; and the 8Department of Biostatistics, School of Public Health, University of Alabama at Birmingham, Birmingham, Alabama. Corresponding author: April P. Carson,
[email protected]. Received 2 November 2011 and accepted 1 April 2012. DOI: 10.2337/dc11-2140 This article contains Supplementary Data online at http://care.diabetesjournals.org/lookup/suppl/doi:10 .2337/dc11-2140/-/DC1. *A complete list of participating REGARDS investigators and institutions can be found at http://www. regardsstudy.org. © 2012 by the American Diabetes Association. Readers may use this article as long as the work is properly cited, the use is educational and not for profit, and the work is not altered. See http://creativecommons.org/ licenses/by-nc-nd/3.0/ for details.
care.diabetesjournals.org
ore than 40% of adults in the U.S. have diabetes or prediabetes (1), which increases the risk of microvascular and macrovascular complications, including stroke. In a recent meta-analysis of 102 epidemiologic studies, adults with diabetes were two to three times as likely as adults without diabetes to have an ischemic stroke (2). Additionally, diabetes has been associated with an increased risk of various ischemic stroke subtypes, including lacunar and thrombotic stroke (3,4), while weaker associations have been reported for diabetes and hemorrhagic stroke (2). In contrast, inconsistent findings have been reported for the association between prediabetes and stroke. Several studies have reported an association between prediabetes and ischemic stroke (5–8), while others have reported no association (9,10). Although individuals with diabetes have an increased risk of stroke, not all strokes come to clinical attention. In the general population, stroke symptoms among individuals reporting no history of a stroke diagnosis have been associated with an increased risk of future stroke, suggesting that at least some reported stroke symptoms may be indicative of clinically unrecognized strokes (11–14). However, few studies have examined the association between prediabetes or diabetes and stroke symptoms. If individuals with prediabetes and diabetes have an increased prevalence of stroke symptoms without a stroke diagnosis, screening this population for stroke symptoms may be warranted and used to guide clinical management programs for the prevention of stroke. The purpose of this study was to evaluate the association of prediabetes and diabetes with the prevalence of stroke symptoms in a large national study of U.S. adults aged $45 years without a history of stroke or transient ischemic attack (TIA). Additionally, the association between metabolic syndrome and stroke symptoms among participants without diabetes was investigated in a secondary analysis. RESEARCH DESIGN AND METHODSdThe current study is a cross-sectional analysis of baseline data
DIABETES CARE, VOLUME 35, SEPTEMBER 2012
1845
Diabetes and stroke symptoms from the REasons for Geographic And Racial Differences in Stroke (REGARDS) study. The REGARDS study is a prospective, population-based cohort study designed to investigate racial and geographic differences in stroke incidence and stroke mortality. Details of the study objectives and design have previously been published (15). In brief, 30,239 African American and white adults aged $45 years were enrolled between 2003 and 2007, with 56% of participants recruited from the “stroke buckle” (defined as the coastal North Carolina, South Carolina, and Georgia areas) and “stroke belt” (the remainder of North Carolina, South Carolina, and Georgia as well as Alabama, Mississippi, Tennessee, Arkansas, and Louisiana) regions and the remaining 44% of participants recruited from the other 40 contiguous U.S. states and the District of Columbia. The REGARDS study protocol was approved by the institutional review boards of each participating institution, and all participants provided written informed consent. Individuals reporting a history of stroke or TIA at baseline (n = 3,033), missing data on stroke or TIA history (n = 279), missing data on stroke symptoms (n = 376), and missing data on glucose level or oral diabetes medications (n = 855) were excluded from this study, resulting in 25,696 participants in this cross-sectional analysis. Data collection and variables Structured telephone interviews, selfadministered questionnaires, and in-home examinations were used to assess demographic, lifestyle, and clinical factors at baseline. Age, sex, race, education, annual household income, health insurance, smoking status, alcohol consumption, and current use of insulin, oral diabetes, and antihypertensive medications were selfreported. Participants were asked up to two questions about alcohol consumption during the telephone interview: 1) “Do you presently drink alcoholic beverages, including beer, wine, and other drinks made with hard liquor, even occasionally?” and if the response was yes, then 2) “How many alcohol beverages do you presently drink?” Moderate alcohol consumption was defined as one drink daily or less for women and two drinks daily or less for men, and heavy alcohol consumption was defined as more than one drink daily for women and more than two drinks daily for men based on federal dietary guidelines (16). Geographic region (stroke buckle, stroke belt, and other) and urban/rural residence (urban, rural, 1846
and mixed) was determined using participant address and census data. During the in-home examination, blood pressure, height, and weight were measured following a standardized protocol. In brief, after the participant had been sitting for several minutes, two seated systolic and diastolic blood pressure measurements were taken by a trained technician using an aneroid sphygmomanometer (American Diagnostic Corporation, Hauppauge, NY) that was regularly evaluated for quality control (17). Blood pressures were taken following a standardized protocol in the left arm of participants and using a largesize cuff if the participant’s arm circumference exceeded 13 inches. The average of the two blood pressure measurements was used in this analysis. BMI was calculated as weight in kilograms divided by the square of height in meters. An electrocardiogram was also recorded during the in-home examination and analyzed at a central reading center to determine the presence of atrial fibrillation, myocardial infarction, and left ventricular hypertrophy (LVH). Atrial fibrillation and prior myocardial infarction were defined using Minnesota code criteria (18), and LVH was defined using sex-specific Cornell voltage cut points (19). History of coronary heart disease was defined as myocardial infarction on electrocardiogram, self-reported myocardial infarction, or prior coronary revascularization procedures. Blood samples were collected during the in-home examination following standardized protocols and were analyzed at a central laboratory. Serum glucose was measured using colorimetric reflectance spectrophotometry on the Ortho Vitros 950 IRC Clinical Analyzer (Johnson & Johnson Clinical Diagnostics) with a coefficient of variation of 1%. Diabetes, prediabetes, and metabolic syndrome Diabetes was defined as a fasting serum glucose $126 mg/dL ($7 mmol/L) (20) (or a random serum glucose $200 mg/dL [$11.1 mmol/L] for the 13% of participants who did not fast for a minimum of 8 h), current use of insulin or oral diabetes medications, or a self-reported physician diagnosis of diabetes while not pregnant. Prediabetes was defined as a fasting serum glucose between 100 and 125 mg/dL (5.6 and ,7 mmol/L) (20) or a random serum glucose between 140 and 199 mg/dL (7.8 and ,11.1 mmol/L) among participants not using insulin or oral diabetes medications and without a history of diabetes. Normal glycemia was defined as a fasting
DIABETES CARE, VOLUME 35, SEPTEMBER 2012
serum glucose ,100 mg/dL (,5.6 mmol/L), a random serum glucose ,140 mg/dL (,7.8 mmol/L), no use of insulin or oral diabetes medications, and no history of diabetes. Metabolic syndrome was calculated only among participants without diabetes and who fasted overnight prior to the REGARDS study visit (n = 17,054). Metabolic syndrome was defined based on having three or more of the following components: 1) systolic blood pressure $130 mmHg, diastolic blood pressure $85 mmHg, or current antihypertensive medication use; 2) HDL cholesterol ,40 mg/dL in men and ,50 mg/dL in women; 3) triglycerides $150 mg/dL; 4) fasting glucose $100 mg/dL; and 5) waist circumference .102 cm in men and .88 cm in women (21). Stroke symptoms Stroke symptoms were assessed during the baseline telephone interview using the Questionnaire for Verifying Stroke-Free Status (QVSS), a validated questionnaire (22,23) consisting of eight questions designed to identify stroke-free individuals in the general population (24). The first two questions inquire about a physician diagnosis of stroke or TIA, and the remaining six questions (Supplementary Table 1) inquire about the sudden onset of each of six stroke symptoms: weakness (unilateral), numbness (unilateral), vision loss in one or both eyes, half-vision loss, lost ability to understand people, and lost ability to express self verbally or in writing. We reported good sensitivity (82%) and reasonable specificity (62%) for a positive response to any of the stroke symptoms compared with a neurologist diagnosis of stroke or TIA (25). The association of diabetes status with stroke symptoms was evaluated using the following classification: 1) any of the six stroke symptoms, 2) each stroke symptom individually, 3) two or more of the six stroke symptoms, and 4) specific stroke symptom clusters that are similar to common clinical presentations (25). The stroke symptom clusters evaluated were as follows: 1) weakness (unilateral) and numbness (unilateral), 2) lost ability to understand people and lost ability to express oneself verbally or in writing, and 3) weakness (unilateral) and lost ability to express oneself verbally or in writing. Statistical analysis Participant characteristics were calculated by diabetes category (i.e., diabetes, prediabetes, and normal glycemia). Logistic regression was used to calculate prevalence care.diabetesjournals.org
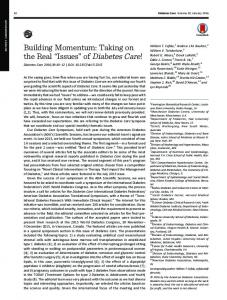
Carson and Associates odds ratios (PORs) (95% CI) for the association of diabetes, prediabetes, and stroke symptoms, using normal glycemia as the reference group. Initial models included adjustment for age, race, and sex. Subsequent models included additional adjustment for education, annual household income, health insurance, geographic region, urban/rural residence, systolic blood pressure, antihypertensive medication use, smoking status, alcohol consumption, BMI, atrial fibrillation, LVH, and history of coronary heart disease. A secondary analysis was also performed to evaluate the association between metabolic syndrome and stroke symptoms. Effect modification by age, race, sex, and geographic region was evaluated in fully adjusted models using interaction terms. Multiple imputation with five datasets (26) was used to obtain values for 19% of participants who were missing data on covariates. The most commonly missing covariate was income. All analyses were performed using SAS version 9.2 (SAS Institute, Cary, NC). RESULTS Diabetes, prediabetes, and stroke symptoms Participant characteristics are presented in Table 1 by diabetes category. Overall, 23.6% of participants had diabetes, 15.6% had prediabetes, and 60.8% had normal glycemia. Each participant characteristic investigated was associated with diabetes status except health insurance and current smoking. Participants with diabetes had the highest prevalence of any stroke symptom (22.7%) followed by participants with prediabetes (15.6%) or normal glycemia (14.9%). They also had a higher prevalence of each stroke symptom compared with individuals with prediabetes or normal glycemia (Fig. 1). Participants with diabetes were more likely to report any stroke symptom after adjustment for age, race, and sex (POR 1.56 [95% CI 1.45–1.69) and in a fully adjusted model (1.28 [1.18–1.39]). Additionally, diabetes was associated with each stroke symptom individually after adjustment for age, race, and sex, but the associations remained statistically significant after multivariable adjustment only for numbness on one side, vision loss, half-vision loss, and lost ability to understand people (Table 2). Prediabetes was not associated with having any of the six stroke symptoms in crude or adjusted models. Differences in care.diabetesjournals.org
Table 1dCharacteristics of the REGARDS study participants by diabetes status
n Age (years) Women African American Geographic region Other Stroke belt Stroke buckle Urban/rural residence Urban Rural Mixed High school education Annual household income (USD) ,20,000 20,000–34,999 35,000–74,999 $75,000 Health insurance Current smoking Alcohol consumption None Moderate Heavy BMI (kg/m2) Systolic blood pressure (mmHg) Antihypertensive medication use† Statin use Atrial fibrillation Left ventricular hypertrophy History of coronary heart disease
Normal glycemia
Prediabetes
Diabetes
P
15,615 64.0 (9.5) 56.6 34.7
4,011 64.2 (9.1) 51.0 40.6
6,070 65.3 (8.8) 53.0 55.5
,0.001 ,0.001 ,0.001
45.8 34.3 20.0
41.8 35.8 22.4
41.8 35.6 22.6
Ref. ,0.001 ,0.001
69.5 20.3 10.2 90.7
71.5 18.4 10.1 89.7
72.4 18.1 9.4 81.8
Ref. ,0.001 0.024 ,0.001
16.4 26.0 35.9 21.8 93.5 14.0
17.5 25.0 37.3 20.3 92.6 15.3
27.2 30.6 30.7 11.5 92.9 13.8
Ref. ,0.001 ,0.001 ,0.001 0.101 0.829
57.7 37.7 4.6 28.0 (5.6) 125.2 (16.0) 60.7 23.9 7.1 4.5 12.9
59.0 35.4 5.6 30.4 (6.0) 129.3 (16.2) 64.4 30.3 8.0 5.1 15.5
72.6 25.3 2.2 32.1 (6.6) 130.9 (16.8) 82.0 44.7 9.6 7.5 23.5
Ref. ,0.001 ,0.001 ,0.001 ,0.001 ,0.001 ,0.001 ,0.001 ,0.001 ,0.001
Data are means (SD) or percent. †Among individuals with hypertension.
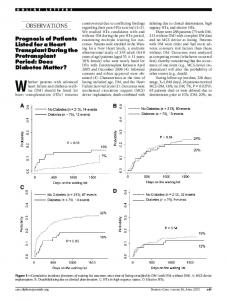
the association of diabetes and stroke symptoms were investigated by age, race, sex, and geographic region, but none were statistically significant (P . 0.10). The prevalence of stroke symptom clusters is presented in Fig. 2. Participants with diabetes had a higher prevalence of any two or more stroke symptoms (9.6%) compared with participants with prediabetes (5.8%) or normal glycemia (5.7%). The prevalence of stroke symptom clusters was also higher among participants with diabetes compared with those with prediabetes or normal glycemia. After multivariable adjustment, participants with diabetes were more likely to have two or more stroke symptoms (Table 2) compared with those with normal glycemia. Diabetes was also associated with stroke symptom clusters after adjustment for age, race, and sex, but these associations were attenuated and no longer statistically significant after additional multivariable adjustment. Prediabetes was not associated with having two
or more stroke symptoms or any of the stroke symptom clusters. Metabolic syndrome and stroke symptoms Among participants without diabetes, 29.2% had metabolic syndrome. Among those with metabolic syndrome, 87.9% had elevated blood pressure, 79.6% had abdominal obesity, 68.5% had low HDL cholesterol, 57.9% had elevated triglycerides, and 51.6% had elevated glucose. Metabolic syndrome was associated with any stroke symptom (POR 1.13 [95% CI 1.03–1.24]) and with sudden weakness and sudden numbness individually after multivariable adjustment (Supplementary Table 2). Additionally, metabolic syndrome was associated with having two or more stroke symptoms (1.26 [1.10–1.44]) and the cluster of unilateral weakness and numbness (1.41 [1.17– 1.71]) after adjustment for age, race, and sex, but both of these associations were
DIABETES CARE, VOLUME 35, SEPTEMBER 2012
1847
Diabetes and stroke symptoms
Figure 1dPrevalence of any stroke symptom and each individual stroke symptom by diabetes status: the REGARDS study.
attenuated and not statistically significant after multivariable adjustment (Supplementary Table 3). CONCLUSIONSdIn this populationbased study of middle-aged and older adults, almost one in four individuals with diabetes but without a physician diagnosis of stroke had experienced stroke symptoms. Diabetes was associated with both individual stroke symptoms and multiple stroke symptoms. Because diabetes heightens the risk for vascular complications, the association between diabetes and stroke symptoms observed in this study among those without a reported stroke diagnosis could reflect a high prevalence of unrecognized strokes. Prediabetes was not associated with any stroke symptom or two or more stroke symptoms. However, metabolic syndrome was associated with the occurrence 1848
of any stroke symptom but not two or more stroke symptoms. The association between diabetes and stroke symptoms has been investigated in previous studies. In the Atherosclerosis Risk in Communities (ARIC) study of middle-aged white and African American adults, diabetes was associated with stroke symptoms in each race-sex group after adjustment for age and study site, but additional multivariable adjustment was not reported and individuals with a prior history of stroke were not excluded (27). Another study of middle-aged adults in Scotland that did exclude those with a history of stroke reported that men with diabetes were more likely to report two or more stroke symptoms, while no difference in stroke symptoms was reported among women (12). The current study found that both men and women with diabetes were more likely to report any
DIABETES CARE, VOLUME 35, SEPTEMBER 2012
stroke symptom and two or more stroke symptoms even though they reported no stroke diagnosis and that these associations persisted after multivariable adjustment. The prior studies used different questionnaires and assessed different stroke symptoms than the current study but suggest that our finding of a 50% greater prevalence of stroke symptoms among individuals with diabetes warrants further investigation of the occurrence of clinically unrecognized strokes in this high-risk population. Prediabetes was not associated with individual stroke symptoms or clusters of stroke symptoms among the individuals without a reported stroke diagnosis in the current study. Few data have been published on the association between prediabetes and stroke symptoms without a stroke diagnosis. In prior studies, the association between prediabetes and care.diabetesjournals.org
Carson and Associates Table 2dPORs (95% CI) for stroke symptoms associated with prediabetes and diabetes among REGARDS study participants POR (95% CI)
Any stroke symptom Model 1 Model 2 Individual stroke symptoms Sudden weakness, unilateral Model 1 Model 2 Sudden numbness, unilateral Model 1 Model 2 Sudden painless loss of vision in one or both eyes Model 1 Model 2 Sudden loss of half-vision Model 1 Model 2 Suddenly lost ability to understand people Model 1 Model 2 Suddenly lost ability to express self verbally or in writing Model 1 Model 2 Any 2 or more stroke symptoms Model 1 Model 2 Stroke symptom clusters Weakness (unilateral) plus numbness (unilateral) Model 1 Model 2 Lost understanding plus lost expression Model 1 Model 2 Weakness (unilateral) plus lost expression Model 1 Model 2
Normal glycemia (n = 15,615)
Prediabetes (n = 4,011)
Diabetes (n = 6,070)
1 (ref.) 1 (ref.)
1.03 (0.94–1.14) 0.98 (0.89–1.08)
1.56 (1.45–1.69)***††† 1.28 (1.18–1.39)***†††
1 (ref.) 1 (ref.)
0.97 (0.82–1.14) 0.88 (0.75–1.04)
1.49 (1.32–1.68)***††† 1.10 (0.97–1.26)†
1 (ref.) 1 (ref.)
1.13 (0.99–1.29) 1.04 (0.91–1.19)
1.47 (1.32–1.63)***††† 1.15 (1.03–1.29)*
1 (ref.) 1 (ref.)
1.11 (0.93–1.32) 1.09 (0.91–1.31)
1.73 (1.51–1.98)***††† 1.52 (1.31–1.76)***†††
1 (ref.) 1 (ref.)
0.93 (0.74–1.17) 0.94 (0.74–1.19)
1.71 (1.45–2.02)***††† 1.54 (1.30–1.84)***†††
1 (ref.) 1 (ref.)
1.00 (0.79–1.27) 0.98 (0.77–1.25)
1.72 (1.45–2.04)***††† 1.34 (1.12–1.61)**†
1 (ref.) 1 (ref.)
0.85 (0.69–1.04) 0.81 (0.65–1.00)
1.36 (1.17–1.59)***††† 1.10 (0.93–1.29)††
1 (ref.) 1 (ref.)
1.00 (0.86–1.17) 0.94 (0.81–1.10)
1.63 (1.46–1.83)***††† 1.26 (1.12–1.43)***†††
1 (ref.) 1 (ref.)
1.08 (0.88–1.32) 0.97 (0.78–1.19)
1.51 (1.28–1.77)***†† 1.07 (0.90–1.27)
1 (ref.) 1 (ref.)
1.08 (0.77–1.52) 1.04 (0.73–1.47)
1.73 (1.34–2.23)***† 1.29 (0.98–1.70)
1 (ref.) 1 (ref.)
0.92 (0.64–1.33) 0.82 (0.56–1.19)
1.46 (1.12–1.91)**† 0.97 (0.73–1.30)
Model 1 adjusts for age, race, and sex. Model 2 adjusts for model 1 variables plus income, education, health insurance, geographic region, urban/rural residence, systolic blood pressure, antihypertensive medication use, BMI, smoking status, alcohol consumption, atrial fibrillation, left ventricular hypertrophy, and history of cardiovascular disease. *P , 0.05 compared with normal glycemia. **P , 0.01 compared with normal glycemia. ***P , 0.001 compared with normal glycemia. †P , 0.05 compared with prediabetes. ††P , 0.01 compared with prediabetes. †††P , 0.001 compared with prediabetes.
cardiovascular outcomes has been weaker than the association reported for diabetes (28). Additionally, no association has been reported for prediabetes and stroke in some studies (9,10). It is possible that some people with prediabetes may have been misclassified in this study because only fasting or random glucose was used to determine prediabetes status and not oral glucose tolerance tests or A1C. Furthermore, while each of these testing methods is acceptable for assessing prediabetes status, there is considerable discordance among their results (29), reflecting current challenges in classifying prediabetes. care.diabetesjournals.org
Metabolic syndrome has been associated with an increased risk of stroke among individuals without diabetes (30), but data investigating the association between metabolic syndrome and stroke symptoms are limited. The current study observed an association between metabolic syndrome and any stroke symptom but not two or more stroke symptoms after multivariable adjustment. Additionally, metabolic syndrome was not associated with the individual stroke symptoms of vision loss and lost ability to understand, although these symptoms were associated with diabetes in this study.
It is unclear whether the stroke symptoms reported among people with diabetes in this study represent unrecognized cerebral infarcts specifically or some other pathophysiologic process, possibly related to diabetes complications (e.g., retinopathy, neuropathy). Brain imaging was not available in this study; thus, we could not confirm the prevalence of imaging-confirmed strokes. It is notable that previous studies have reported mostly null findings for the association between diabetes and silent cerebral infarctions (31– 35), with the exception of the Rotterdam Scan Study, which reported an association between diabetes and incident silent
DIABETES CARE, VOLUME 35, SEPTEMBER 2012
1849
Diabetes and stroke symptoms
Figure 2dPrevalence of two or more stroke symptoms and stroke symptom clusters by diabetes status: the REGARDS study.
cerebral infarctions over 3.5 years of follow-up (36). Additionally, inconsistent findings have been reported for the association between prediabetes and silent cerebral infarctions (37,38). The current study focused on clinically overt symptoms, which may or may not have been evaluated by a physician, and the relationship between these overt stroke symptoms and truly silent cerebral infarcts is not clear. The QVSS used in this study assessed the sudden onset of unilateral numbness and weakness, whereas diabetic neuropathy typically does not have a sudden onset and often presents bilaterally. Stroke symptom clusters, which may be less prone to misclassification, were also more common among individuals with diabetes in the current study. However, the prevalence of stroke symptom clusters was low 1850
overall, limiting the power of this analysis. While the QVSS has demonstrated good sensitivity and modest specificity compared with stroke status determined by a neurologist in a general medicine population (25), its performance in a population of people with diabetes has not been evaluated. This study has additional potential limitations. A history of stroke/TIA was determined using self-reported physician diagnosis. These questions have been shown to be reliable (23) but are subject to recall bias. Additionally, the classification for diabetes, prediabetes, and normal glycemia was determined using a single fasting or random glucose measurement among those who did not use insulin or oral diabetes medications and did not report a history of diabetes. For a clinical diagnosis of diabetes, it is recommended
DIABETES CARE, VOLUME 35, SEPTEMBER 2012
that a repeat test is performed to verify a diagnosis, but this was not available in this study, and duration of diabetes was not assessed either. Additionally, residual confounding is a possibility in this analysis. The REGARDS study also has several strengths, including its large national sample of middle-aged and older adults, inclusion of a large sample of African Americans who are at high risk of both stroke and other diabetes complications, and the collection of demographic, behavioral, clinical, and laboratory data following a standardized study protocol. In summary, in this study of individuals from a large national, populationbased study who reported no diagnosis of stroke, stroke symptoms were common among those with diabetes, and diabetes was independently associated with stroke symptoms. Given that 42% of participants care.diabetesjournals.org
Carson and Associates with stroke symptoms have reported not seeking medical care for these symptoms (39), the need for physicians to actively query about potential stroke symptoms and implement stroke risk reduction strategies, including pharmacologic therapy when indicated, is underscored. These findings have implications for stroke prevention efforts and suggest that screening for stroke symptoms among individuals with diabetes may be warranted.
4.
5.
6. AcknowledgmentsdThis research project was supported by cooperative agreement U01 NS041588 from the National Institute of Neurological Disorders and Stroke, National Institutes of Health, Department of Health and Human Services. A.P.C. received additional support from the National Institute of Diabetes and Digestive and Kidney Diseases (P60DK079626). The content is solely the responsibility of the authors and does not necessarily represent the official views of the National Institute of Neurological Disorders and Stroke or the National Institutes of Health. No potential conflicts of interest relevant to this article were reported. A.P.C. and P.M. researched data, contributed to the discussion, wrote the manuscript, and reviewed and edited the manuscript. B.M.K. and D.O.K. contributed to the discussion and reviewed and edited the manuscript. V.J.H. researched data, contributed to the discussion, and reviewed and edited the manuscript. J.F.M., L.S.W., and R.J.P. contributed to the discussion and reviewed and edited the manuscript. G.H. and M.M.S. researched data, contributed to the discussion, and reviewed and edited the manuscript. A.P.C. is the guarantor of this work and, as such, had full access to all the data in the study and takes responsibility for the integrity of the data and the accuracy of the data analysis. Parts of this study were presented in abstract form at the American Heart Association Council on Epidemiology and Prevention, Atlanta, Georgia, 23–25 March 2011. The authors thank the investigators and staff of the REGARDS study for their valuable contributions.
7.
8.
9.
10.
11.
12.
13. References 1. Cowie CC, Rust KF, Ford ES, et al. Full accounting of diabetes and pre-diabetes in the U.S. population in 1988-1994 and 20052006. Diabetes Care 2009;32:287–294 2. Sarwar N, Gao P, Seshasai SR, et al.; Emerging Risk Factors Collaboration. Diabetes mellitus, fasting blood glucose concentration, and risk of vascular disease: a collaborative meta-analysis of 102 prospective studies. Lancet 2010;375: 2215–2222 3. Janghorbani M, Hu FB, Willett WC, et al. Prospective study of type 1 and type 2 care.diabetesjournals.org
14.
15.
diabetes and risk of stroke subtypes: the Nurses’ Health Study. Diabetes Care 2007;30:1730–1735 Ohira T, Shahar E, Chambless LE, Rosamond WD, Mosley TH Jr, Folsom AR. Risk factors for ischemic stroke subtypes: the Atherosclerosis Risk in Communities study. Stroke 2006;37:2493–2498 Tanne D, Koren-Morag N, Goldbourt U. Fasting plasma glucose and risk of incident ischemic stroke or transient ischemic attacks: a prospective cohort study. Stroke 2004;35:2351–2355 Vermeer SE, Sandee W, Algra A, Koudstaal PJ, Kappelle LJ, Dippel DWJ; Dutch TIA Trial Study Group. Impaired glucose tolerance increases stroke risk in nondiabetic patients with transient ischemic attack or minor ischemic stroke. Stroke 2006;37:1413–1417 Doi Y, Ninomiya T, Hata J, et al. Impact of glucose tolerance status on development of ischemic stroke and coronary heart disease in a general Japanese population: the Hisayama study. Stroke 2010;41:203–209 Sung J, Song Y-M, Ebrahim S, Lawlor DA. Fasting blood glucose and the risk of stroke and myocardial infarction. Circulation 2009;119:812–819 Folsom AR, Rasmussen ML, Chambless LE, et al.; The Atherosclerosis Risk in Communities (ARIC) Study Investigators. Prospective associations of fasting insulin, body fat distribution, and diabetes with risk of ischemic stroke. Diabetes Care 1999;22:1077–1083 Zhang Y, Galloway JM, Welty TK, et al. Incidence and risk factors for stroke in American Indians: the Strong Heart Study. Circulation 2008;118:1577–1584 Chambless LE, Toole JF, Nieto FJ, Rosamond W, Paton C. Association between symptoms reported in a population questionnaire and future ischemic stroke: the ARIC study. Neuroepidemiology 2004; 23:33–37 Hart CL, Hole DJ, Smith GD. The relation between questions indicating transient ischaemic attack and stroke in 20 years of follow up in men and women in the Renfrew/Paisley Study. J Epidemiol Community Health 2001;55:653–656 Kleindorfer D, Judd S, Howard VJ, et al. Self-reported stroke symptoms without a prior diagnosis of stroke or transient ischemic attack: a powerful new risk factor for stroke. Stroke 2011;42:3122–3126 Howard VJ, McClure LA, Meschia JF, Pulley L, Orr SC, Friday GH. High prevalence of stroke symptoms among persons without a diagnosis of stroke or transient ischemic attack in a general population: the REasons for Geographic And Racial Differences in Stroke (REGARDS) study. Arch Intern Med 2006;166:1952–1958 Howard VJ, Cushman M, Pulley L, et al. The REasons for Geographic And Racial Differences in Stroke study: objectives
16.
17.
18.
19.
20. 21.
22.
23.
24.
25.
26. 27.
and design. Neuroepidemiology 2005;25: 135–143 U.S. Department of Agriculture and U.S. Department of Health and Human Services. Dietary Guidelines for Americans. 7th ed. Washington, DC, U.S. Government Printing Office, 2010 Howard VJ, Woolson RF, Egan BM, et al. Prevalence of hypertension by duration and age at exposure to the stroke belt. J Am Soc Hypertens 2010;4:32–41 Prineas RJ, Crow RS, Blackburn H. The Minnesota Code Manual of Electrocardiographic Findings. Boston, MA, John Wright PSG, Inc., 1982 Soliman EZ, Howard G, Prineas RJ, McClure LA, Howard VJ. Calculating Cornell voltage from nonstandard chest electrode recording site in the REasons for Geographic And Racial Differences in Stroke study. J Electrocardiol 2010;43: 209–214 American Diabetes Association. Standards of medical care in diabetesd2010. Diabetes Care 2010;33(Suppl. 1):S11–S61 Alberti KGMM, Eckel RH, Grundy SM, et al.; International Diabetes Federation Task Force on Epidemiology and Prevention; Hational Heart, Lung, and Blood Institute; American Heart Association; World Heart Federation; International Atherosclerosis Society; International Association for the Study of Obesity. Harmonizing the metabolic syndrome: a joint interim statement of the International Diabetes Federation Task Force on Epidemiology and Prevention; National Heart, Lung, and Blood Institute; American Heart Association; World Heart Federation; International Atherosclerosis Society; and International Association for the Study of Obesity. Circulation 2009;120:1640–1645 Jones WJ, Williams LS, Meschia JF. Validating the Questionnaire for Verifying Stroke-Free Status (QVSFS) by neurological history and examination. Stroke 2001;32:2232–2236 Meschia JF, Lojacono MA, Miller MJ, Brott TG, Atkinson EJ, O’Brien PC. Reliability of the Questionnaire for Verifying StrokeFree Status. Cerebrovasc Dis 2004;17: 218–223 Meschia JF, Brott TG, Chukwudelunzu FE, et al. Verifying the stroke-free phenotype by structured telephone interview. Stroke 2000;31:1076–1080 Sung VW, Johnson N, Granstaff US, et al. Sensitivity and specificity of stroke symptom questions to detect stroke or transient ischemic attack. Neuroepidemiology 2011; 36:100–104 Schafer JL. Multiple imputation: a primer. Stat Methods Med Res 1999;8:3–15 Chambless LE, Shahar E, Sharrett AR, et al. Association of transient ischemic attack/ stroke symptoms assessed by standardized questionnaire and algorithm with cerebrovascular risk factors and carotid artery wall
DIABETES CARE, VOLUME 35, SEPTEMBER 2012
1851
Diabetes and stroke symptoms
28.
29.
30.
31.
thickness. The ARIC Study, 1987-1989. Am J Epidemiol 1996;144:857–866 Ford ES, Zhao G, Li C. Pre-diabetes and the risk for cardiovascular disease: a systematic review of the evidence. J Am Coll Cardiol 2010;55:1310–1317 Mann DM, Carson AP, Shimbo D, Fonseca V, Fox CS, Muntner P. Impact of A1C screening criterion on the diagnosis of pre-diabetes among U.S. adults. Diabetes Care 2010;33:2190–2195 Najarian RM, Sullivan LM, Kannel WB, Wilson PWF, D’Agostino RB, Wolf PA. Metabolic syndrome compared with type 2 diabetes mellitus as a risk factor for stroke: the Framingham Offspring Study. Arch Intern Med 2006;166:106– 111 Howard G, Wagenknecht LE, Cai J, Cooper L, Kraut MA, Toole JF. Cigarette smoking and other risk factors for silent
1852
32.
33.
34.
35.
DIABETES CARE, VOLUME 35, SEPTEMBER 2012
cerebral infarction in the general population. Stroke 1998;29:913–917 Longstreth WT Jr, Bernick C, Manolio TA, Bryan N, Jungreis CA, Price TR. Lacunar infarcts defined by magnetic resonance imaging of 3660 elderly people: the Cardiovascular Health Study. Arch Neurol 1998;55:1217–1225 Longstreth WT Jr, Dulberg C, Manolio TA, et al. Incidence, manifestations, and predictors of brain infarcts defined by serial cranial magnetic resonance imaging in the elderly: the Cardiovascular Health Study. Stroke 2002;33:2376–2382 Prabhakaran S, Wright CB, Yoshita M, et al. Prevalence and determinants of subclinical brain infarction: the Northern Manhattan Study. Neurology 2008;70: 425–430 Vermeer SE, Koudstaal PJ, Oudkerk M, Hofman A, Breteler MMB. Prevalence and
36.
37.
38.
39.
risk factors of silent brain infarcts in the population-based Rotterdam Scan Study. Stroke 2002;33:21–25 Vermeer SE, Den Heijer T, Koudstaal PJ, Oudkerk M, Hofman A, Breteler MMB; Rotterdam Scan Study. Incidence and risk factors of silent brain infarcts in the population-based Rotterdam Scan Study. Stroke 2003;34:392–396 Kwon H-M, Kim BJ, Park J-H, et al. Significant association of metabolic syndrome with silent brain infarction in elderly people. J Neurol 2009;256:1825–1831 Kwon H-M, Kim BJ, Lee S-H, Choi SH, Oh B-H, Yoon B-W. Metabolic syndrome as an independent risk factor of silent brain infarction in healthy people. Stroke 2006; 37:466–470 Howard VJ, Lackland DT, Lichtman JH, et al. Care seeking after stroke symptoms. Ann Neurol 2008;63:466–472
care.diabetesjournals.org