Mem. S.A.It. Vol. 0, 0 c SAIt 2008
Memorie
della
Astrometry of brown dwarfs with Gaia
arXiv:1404.3896v1 [astro-ph.SR] 15 Apr 2014
J.H.J. de Bruijne Scientific Support Office in the Directorate of Science and Robotic Exploration of the European Space Agency, Postbus 299, 2200AG, Noordwijk, The Netherlands e-mail:
[email protected]
Abstract. Europe’s Gaia spacecraft will soon embark on its five-year mission to measure
the absolute parallaxes of the complete sample of 1, 000 million objects down to 20 mag. It is expected that thousands of nearby brown dwarfs will have their astrometry determined with sub-milli-arcsecond standard errors. Although this level of accuracy is comparable to the standard errors of the relative parallaxes that are now routinely obtained from the ground for selected, individual objects, the absolute nature of Gaia’s astrometry, combined with the sample increase from one hundred to several thousand sub-stellar objects with known distances, ensures the uniqueness of Gaia’s legacy in brown-dwarf science for the coming decade(s). We shortly explore the gain in brown-dwarf science that could be achieved by lowering Gaia’s faint-end limit from 20 to 21 mag and conclude that two spectral-type subclasses could be gained in combination with a fourfold increase in the solar-neighbourhoodvolume sampled by Gaia and hence in the number of brown dwarfs in the Gaia Catalogue. Key words. Surveys – Astrometry – Parallaxes – Stars: brown dwarfs – Stars: distances
1. Introduction Gaia is the current astrometry mission of the European Space Agency (ESA), following up on the success of the Hipparcos mission. With a focal plane containing 106 CCD detectors, Gaia is about to start surveying the entire sky and repeatedly observe the brightest 1, 000 million objects, down to 20th magnitude, during its five-year lifetime. Gaia’s science data comprises absolute astrometry, broadband photometry, and low-resolution spectrophotometry. Spectroscopic data with a resolving power of 11, 500 will be obtained for the brightest 150 million sources, down to 17th magnitude. The thermo-mechanical stability of the spacecraft, combined with the selection of the L2 Lissajous point of the SunEarth/Moon system for operations, allows par-
allaxes to be measured with standard errors less than 10 micro-arcsecond (µas) for stars brighter than 12th magnitude, 25 µas for stars at 15th magnitude, and 300 µas at magnitude 20. Photometric standard errors are in the millimagnitude regime. The spectroscopic data allows the measurement of radial velocities with errors of 15 km s−1 at magnitude 17. Gaia’s primary science goal is to unravel the kinematical, dynamical, and chemical structure and evolution of the Milky Way. In addition, Gaia’s data will revolutionise many other areas of science, e.g., stellar physics, solar-system bodies, fundamental physics, exo-planets, and – last but not least – brown dwarfs. The Gaia spacecraft has been launched on 19 December 2013 and will start its science mission in the summer of 2014. The science community in
De Bruijne: Astrometry of brown dwarfs with Gaia
1
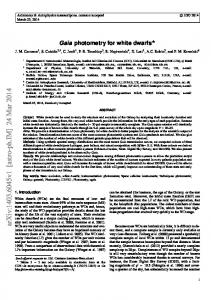
Fig. 1. Variation over the sky, in equatorial coordinates, of the difference between the sky-average, endof-mission parallax standard error at G = 20 mag (σπ = 332 µas, colour coded in white) and the local, end-of-mission parallax standard error, in units of µas, from http://www.cosmos.esa.int/web/gaia/ science-performance. The variation is caused by Gaia’s scanning law. The red, curved band follows the ecliptic plane and the blue areas denote the ecliptic-pole regions.
Europe, organised in the Data Processing and Analysis Consortium (DPAC), is responsible for the processing of the data. The first intermediate data is expected to be released some two years after launch while the final catalogue is expected around 2022. ESA’s community web portal http://www.cosmos.esa.int/ gaia provides more information on the Gaia mission, including bibliographies.
2. Gaia parallaxes Gaia’s science performance has been studied by de Bruijne (2012) and is also presented on http://www.cosmos.esa.int/ web/gaia/science-performance. In short, for a given V magnitude and V −I colour index, the end-of-mission parallax standard error, σπ in units of µas, averaged over the sky, can be calculated as: σπ = [9.3 + 658.1 · z + 4.568 · z2 ]1/2 · ·[0.986 + (1 − 0.986) · (V − I)],
(1)
where: z = MAX[100.4·(12−15) , 100.4·(G−15) ],
(2)
is a flux-based, auxiliary quantity, taking saturation at G = 12 mag into account, and (following Jordi et al. 2010, but updated with the most recent coefficients): G = V − 0.0208 − 0.1004 · (V − I) + −0.1593 · (V − I)2 + 0.0083 · (V − I)3 (3) denotes the broad-band Gaia magnitude. For a five-year Gaia mission, the sky-averaged position and proper-motion standard errors, σ0 and σµ in units of µas and µas year−1 , respectively, are: σ0 = 0.743 · σπ ; σµ = 0.526 · σπ .
(4) (5)
For example, at G = 20 mag, one finds σπ = 332 µas. Figure 1 shows the variation of σπ over the sky as induced by Gaia’s scanning law.
2
De Bruijne: Astrometry of brown dwarfs with Gaia
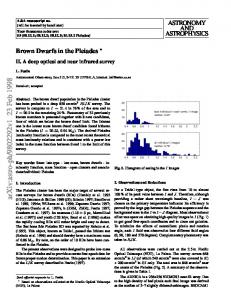
Fig. 2. End-of-mission parallax standard error, in milli-arcsecond (mas), for Gaia (dashed, red line) and the Large Synoptic Survey Telescope (blue; LSST), as function of r magnitude, from Eyer et al. (2012). Following Jordi et al. (2010), but updated with the most recent coefficients, we have G − r = −0.0501 + ˘ 0.1598 · (r − i) − 0.5613 · (r − i)2 + 0.0628 · (r − i)3 . Figure courtesy Laurent Eyer and Zeljko Ivezi´c. Table 1. Sky-averaged Gaia astrometric standard errors between G = 20 and 21 mag for three assumed detection probabilities. The [min–max] range for the parallax error denotes the variation over the sky. Even with modest detection percentages (pdet = 50%), Gaia can deliver sub-mas astrometry at G = 21 mag. G mag
σπ [min – max] µas
20.0 20.5 21.0
Detection probability 332 [233 - 384] 466 [326 - 539] 670 [469 - 775]
pdet = 100% 247 175 346 245 498 353
20.0 20.5 21.0
Detection probability 372 [260 - 430] 521 [365 - 602] 749 [525 - 866]
pdet = 80% 276 195 387 274 557 394
Detection probability 20.0 470 [329 - 543] 20.5 659 [461 - 762] 21.0 948 [664 - 1096]
pdet = 50% 349 247 489 347 704 499
σ0 µas
σµ µas year−1
3. Gaia’s faint-end limit Gaias default faint-star limit is G = 20 mag. This value, however, is a configurable parameter in the on-board detection software. Investigations by de Bruijne et al. (2014) have shown that, in principle, Gaia’s intrinsic de-
tection probability is very close to 100% all the way down to G = 21 mag. Simply ignoring the practical complications and programmatic implications, a natural question to ask is whether it is scientifically interesting to lower Gaia’s survey limit from G = 20 to 21 mag. The extra science that is available in this magnitude range comprises proper motions of distant, faint halo stars (e.g., Re Fiorentin et al. 2012), astrometry of white dwarfs in the solar neighbourhood (e.g., Carrasco et al. 2014), and solar-neighbourhood brown-dwarf science such as the sub-stellar mass function, threedimensional modelling of cool atmospheres, etc. (e.g., Haywood & Jordi 2002; Sarro et al. 2013). Additional science cases which would also benefit from going deeper include ultrafaint dwarf galaxies, asteroids, and so-called global parameters in the astrometric global iterative solution for which quasars are used (e.g., reference-frame parameters, the energy flux of primordial gravity waves, or the acceleration of the solar-system barycentre; e.g., Bachchan et al. 2012). Gaia’s capabilities to deliver all-sky, absolute astrometry are unique and a successor mission is not likely to be launched before the mid 2030’s. Clearly, one can do (relative) astrometry from the ground and one particularly interesting project currently in development is the Large Synoptic Survey Telescope (LSST, http://www.lsst.org/), which will provide six-band (u, g, r, i, z, y) photometry for some 10 billion stars down to 24th mag in
De Bruijne: Astrometry of brown dwarfs with Gaia
3
Fig. 3. Colour, absolute-magnitude, and spectral-type relations for late-type objects, from Dahn et al. (2002). The dashed red lines indicate the linear relations – “fit by eye” – used in this work (see Table 2). 20, 000 deg2 observed twice per week during 10 years. The predictions of the precision of the astrometry that LSST will provide in the Gaia reference frame are shown in Figure 2, which suggests that there is a gap between Gaia’s nominal faint limit at 20 mag and LSST’s bright limit around 21 mag. This gap can, in principle, be closed by Gaia, after which LSST would provide a near-perfect extension of Gaia by ∼4 magnitudes.
4. Gaia astrometry for brown dwarfs So far, about 100 solar-neighbourhood brown dwarfs have had their relative parallaxes measured from the ground with percent-level precisions and (sub-)mas-level standard errors (e.g., Faherty et al. 2012; Smart et al. 2013; Marocco
et al. 2013; Manjavacas et al. 2013; Wang et al. 2014, see DwarfArchives.org for a compilation). In the area of parallax standard errors, Gaia will perform better but not spectacularly: most brown dwarfs will be faint and hence will have Gaia parallax standard errors in the range of a few hundred µas (Table 1). One should, however, recall that Gaia’s astrometry is absolute and not relative. In the area of sample size, estimations are that a few thousand brown dwarfs with G < 20 mag will be accessible to Gaia, which constitutes a significant increase in number from the current ∼100 dwarfs with parallaxes; in addition, Gaia’s allsky brown-dwarf sample will not be hampered by (kinematic and/or spatial) selection effects such as the galactic-plane avoidance zone in the current sample of known brown dwarfs (see
4
De Bruijne: Astrometry of brown dwarfs with Gaia
Table 2. Brown-dwarf astrometry with Gaia. (1) Spectral type. (2) Absolute I-band magnitude (see Figure 3). (3) V − I colour index (see Figure 3). (4) Absolute V-band magnitude (see Figure 3). (5) V magnitude at 30 pc distance. (6) G magnitude at 30 pc distance. With a limiting magnitude of G = 20 mag, L4 brown dwarfs can be seen out to 30 pc. At G = 21 mag, this would improve to L6 dwarfs at 30 pc. (7) Distance limit, in pc, corresponding to G = 20.0 mag. (8) Relative parallax error at that distance (assuming pdet = 100%). A 1% relative parallax error is reached for an L4 dwarf at 30 pc. (9) Distance limit, in pc, corresponding to G = 20.5 mag. (10) Relative parallax error at that distance (assuming pdet = 80%). A 1% relative parallax error is reached for an L7 dwarf at 20 pc. (11) Distance limit, in pc, corresponding to G = 21.0 mag. (12) Relative parallax error at that distance (assuming pdet = 50%). A 1% relative parallax error is reached for a T1 dwarf at 10 pc. (1) SpT
(2) MI mag
(3) V−I mag
(4) MV mag
(5) V mag @30 pc
(6) G mag @30 pc
M5 M6 M7 M8 M9 L0 L1 L2 L3 L4 L5 L6 L7 L8 L9 T0 T1 T2 T3 T4 T5 T6 T7 T8 T9
12.00 12.46 12.92 13.38 13.83 14.29 14.75 15.21 15.67 16.13 16.58 17.04 17.50 17.96 18.42 18.88 19.33 19.79 20.25 20.71 21.17 21.63 22.08 22.54 23.00
4.00 4.12 4.23 4.35 4.47 4.58 4.70 4.82 4.93 5.05 5.17 5.28 5.40 5.52 5.63 5.75 5.87 5.98 6.10 6.22 6.33 6.45 6.57 6.68 6.80
16.00 16.58 17.15 17.73 18.30 18.88 19.45 20.03 20.60 21.18 21.75 22.33 22.90 23.48 24.05 24.63 25.20 25.78 26.35 26.93 27.50 28.08 28.65 29.23 29.80
18.39 18.96 19.54 20.11 20.69 21.26 21.84 22.41 22.99 23.56 24.14 24.71 25.29 25.86 26.44 27.01 27.59 28.16 28.74 29.31 29.89 30.46 31.04 31.61 32.19
15.95 16.41 16.86 17.32 17.78 18.23 18.69 19.14 19.59 20.04 20.49 20.94 21.38 21.83 22.28 22.72 23.17 23.61 24.06 24.50 24.95 25.39 25.84 26.28 26.73
Figure 1 in Smart 2009). If Gaia’s faint limit would be extended by 0.5 mag, the local galactic volume sampled by Gaia would increase by a factor two; if the magnitude limit would be lowered by 1.0 mag, the volume and samplesize increase would be a factor four.
(7) (8) d σπ /π pc % G = 20.0 mag pdet = 100%
(9) (10) d σπ /π pc % G = 20.5 mag pdet = 80%
(11) (12) d σπ /π pc % G = 21.0 mag pdet = 50%
194 157 127 103 83 68 55 45 36 29 24 19 16 13 11 9 7 6 5 4 3 3 2 2 1
244 198 160 130 105 85 69 56 46 37 30 25 20 16 13 11 9 7 6 5 4 3 3 2 2
308 249 201 163 132 107 87 71 57 47 38 31 25 20 17 14 11 9 7 6 5 4 3 3 2
6.45 5.22 4.23 3.42 2.77 2.25 1.83 1.48 1.20 0.98 0.80 0.65 0.53 0.43 0.35 0.28 0.23 0.19 0.15 0.13 0.10 0.08 0.07 0.06 0.05
12.73 10.30 8.33 6.75 5.47 4.44 3.60 2.93 2.38 1.93 1.57 1.28 1.04 0.85 0.69 0.56 0.46 0.37 0.30 0.25 0.20 0.16 0.13 0.11 0.09
29.16 23.59 19.10 15.47 12.54 10.17 8.26 6.70 5.45 4.43 3.60 2.93 2.38 1.94 1.58 1.29 1.05 0.85 0.70 0.57 0.46 0.38 0.31 0.25 0.20
Table 2 shows what Gaia can achieve in terms of parallax standard errors as function of spectral type. There are three ways in which one can quantify the gain of going one magnitude deeper:
De Bruijne: Astrometry of brown dwarfs with Gaia
1. One magnitude deeper gains two browndwarf spectral-type sub-classes at a given distance: (a) G = 20.0 mag allows, for instance, reaching L4 brown dwarfs at 30 pc (or L6 ones at 20 pc); (b) G = 20.5 mag allows, for instance, reaching L5 brown dwarfs at 30 pc (or L7 ones at 20 pc); (c) G = 21.0 mag allows, for instance, reaching L6 brown dwarfs at 30 pc (or L8 ones at 20 pc); 2. One magnitude deeper increases the distance range for a given spectral type by 60% and the volume sampled by 300%: (a) G = 20.0 mag allows reaching L5 brown dwarfs at 24 pc with 0.8% relative parallax error (for pdet = 100%); (b) G = 20.5 mag allows reaching L5 brown dwarfs at 30 pc with 1.6% relative parallax error (for pdet = 80%); (c) G = 21.0 mag allows reaching L5 brown dwarfs at 38 pc with 3.6% relative parallax error (for pdet = 50%); 3. One magnitude deeper increases the distance at which a 1% relative parallax error is reached and/or moves the spectral classification to later types: (a) G = 20.0 mag allows reaching a 1% relative parallax error for an L4 dwarf at 30 pc (assuming pdet = 100%); (b) G = 20.5 mag allows reaching a 1% relative parallax error for an L7 dwarf at 20 pc (assuming pdet = 80%); (c) G = 21.0 mag allows reaching a 1% relative parallax error for a T1 dwarf at 10 pc (assuming pdet = 50%).
5. Conclusions With a nominal survey limit at G = 20 mag, Gaia will make a significant contribution to brown-dwarf science by delivering sub-milliarcsecond absolute astrometry of an unbiased, all-sky sample of thousands of brown dwarfs in the solar neighbourhood. By lowering the limit to G = 21 mag, this sample can, in principle, i.e., when ignoring programmatic limitations, be increased in number by a factor four.
5
Acknowledgements. It is a pleasure to thank the local organising committee, and Ricky Smart in particular, for an enjoyable workshop. This research has benefited from the M, L, T, and Y dwarf compendium compiled by Chris Gelino, Davy Kirkpatrick, Mike Cushing, David Kinder, and Adam Burgasser and housed at DwarfArchives.org.
References Bachchan R.K., Hobbs D., Lindegren L., Aug. 2012, In: IAU Joint Discussion, vol. 7 of IAU Joint Discussion, 7P Carrasco J.M., Catal´an S., Jordi C., et al., Mar. 2014, ArXiv e-prints Dahn C.C., Harris H.C., Vrba F.J., et al., Aug. 2002, AJ, 124, 1170 de Bruijne J.H.J., Sep. 2012, Ap&SS, 341, 31 de Bruijne J.H.J., Allen M., Prod’homme T., Krone-Martins A., Azaz S., 2014, A&A, submitted Eyer L., Dubath P., Mowlavi N., et al., Apr. 2012, In: Richards M.T., Hubeny I. (eds.) IAU Symposium, vol. 282 of IAU Symposium, 33–40 Faherty J.K., Burgasser A.J., Walter F.M., et al., Jun. 2012, ApJ, 752, 56 Haywood M., Jordi C., 2002, In: Bienayme O., Turon C. (eds.) EAS Publications Series, vol. 2 of EAS Publications Series, 199–205 Jordi C., Gebran M., Carrasco J.M., et al., Nov. 2010, A&A, 523, A48 Manjavacas E., Goldman B., Reffert S., Henning T., Dec. 2013, A&A, 560, A52 Marocco F., Andrei A.H., Smart R.L., et al., Dec. 2013, AJ, 146, 161 Re Fiorentin P., Curir A., Lattanzi M.G., Murante G., Spagna A., Dec. 2012, In: Boissier S., de Laverny P., Nardetto N., et al. (eds.) SF2A-2012: Proceedings of the Annual meeting of the French Society of Astronomy and Astrophysics, 113–116 Sarro L.M., Berihuete A., Carri´on C., et al., Feb. 2013, A&A, 550, A44 Smart R.L., 2009, Mem. Soc. Astron. Italiana, 80, 674 Smart R.L., Tinney C.G., Bucciarelli B., et al., Aug. 2013, MNRAS, 433, 2054 Wang Y., Jones H.R.A., Smart R.L., et al., Jan. 2014, PASP, 126, 15