The Journal of Neuroscience, April 9, 2014 • 34(15):5291–5301 • 5291
Systems/Circuits
Auditory Thalamus and Auditory Cortex Are Equally Modulated by Context during Flexible Categorization of Sounds Santiago Jaramillo, Katharine Borges, and Anthony M. Zador Cold Spring Harbor Laboratory, Cold Spring Harbor, New York 11724
In a dynamic world, animals must adapt rapidly to changes in the meaning of environmental cues. Such changes can influence the neural representation of sensory stimuli. Previous studies have shown that associating a stimulus with a reward or punishment can modulate neural activity in the auditory cortex (AC) and its thalamic input, the medial geniculate body (MGB). However, it is not known whether changes in stimulus–action associations alone can also modulate neural responses in these areas. We designed a categorization task for rats in which the boundary that separated low- from high-frequency sounds varied several times within a behavioral session, thus allowing us to manipulate the action associated with some sounds without changing the associated reward. We developed a computational model that accounted for the rats’ performance and compared predictions from this model with sound-evoked responses from single neurons in AC and MGB in animals performing this task. We found that the responses of 15% of AC neurons and 16% of MGB neurons were modulated by changes in stimulus–action association and that the magnitude of the modulation was comparable between the two brain areas. Our results suggest that the AC and thalamus play only a limited role in mediating changes in associations between acoustic stimuli and behavioral responses. Key words: auditory; categorization; flexibility; reward; stimulus–action association
Introduction Categorization is the process by which potentially discriminable stimuli are assigned to functionally equivalent classes (Russ et al., 2007; Holt and Lotto, 2010). In a dynamic world, category definitions can vary, requiring organisms to adapt and switch rapidly between categorization rules depending on context. As a consequence of these changes, sensory stimuli that initially belong to one category and are associated with a particular behavioral response may, at different points in time, belong to other categories and require different responses. An impaired ability to adapt to these varying contingencies is one of the hallmarks of disorders such as schizophrenia and autism (Goldberg and Weinberger, 1988; Hill, 2004; Floresco et al., 2009). Do sensory areas such as auditory thalamus and auditory cortex (AC) play a key role in flexible categorization or do they simply represent stimuli independently of their meaning? Previ-
Received Nov. 20, 2013; revised March 4, 2014; accepted March 8, 2014. Author contributions: S.J. and A.Z. designed research; S.J. and K.B. performed research; S.J. and K.B. analyzed data; S.J., K.B., and A.Z. wrote the paper. This work was supported by the National Institutes of Health (Grant 5R01DC012565– 02) and the Swartz Foundation. We thank B. J. Burbach for technical assistance. The authors declare no competing financial interests. Correspondence should be addressed to Santiago Jaramillo, Department of Biology, 1210 University of Oregon, Eugene, OR 97403. E-mail:
[email protected]. S. Jaramillo’s present address: Institute of Neuroscience and Department of Biology, University of Oregon, Eugene OR 97403. K. Borges’s present address: Department of Physiology, Northwestern University, Chicago IL 60611. DOI:10.1523/JNEUROSCI.4888-13.2014 Copyright © 2014 the authors 0270-6474/14/345291-11$15.00/0
ous studies have demonstrated the formation of specific plasticity in auditory circuits when sounds are associated with the presence of a reinforcer (Weinberger, 1993; Fritz et al., 2003; Ohl and Scheich, 2005). It is not clear, however, if similar changes in representations occur when the sound–reinforcer association remains constant (e.g., if the sound always indicates the location of reward) but the sound–action association (e.g., the associated reward location) varies. Moreover, it is not known whether contextual influences on sound representation differ between AC and thalamus. To address these questions, we characterized the soundevoked responses of neurons from the AC and its thalamic input, the medial geniculate body (MGB), during a task in which the stimulus–reward association was kept constant while the stimulus–action associations changed. Specifically, we designed a sound-categorization task for rats in which the boundary that separates low- from high-frequency sounds varied from one block of trials to the next several times within a behavioral session. Therefore, the action required to obtain reward for stimuli near the boundary changed from one contingency to another, whereas actions for stimuli far from the boundary remained unchanged. We developed a computational model that accounted for the dynamics of the rats’ choices as they switched between categorization contingencies. To test the role of the MGB and the AC under the assumptions of this model, we quantified (via extracellular recordings) the sound-evoked responses from neurons in these areas as animals switched between categorization contin-
Jaramillo et al. • MGB and AC Modulation during Flexible Categorization
5292 • J. Neurosci., April 9, 2014 • 34(15):5291–5301
Table 1. Number of training sessions Test
Rats
Sessions before testing
Average trials per session
Behavior only Electrophysiology
9 8
Mean ⫽ 87 (min ⫽ 87) Mean ⫽ 201 (min ⫽ 76)
439 ⫾ 110 565 ⫾ 117
gencies. We found that, although subsets of sound-responsive cells were modulated between contingencies in each brain region, most neurons behaved as purely sensory neurons, consistent with the early stages in the model. These observations suggest that changing the stimulus–action association alone does not result in large changes in the representation of such stimuli in the auditory thalamus and cortex, as has been observed when the amount of reward or punishment predicted by each stimulus changes. Surprisingly, we found no differences in the features of evoked responses, number of modulated cells, or magnitude of modulation between thalamus and cortex.
Materials and Methods Animal subjects. Animal procedures were approved by the Cold Spring Harbor Laboratory Animal Care and Use Committee and performed in accordance with National Institutes of Health standards. A total of 17 adult male Long–Evans rats (Taconic Farms) were used for analysis of switching behavior (eight of these were used for electrophysiological recordings). Rats had ad libitum access to food, but water was restricted. Free water was provided on days with no experimental sessions. Experiments were conducted in single-walled sound booths (Industrial Acoustics). Behavioral task. Rats initiated each trial by poking their noses into the center port of a three-port chamber. After a silent delay of random duration (250 –350 ms, uniformly distributed), a narrow-band sound was presented for 100 ms. Animals were required to stay in the center port until the end of the sound and choose one of the two side ports for reward (24 l of water) according to the frequency of the sound (low-frequency: left port; high-frequency: right port). If animals withdrew before the end of the stimulus, the trial was aborted and ignored in the analysis. Stimuli were chords composed of 16 simultaneous pure tones logarithmically spaced in the range f/1.2 to f⫻1.2 for a given center frequency f. The intensity of the sounds was variable during initial training (50 –70 dB-SPL), but fixed during testing at 60 dB-SPL. Animals were trained to discriminate between sounds centered at 6.5 and 14.2 kHz in one contingency and 14.2 and 31 kHz in another contingency. These frequencies are abbreviated herein as 6, 14, and 31 kHz. A single session consisted of several blocks of 300 trials (during behavioral training) or 150 trials (during electrophysiological recordings). The categorization contingency changed from one block to the next without any cue indicating the change except for the sound–reward relations. The initial contingency in a session was randomized from one day to the next. Measurements (behavioral or electrophysiological) were done only after animals had been extensively trained in the switching task (Table 1). Although, on average, electrophysiology animals were trained for more sessions than those used only for behavior, both cohorts showed similar performance levels (82% and 84%, respectively), suggesting that the number of sessions was sufficient to achieve an asymptotic level of performance. Animals for electrophysiological recordings were chosen in part because they provided more trials per session. Analysis of behavioral performance. Data were analyzed using in-house software developed in Python (www.python.org). To illustrate the dynamics of performance after a switch in contingencies (see Fig. 2A–C), a first cohort of 12 animals was used. Trials from sessions starting with the low-boundary block were averaged to calculate the fraction correct for each trial number. Only sessions with 400 or more trials were included, resulting in 58 sessions per animal on average. The number of trials to switch for each animal (see Fig. 2D) was calculated from sessions starting with the low-boundary block, as the first trial for which the animal’s average performance was above chance level (50%) for two consecutive trials after the first switch.
Psychometric curves of 9 rats were estimated from sessions in which 10% of the trials contained sounds with center frequency logarithmically spaced between 6.5 and 31 kHz. The category boundary, which defined the associated reward port for each of these sounds, was set to the geometric mean of the training exemplars in each condition and the number of trials was balanced so that the fraction of rewards was the same on either side port. Psychometric curves were fit using Psignifit 3.0 (in the Python programming language). Briefly, a constrained maximum likelihood method was used to fit a logistic function with 4 parameters: ␣ (the 50% threshold, or boundary), 1/ (the slope of the curve), ␥ (the lower asymptote), and (the higher asymptote) as follows:
⌿共 x兲 ⫽ ␥ ⫹ 共1 ⫺ ␥ ⫺ 兲
1 1 ⫹ exp共 ⫺g共 x兲兲
g 共 x兲 ⫽
x⫺␣  (1)
Computational learning model. We implemented a firing rate model with plastic synapses. Each input (xi) corresponded to a different soundfrequency channel and the output (z) provided a binary signal that indicated a leftward or rightward choice. For a given stimulus, the value of each input (xi) was calculated according to a Gaussian receptive field (RF) in logarithmic space as follows:
xi ⫽ e⫺
共 f⫺f i 兲 2
(2)
22
where f and fi correspond to the logarithm of the frequency of the stimulus and the RF center, respectively. The width of the RF was set to 0.4 log units and the RFs were logarithmically spaced between 5 and 40 kHz. The output on each trial was calculated as the sum of the inputs weighted by the synaptic strengths passed through a saturating nonlinearity (S) as follows:
z ⫽ S共w ជ ·xជ 兲 ⫽ S
冉冘 冊 w ix i
(3)
i
The synaptic strengths (wi) could take positive or negative values and were modified according to the outcome of the previous trial using a perceptron learning rule (Bishop, 1995) as follows:
w ជ t⫹1 ⫽ w ជ t ⫹ 共 d t ⫺ z t 兲 xជ t
(4)
where dt was the desired choice for trial t and was the learning rate of the system. For the examples in Fig. 4, was fit to replicate the average switching speed of the rats, resulting in a value of 0.03. Noise was introduced at only one stage (inputs, synaptic strengths, or outputs) on each simulation. For the inputs, values drawn from a Gaussian distribution were added to each xi. The SD of this noise was fit to replicate the average asymptotic performance of the rats (80 –90%), resulting in a value of 0.4. For the synaptic strengths, Gaussian noise was added to each wi. An SD of 0.14 resulted in an asymptotic performance similar to that of the rats. For the outputs, Gaussian noise was added to the weighted sum of inputs before the nonlinearity. An SD of 1 replicated the average asymptotic performance of the rats. Surgery. Animals were anesthetized with an intraperitoneal injection of a mixture of ketamine (60 mg/kg) and medetomidine (0.5 mg/kg). Wounds were infiltrated with lidocaine. Rats were surgically implanted with a custom-made microdrive in left AC (two rats), right AC (two rats), or the left auditory thalamus (four rats) containing eight independently adjustable tetrodes. For AC recordings, electrodes were implanted between 3.5 and 6 mm posterior to bregma and 6.5 mm left or right from the midline. For MGB recordings, electrodes were implanted between ⫺5.6 and ⫺6 mm posterior to bregma and between 3.6 and 3.8 mm left from midline. For thalamic recordings, electrodes were lowered beyond 4 mm from the brain surface until we observed sound-evoked responses. Animals were allowed to recover for several days before resuming water restriction and starting recording sessions. Average performance during recordings sessions (86 ⫾ 6%, mean ⫾ SD) was comparable to the performance estimated for these animals before implantation (84 ⫾ 4%). Neuronal recordings. Each tetrode consisted of four polyimide-coated nichrome wires (diameter 12.7 m; Kanthal Palm Coast) twisted together
Jaramillo et al. • MGB and AC Modulation during Flexible Categorization
A
J. Neurosci., April 9, 2014 • 34(15):5291–5301 • 5293
B
For each responsive cell, we calculated a modulation index (MI) to quantify changes in evoked response to the same stimulus between categorization contingencies as follows:
MI ⫽
rc ⫺ ri rc ⫹ ri
(5)
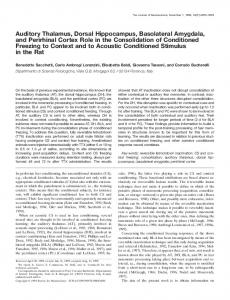
where rc and ri correspond to the evoked firing rates when the stimulus indicated reward on the contralateral or ipsilateral side from the recording site. We included only correct trials in this calculation. We tested statistical significance of the modulation for each cell via a rank-sum test between the evoked firing on each contingency (at a significance level of 0.05). To exclude effects of nonstationarity, D E C cells were counted as significantly modulated only if the sign of the modulation flipped from one contingency switch to the next. That is, if the firing rate increased after the first contingency switch (when the meaning of the sound changed from left reward to right reward), then the firing rate must decrease after the second switch (when the sound indicated again left rewards). Ideal observer analysis. For the ideal observer analysis shown in Figures 7 and 8, we counted the number of evoked spikes in the range 10 – 150 ms from sound onset for each cell on each trial. We then estimated the distribution of Figure 1. Flexible sound-categorization task. A, Rats initiated each trial by poking their noses into the center port of a three-port these spike counts for each stimulus–action chamber. A narrow-band sound was presented for 100 ms, indicating the location of reward: left for low-frequency sounds and condition from half of the trials (randomly seright for high-frequency sounds. B, Psychometric performance for one rat during one discrimination session demonstrating that lected) and used samples from this distribution animals can achieve perfect performance on easy discriminations (6 vs 31 kHz; error bars are 95% confidence intervals). C, To to train a linear discriminator (Machine Learnintroduce flexibility in the task, each session consisted of alternating blocks of 300 trials: in one block type, rats were required to ing Python; Albanese et al., 2012). We used the discriminate between 31 and 14 kHz; in the other block type, between 14 and 6 kHz. This was equivalent to setting the category other half of the trials to estimate the discrimboundary to either a “high” or a “low” frequency value. The middle frequency sound (14 kHz) changed its meaning from one block ination accuracy of the observer given each type to the other. D, Average performance for each of the 17 rats on the first and second blocks of trials when the task started on the neuron on each condition. We quantified the low-boundary block. Each circle corresponds to the average performance across multiple sessions for one animal for each stimulus, sound discrimination performance (see Fig. 7) ignoring the first 100 trials after a block switch. Chance level was 50%. E, Same as D, but when the task started on a high-boundary independently on each contingency, resulting block. Performance level was above chance in all conditions, but consistently lower for the reversing stimulus (14 kHz). in two performance values for each neuron. For choice discrimination, we separated all triand gold plated to an impedance of 0.3– 0.4 M⍀ at 1 kHz. Electrical signals als with associated left rewards from those associated with right rewards passed through unity-gain head stages (Neuralynx) connected to a custom(independently of the stimulus presented). These two groups defined the built array of tetrode microdrives before reaching the acquisition system. dataset given to the linear discriminator. Signals were recorded using a Neuralynx Cheetah 32 recording system. TeTo evaluate whether changes in evoked response between contingentrode depths were adjusted at lest 12 h before recording sessions to sample an cies improved discrimination, we measured the performance of the obindependent population of cells each time while maintaining a stable recordserver with a modified dataset in which the trials containing the reversing ing throughout the session. Tetrode locations were confirmed histologically frequency were swapped between contingencies. For example, instead of based on electrolytic lesions and fluorescent markers (electrodes were coated discriminating between evoked responses from 6 kHz ⫽ L and 14 kHz ⫽ with DiI before implanting). Track reconstructions indicated that we samR (both from the low-boundary condition), the observer had to discrimpled mostly auditory cortical neurons from the primary field (A1; see Fig. inate between responses from 6 kHz ⫽ L and 14 kHz ⫽ L (from the low5A), although we cannot rule out that some neurons were located in the and the high-boundary conditions, respectively). posterior field (Doron et al., 2002). Thalamic recordings targeted all subnuclei (dorsal, ventral, and medial) of the MGB (see Fig. 5B). Results Analysis of neuronal data. Data were analyzed using in-house software Rats reliably switched between categorization contingencies developed in Python (www.python.org). Spiking activity of a total of 665 To study the role of AC and MGB during flexible categorization single cells from the AC and 217 from the auditory thalamus was isolated by a combination of an automated expectation maximization algorithm of sounds, we developed a frequency discrimination task (Fig. (Klustakwik; Kadir et al., 2013) and by manually clustering spike shapes 1 A, B) in which the boundary that separates low- from highusing in-house software. Our analysis focused on cells that showed frequency sounds varied several times within a behavioral session changes in activity in response to the middle (reversing) frequency, re(Fig. 1C). Rats initiated each trial by poking their noses into the sulting in a set of 191 cortical cells and 57 thalamic cells. Only cells for center port of a three-port chamber. A narrow-band sound which we had at least three blocks of 150 trials per block (two switches) (chord) was presented for 100 ms, indicating the location of rewere included. To evaluate responsiveness to each frequency, we quanward: left for a low-frequency sound and right for a hightified spike counts in nonoverlapping bins of 25 ms. We used these values frequency sound. Animals were tested in blocks of trials: in the to calculate z-scores for each bin with respect to the bin starting 100 ms low-boundary block, animals were required to discriminate bebefore sound onset. We considered a cell responsive if the z-score of any tween sounds centered at 6 and 14 kHz; in the high-boundary bin during the response period (0 –150 ms) fell outside the range (⫺3,3).
5294 • J. Neurosci., April 9, 2014 • 34(15):5291–5301
Jaramillo et al. • MGB and AC Modulation during Flexible Categorization
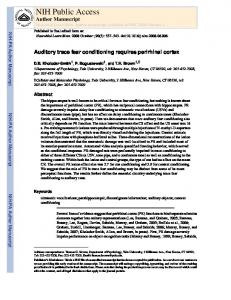
block, they were required to discriminate between 14 and 31 kHz. As a result, the sound at 14 kHz belonged to the highfrequency category in one block of trials and to the low-frequency category in the next block and the animal was required to change its behavioral response to this sound to successfully collect reward. We refer to this sound as the reversing stimulus. Within a session, animals switched back and forth between these two contingencies every 300 trials, without any additional cue in addition to the stimuli and rewards. All trained rats performed the task accurately and showed higher performance in response to nonreversing stimuli (6 and 31 kHz) compared with the reversing stimulus (14 kHz), even 100 trials after a change in contingency ( p ⬍ 0.01, Wilcoxon signed-rank test; Fig. 1 D, E). Average performance across conditions for animals selected for electrophysiological recordings (84 ⫾ 4%, mean ⫾ SD) was comparable to the performance of all other animals in the study (82 ⫾ 4%). Rats adapted rapidly after changes in category definitions (Fig. 2). For most animals, 12 trials were sufficient to cross the 50% performance level after a stimulus changed its meaning (Fig. 2D). Surprisingly, changes in accuracy occurred not only for stimuli that changed association between contingencies, but also for stimuli that never changed their associated reward port (Fig. 2C, yellow arrows). This effect was consistent across all animals ( p ⬍ 0.01, Wilcoxon signed-rank test; Fig. 2E). We hypothesized that these effects were present because animals’ choices depended on the distance between the perceived stimulus and their internal categorization boundary. As a result, boundary shifts after a switch affected Figure 2. Switching contingencies affected responses to all stimuli. A, Average performance across sound-action associations for an initialcohortof12rats(trainedinparallel)onsessionsthatstartedwiththehigh-boundaryblock.Blockswere300trialslong.Averageswere performance for all stimuli (Fig. 2F ). To quantify the animals’ internal cate- calculated for each trial across sessions and animals without time averaging. The increased variability on the last trials is due to averaging across less number of samples because not all animals performed 900 trials. B, Same as in A, but for sessions that started with the gory boundary, we tested performance in low-boundary block. C, Average performance across rats in A for each sound–action association. Each dot represents the percentage of response to sounds with frequencies difrightwardchoicesforonetrialinasessiontakenacrossseveralsessionsfromeachanimal.Thisplotshowsonlysessionsthatstartedwiththe ferent from the three exemplars used dur- low-boundary block. Yellow arrows indicate how performance also changed for stimuli that never changed their associated category. ing training. Rats generalized to other Increased variability on the last trials is due to fewer samples, as explained in A. D, Number of trials required to switch sound-action stimuli in a monotonic fashion (Fig. 3A) associations for each of the 17 animals trained in the full task. The value plotted corresponds to the trial in which each animal crossed the and a shift in the internal categorization 50%levelofrightwardchoicesforthereversingstimulus(14kHz)afterthefirstblockswitch.Mostratsswitchedbefore12trials.E,Change boundary was evident for all animals as in behavioral responses for a sound that never changed association. Each dot is the percentage of rightward choices for each of the 17 they switched from one contingency to animalsinresponsetothe31kHzsoundintrials1–20or101–120afteraswitch.Adecayinperformanceisevidentforallrats.F,Illustration another ( p ⬍ 0.01, Wilcoxon signed-rank of the shift in subjective category boundary that accounts for the decay in performance in E. At the end of the first block and the beginning test; Fig. 3B) without apparent changes in of the second block, the boundary is located between 6 and 14 kHz (green arrow). In this case, the distance between the boundary and 31 the slope of the psychometric function kHzislargeandsmallnoisewillnotchangethelocationofthestimuluswithrespecttotheboundary.Asthesubjectisexposedtomoretrials ( p ⫽ 0.17, Wilcoxon signed-rank test, from the second block, the boundary shifts between 14 and 31 kHz (red arrow). Under this condition, noise in the representation of either the stimulus or the boundary may cause a flip in the relation between stimulus and boundary, causing a mistake in choice. data not shown). These observations were consistent with the idea that choices depend on the distance between an boundary block, the subjective boundary shifted away from the internal categorization boundary and the perceived stimuli. Dur31 kHz sound, resulting in an improvement in performance for ing the high-boundary block, animals set their subjective boundthat stimulus. Switching back to the high-boundary block proary between 14 and 31 kHz. As animals switched to the lowduced the opposite shift in the boundary and a reduction in per-
Jaramillo et al. • MGB and AC Modulation during Flexible Categorization
A
J. Neurosci., April 9, 2014 • 34(15):5291–5301 • 5295
B
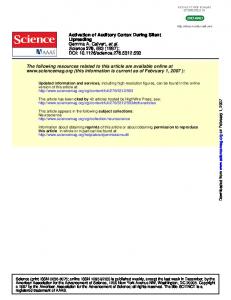
cution process reproduced the animals’ asymptotic performance, but did not capture the dynamics of behavioral performance after a contingency switch (Fig. 4C). These computational results provide an explanation for the paradoxical changes in performance for nonreversing stimuli. The model also demonstrates that the task can be solved without an explicit representation of the subjective category boundary in the firing rates of neurons. Last, the results of our simulations suggest that the animals’ mistakes are due mostly to imperfect representation of either the stimuli or the internal categorization Figure 3. Rats’ subjective categorization boundary shifted between blocks of trials. A, Average psychometric curves across animals. Red and green correspond to estimates from the low-boundary and high-boundary blocks, respectively, from the nine rats boundary, not to lack of understanding of the tested. In 10% of trials (open circles), animals were probed with frequencies different from those in the training set (solid circles). task rules or errors in choice execution. This model assumes distinct physioEach circle indicates the average of rightward choices for each frequency across animals, ignoring the first 100 trials after a switch. Error bars indicate SEs. Curves correspond to logistic fits given the choice for each trial. B, All rats shifted their internal categoriza- logical responses along the sensorimotor tion boundary between blocks of trials. Each dot represents the estimated boundary from the logistic fit for each animal. pathway. At early stages, neurons represent the sounds independently of their formance for the 31 kHz sound. To explicitly test the predictions meaning (Fig. 4D). At later stages, neurons can be sensitive to of this model when implemented in a neurally plausible fashion, both the identity and the meaning of sounds (Fig. 4E). To test we simulated an adaptive decision system and presented it with which of these possibilities best matches the activity of neurons in the same stimulus–action contingencies as were given to the the AC and MGB, we recorded neural responses from animals animals. performing the flexible categorization task. Adaptive system with imperfect sensory representations accounted for the dynamics of behavior A striking feature of the animals’ behavior was that a contingency switch elicited paradoxical changes in performance for stimuli that never changed category (Fig. 2E). Instead of improving with time, performance for these stimuli decayed as animals were exposed to more trials in a new categorization contingency. As illustrated in Figure 2F, this effect is present if choices depend on the distance between the frequency of the stimulus and a subjective category boundary. One possible mechanism for implementing this computation would be an explicit representation of the boundary by the firing rate of some neurons. We hypothesized that a different mechanism could account for the observed dynamics of performance; that is, the boundary is represented by synaptic strengths between sensory and decision neurons. To test this hypothesis, we implemented a firing rate model in which synaptic strengths changed after the outcome of each trial (Fig. 4A). A noiseless version of this model (data not shown) successfully learned to switch between categorization contingencies without requiring an explicit representation of the category boundary in the firing rate of neurons. However, the noiseless system quickly reached perfect discrimination performance on each block of trials, in contrast to the suboptimal performance achieved by the animals. We hypothesized that the performance level of our rats was due to imperfect representations of the following: (1) the sensory signals, (2) the categorization boundary, and (3) the neural signals representing the selected action, or a combination of these. When Gaussian noise was added to the sensory representation, the model reproduced not only the rapid switches observed in performance dynamics, but also the paradoxical changes in accuracy for the nonreversing stimuli (Fig. 4B). Noise added to the synaptic strengths, which implicitly represent the subjective categorization boundary, also accounted for these behavioral features (data not shown). In contrast, added variability to the exe-
Subpopulations of neurons in AC and MGB are sensitive to context We quantified the sound-evoked responses of single neurons from the AC (Fig. 5A) and the MGB (Fig. 5B) as animals switched between categorization contingencies. The dynamics of evoked responses were similar between the AC and the MGB, with both areas containing some neurons that responded by increasing their firing (Fig. 5C,D) and others that decreased their firing (Fig. 5 E, F ). Neurons in both areas showed various diverse patterns of onset, sustained, and offset responses when presented with the 100 ms sounds of different frequencies during the task (Fig. 5G,H ). From the 217 cells recorded from the thalamus, 22% had increases in firing in the first 50 ms after a sound (onset), 12% increases in firing in the next 50 ms (sustained), 13% increases in firing in the 50 ms after sound offset, and 12% had a suppression in firing during sound presentation. Combinations were often found. From the 665 cortical cells, 19% had onset increases, 15% sustained, 18% offset, and 17% had a suppression in firing during sound presentation, many of them in combination. For the remainder of the analysis, we focused on neurons that showed responses to the reversing middle-frequency stimulus (Table 2). We compared the responses evoked by the reversing middlefrequency stimulus (14 kHz) between categorization contingencies. We found that neural responses (in the range 10 –150 ms from sound onset) varied between contingencies in a subset of neurons from the AC (Fig. 6A) and from the auditory thalamus (Fig. 6B). Other neurons, in contrast, reliably represented the stimulus independent of the action associated with it (Fig. 6C,D). To exclude effects from nonstationarity, only cells that were modulated in opposite directions after consecutive switches in contingencies were counted as modulated. We reasoned that if evoked firing in the AC or MGB were correlated with the side of reward, then activity should be consistently higher for one of the two contingencies as animals switch back and forth between them. In the AC, 15% of the cells that responded to the reversing
5296 • J. Neurosci., April 9, 2014 • 34(15):5291–5301
Jaramillo et al. • MGB and AC Modulation during Flexible Categorization
stimulus (29/191) were significantly modulated ( p ⬍ 0.05, rank-sum test) between contingencies (Fig. 6E). A similar subset of responsive cells, 16% (9/57) was significantly modulated in the auditory thalamus (Fig. 6F ). An initial evaluation of changes in firing rate, which did not require the criterion of consistent modulation direction, yielded a slightly higher fraction of modulated cells: 22% in AC and 19% in MGB. We also evaluated the modulation of baseline activity (⫺150 to ⫺10 ms from sound onset) and found that only 4.2% of cells from AC and 5.3% from MGB were modulated in both baseline and evoked firing. This indicates that only one-third of the cells with modulation in evoked response could be explained by changes in the baseline firing. In addition, evaluating the modulation in the range 10 –100 ms, which excludes any early movements of the animal but also offset responses, resulted in 10% of cells modulated in cortex and 17% in the thalamus. The modulation of evoked responses consisted mostly of a change in the amplitude of the response and did not affect the type of response pattern (onset, offset, or sustained) of neurons. We found no evidence of a systematic location of the modulated neurons in particular regions of AC (modulated cells were found at various depths on the same electrode) or MGB (modulated cells were found on electrodes located in different subnuclei). On average, the magnitude of the modulation was not different between cortical and thalamic cells (p ⫽ 0.4, Levene’s test on the variance of the modulation index; Fig. 6G). These results indicate that soundevoked responses in a small subset of neurons in the sensory pathway are modulated by the stimulus–action association. Most neurons, however, behaved like those in the early stages of processing from our model (Fig. 4D) and were not influenced by the associated action. Surprisingly, the observed modulation of re4
Figure 4. An adaptive system with noisy representations accounted for the dynamics of behavioral performance. A, Learning model. Yellow labels indicate each stage. Inputs (stage 1) correspond to frequency channels with imperfect (noisy) representations of the acoustic stimulus. A decision neuron (stage 2) sums these inputs, weighted by the strength of each synapse. These strengths change according to the outcome of each trial. The binary output indicates either a left or right choice. Noise was added at one of three locations: the sensory signals, the synaptic strengths, or the choice signal. B, Average performance on each trial when noise
was added to the sensory signals. The noise parameter was chosen so that asymptotic performance for the extreme frequencies matched that of the rats. This model reproduced the decay in performance for the high frequency (in blue). C, Average performance when noise was added to the choice signals. This model did not account for the decay in performance after a contingency switch. D, Simulated evoked responses for a sensory neuron (stage 1, tuned to the middle frequency) are similar between the two contingencies (green: low-boundary; red: high-boundary). E, Simulated responses of the decision neuron (stage 2) depend on both the stimulus and its meaning.
Jaramillo et al. • MGB and AC Modulation during Flexible Categorization
J. Neurosci., April 9, 2014 • 34(15):5291–5301 • 5297
sponses was equally strong in auditory thalamus and AC.
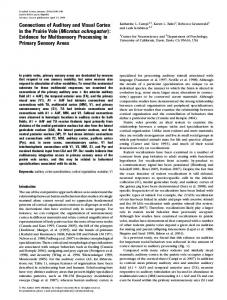
Figure 5. Physiological responses to sounds were similar between cortical and thalamic cells during the task. A, Reconstruction of electrode tracks from the AC. Left, Coronal slice showing an example track. The red arrow indicates where the electrode was inserted. The white arrow indicates the electrolytic lesion at the end the recordings. Right, Reconstruction of all electrodes (red) from all animals projected onto the closest of the coronal slices shown (projected onto the left hemisphere). The yellow area includes the primary and ventral fields of the AC (Doron et al., 2002). The number indicates the distance from bregma. B, Same as A, but for the thalamic recordings. The yellow area includes all subnuclei of the MGB (Paxinos and Watson, 2005). C, Sound-evoked response of one cortical cell that increased its firing after the presentation of one of the target sounds. D, Thalamic cell with a response similar to that in C. E, Example physiological response of one cortical cell that decreased its firing after the presentation of one of the target sounds. F, Thalamic cell with a response similar to that in E. G, Response of a cortical cell to the target sounds in each of the four stimulus–action conditions. H, Response of a thalamic cell in each condition. The same cell can show different response dynamics depending on sound frequency.
Modulation of responses did not improve the discriminability of sounds When solving tasks that require flexibility, the nervous system may use other strategies in addition to those presented in our model (Fig. 4) to improve performance. For example, top-down signals may influence the processing of sounds in sensory areas such that the discriminability of stimuli in each contingency is enhanced. Our simulations suggest that animals do not achieve perfect levels of performance due to imperfect neural representations of either the stimulus or the subjective category boundary. Given these psychophysical demands, we hypothesized that contextual modulation of neuronal responses in the sensory pathway may be playing a role in improving the discriminability of stimuli. To test this “adaptive system” hypothesis, we first evaluated the ability of an ideal observer to discriminate between sounds within each block of trials separately, given the evoked responses of each neuron. Performance was quantified as the fraction of trials in which the observer correctly estimated which of the two sounds was presented. We found that the performance of the observer was similar for neurons in the AC and the auditory thalamus (p ⫽ 0.21, rank-sum test; Fig. 7A). This hypothesis makes a specific prediction regarding the direction of modulation of activity for neurons tuned to either the high- or low-frequency sounds in our task: evoked responses to the reversing stimuli should vary so that the discriminability of 31 versus 14 kHz in one block of trials and 14 versus 6 kHz in the other block, increases (Fig. 7C, arrows). To determine whether our data were consistent with this prediction, we compared the performance of the ideal observer with that of an observer presented with the evoked responses after swapping the middle-frequency trials between blocks. The analysis was performed only on cells tuned to the high or low frequencies because the “adaptive system” hypothesis makes no predictions regarding the direction of modulation that would improve discrimination for neurons tuned to the reversing stimulus (14 kHz); swapping trials would simply improve performance in one contingency while decreasing performance in the other. If the modulation helped to improve performance, then the discrimination ability of the observer would decrease
Jaramillo et al. • MGB and AC Modulation during Flexible Categorization
5298 • J. Neurosci., April 9, 2014 • 34(15):5291–5301
when trials were swapped (Fig. 7 D, E). We found that this was not the case in either the AC ( p ⫽ 0.67 for low-block; p ⫽ 0.98 for high-block; n ⫽ 77) or the auditory thalamus ( p ⫽ 0.26 for low-block; p ⫽ 0.8 for high-block; n ⫽ 31) and that, whereas some neurons behaved as predicted, a similar number of neurons were modulated in the opposite direction. These results did not change when analyzing only the contingencies in which performance was highest for each neuron. Likewise, the effect for neurons with high discrimination performance (Fig. 7 D, E, top-right corner) was comparable to the effect on all other neurons. Results were also similar when analyzing only neurons with statistically significant modulation in the cortex ( p ⫽ 0.8 for low-block; p ⫽ 0.65 for high-block; n ⫽ 10) or the thalamus (n ⫽ 2). The observed modulation of sound-evoked responses was therefore not consistent with an increase in discriminability for each context.
Table 2. Number of recorded cells Responsive to 14 kHz Tuned to 14 kHz Tuned to 6 or 31 kHz Subtotal Not responsive to 14 kHz TOTAL
AC
MGB
114 (17%) 77 (12%) 191 (29%) 474 (71%) 665 (100%)
26 (12%) 31 (14%) 57 (26%) 160 (74%) 217 (100%)
Modulation of responses did not enhance the representation of choice An alternative cause for the modulation of firing rates could have been that neurons in AC and MGB were affected by signals related to the animals’ choices that were mediated, for example, by feedback from motor-related areas. To test this hypothesis, we evaluated the ability of an ideal observer to discriminate between right and left choices based on the evoked responses of each neuron. This ideal observer analysis tells us explicitly how neural activity is related to behavioral performance and therefore complements our quantification of statistically modulated cells (Fig. 6). This analysis includes all trials (correct or incorrect) grouped according to the animals’ decisions. In contrast to Fig. 7A, this analysis includes the responses to low- and high-frequency stimuli (6 and 31 kHz) in addition to the middle-frequency Figure 6. A subset of neurons in thalamus and cortex were sensitive to context. A, Responses evoked by the reversing (14 kHz) reversing stimulus (14 kHz). The perfor- sound for a cortical neuron that was sensitive to the meaning of the stimulus. Trials in the raster plot (top) are grouped by the block mance of the observer was similar for neu- in which they were presented (three consecutive blocks in this case). The poststimulus time histogram (bottom) shows a clear rons in the AC and the auditory thalamus difference between responses to the 14 kHz sound when it indicated right versus left reward. B, Same as A, but for a thalamic neuron sensitive to the meaning of the stimulus. In this example, the modulation is most apparent in the onset (0 –50 ms) of the ( p ⫽ 0.2, rank-sum test; Fig. 8A). Because the observer is exposed to tri- response. C, Evoked responses for a cortical neuron that was not modulated by context. D, Evoked responses for a thalamic neuron that was not modulated by context. E, The response of 15% of cortical cells was significantly modulated by context. The histogram als with extreme-frequency sounds assoshows the modulation index for each cell that was responsive to the reversing (14 kHz) sound. Those in black were significantly ciated to only one reward side, choice modulated ( p ⬍ 0.05, rank-sum test). “C” and “I” are firing rates on trials with reward contralateral or ipsilateral to the recording discrimination could be explained partly site, respectively. F, Similar to E, the response of 16% of thalamic cells was significantly modulated by context. G, Overlaid by these signals. Nevertheless, this quan- histograms for cortical (E) and thalamic (F) cells. There was no difference in the magnitude of modulation between cells from these tity allows us to evaluate whether modu- brain areas. lations in the evoked response were consistent with a representation of choice. creased when trials were swapped. We found that this was not the For neurons tuned to the middle frequency, this hypothesis precase in either the AC ( p ⫽ 0.12; n ⫽ 114) or the auditory thalamus dicts that evoked responses to sounds associated with left choices ( p ⫽ 0.23; n ⫽ 26). Results were similar when analyzing only should be separable from those associated with right choices (Fig. neurons with statistically significant modulation in the cortex 8C). Similar to the previous section, we compared performance ( p ⫽ 0.35; n ⫽ 19) or the thalamus ( p ⫽ 0.86; n ⫽ 7). Last, for of the observer with that calculated from evoked responses when neurons tuned to the high or low frequency, this hypothesis swapping the middle-frequency trials between blocks (Fig. 8 D, E). If the modulation were related to the animals’ choice, makes the same prediction as the “adaptive system” hypothesis, then the discrimination ability of the observer should have dewhich we showed was not consistent with the data.
Jaramillo et al. • MGB and AC Modulation during Flexible Categorization
J. Neurosci., April 9, 2014 • 34(15):5291–5301 • 5299
after changes in the category definitions (Fig. 2). Our observations suggested a mechanism for category assignment that depended on a subjective category boundary that varied between contingencies. We hypothesized that performance level depended on the distance between stimuli and the boundary and this model accounted for the paradoxical decrease in performance observed for extreme frequencies after a contingency switch (Fig. 2E). These behavioral changes did not imply a reduction in the overall performance with experience, but instead indicate a change in accuracy for a subset of stimuli, even when these stimuli did not change their associated category. This effect, which to our knowledge has not been discussed in detail previously, will be present in tasks that require difficult discriminations for which perceptual noise becomes relevant. We accounted for our data using a distance-to-boundary model, yet the unFigure 7. Discriminability of sounds from evoked responses was similar between AC and MGB. A, Sound-discrimination perfor- derlying neural mechanisms may not necmance of an ideal observer for neurons of the AC (black) or the MGB (gray) responsive to the reversing stimulus. Discrimination essarily have an explicit representation of performance was calculated separately on each of the two contingencies; only the highest of these two values was included in the this distance. Our study cannot dissociate histogram. The distributions of neuronal performance were indistinguishable between cortical and thalamic cells. B, Frequency between different possible mechanisms tuning of a hypothetical neuron with preference for low frequencies. Each dot represents the evoked response for one stimulus in our task (colors as in Fig. 1C). C, Modulation of evoked responses predicted by the “adaptive system” hypothesis for the neuron in for the categorization process; for examB. Changes in the response to 14 kHz in the direction indicated by the arrows improve the discriminability of sounds on each ple, similarity to prototypes versus comcontingency (31 vs 14 kHz and 14 vs 6 kHz). D, Effect of swapping trials with 14 kHz stimulus for cortical neurons tuned to high or parison with a boundary versus full low frequencies. Each dot corresponds to the observer’s performance given the responses of one neuron on each contingency representation of the probability distribu(green: low-boundary; red: high-boundary). If modulation of responses enhanced discriminability, then the performance of the tions of each category (Smits et al., 2006), ideal observer should have decreased after swapping trials, yet there was no apparent decrease. E, Same as D, but for thalamic because any of these theories would be neurons. There was no decrease in performance after swapping trials. consistent with our data. However, our model provides a biologically plausible example of how to achieve flexible categoThese results indicate that sound-evoked responses in the AC rization without the need for representing the category boundary and the auditory thalamus were not systematically modulated by the choices of the animals. in the firing rate of neurons. Moreover, our computational model (Fig. 4) illustrates that noise at the perceptual level, and not at the Discussion level of choice execution alone, is required to account for the We trained rats in a flexible categorization task in which the dynamics of behavior observed in our task. For example, noise in boundary that separates two categories (high- and low-frequency the synaptic connections between cells in the AC and the striatum sounds) varied multiple times within a session. Shifts in the catduring behaviors that depend on this neural pathway (Znamenegory boundary changed stimulus–action associations without skiy and Zador, 2013) should result in similar performance dychanging the associated reward. In this study, we characterized namics to that observed in our task. changes in behavioral performance and in the physiological reWhat neural mechanisms allow animals to quickly switch besponses of auditory neurons as animals switched between tween categorization contingencies? We hypothesize two possipreviously learned contingencies. A computational model in bilities: (1) changes in associations between sounds and actions which the categorization boundary was represented by synaptic are mediated by reward-dependent changes in the synaptic strength of sensorimotor neurons accounted for the main feastrength of sensorimotor neurons or (2) top-down influences tures of behavioral performance. Sound-evoked responses from from outside the sensorimotor pathway help reroute sensory the majority of cells in auditory thalamus and AC were consistent signals without long-lasting changes in synaptic efficacy. with signals in the early stages of the model in which sounds are These ideas correspond to mechanisms hypothesized for represented independently of their meaning. Notably, we found learning (Martin et al., 2000; Reynolds et al., 2001) or selective no differences in the fraction of modulated cells (⬃15%) or the attention (Moore and Armstrong, 2003; Jaramillo and Pearlmagnitude of this modulation between thalamus and cortex. mutter, 2007), respectively. The computational model shown in Fig. 4 is an implementation of the first idea, but it cannot Mechanisms for flexible categorization of simple sounds rule out the second possibility. Further studies are needed to We developed a category-learning task in which each of two evaluate whether the rapid flexibility required in our task is sound-frequency categories was associated with one reward port. mediated by long-lasting synaptic changes in the sensorimotor We demonstrated that rats could generalize from a few examples into appropriate categories (Fig. 3) and were able to rapidly adapt pathway or by top-down influences.
5300 • J. Neurosci., April 9, 2014 • 34(15):5291–5301
Jaramillo et al. • MGB and AC Modulation during Flexible Categorization
Influence of context on the physiological responses of auditory neurons Sound-evoked responses of neurons in the central auditory pathway are influenced by the behavioral context in which sounds are presented (Hubel et al., 1959; Miller et al., 1972; Hocherman et al., 1976. Most studies demonstrating this effect have compared responses under different levels of expectation Jaramillo and Zador, 2011; Ryan et al., 1984), engaged versus passive conditions (Ryan et al., 1984; Otazu et al., 2009; Niwa et al., 2012a), or changes in the reward (Hocherman et al., 1976; David et al., 2012) or punishment (Weinberger, 1993; Fritz et al., 2003) associated with a stimulus. These studies suggest that the magnitude of plasticity is directly related to the magnitude of reinforcement. Our study focused instead on a task in which the amount of reward associated with a sound does not change, but the associated action necessary to collect this reward does change. Our emphasis Figure 8. Discriminability of choices from sound-evoked responses. A, Choice-discrimination performance of an ideal observer was on the physiological responses of au- given neurons from the AC (black) or the MGB (gray) responsive to the reversing stimulus. The distributions of neuronal perforditory neurons as animals switched be- mance were indistinguishable between cortical and thalamic cells. B, Frequency tuning of a hypothetical neuron with preference tween previously learned contingencies, for the middle (14 kHz) frequency. C, Modulation of evoked responses predicted by the “representation of choice” hypothesis for the neuron in B. Changes in the response to 14 kHz in the direction indicated by the arrows improve the discriminability of the rather than changes produced by learning animal’s choice. D, Effect of swapping trials with 14 kHz stimulus for cortical neurons tuned to the middle frequency. Each dot an association for the first time. corresponds to the observer’s performance given one neuron. If modulation of responses enhanced discriminability, then the In a study comparable to ours, Vaadia performance of the ideal observer should have decreased after swapping trials, yet there was no apparent decrease. E, Same as D, et al. (1982) evaluated responses of audi- but for thalamic neurons. There was no decrease in performance after swapping trials. tory cortical cells during a task that required an overtrained monkey to shift a The studies presented in the paragraphs above indicate that lever left or right depending on the identity of a sound (tone vs learning about a stimulus for the first time, or changing the level noise). After reversing the associated shift direction, 17% (23/ of engagement in a task, influences the responses of a large frac134) of cells showed different responses to a given stimulus, tion of cells in the auditory thalamus and cortex. In contrast, which is consistent with our observations. changes in behavioral responses without changes in reward or Other studies have compared neuronal activity in the AC bepunishment result in small variations of the sound-evoked activtween correct and incorrect choices (Lemus et al., 2009; Niwa et ity in only a minority of cells from these brain areas. Our meaal., 2012b) using choice probability analysis (Britten et al., 1996). surements cannot rule out the possibility that plasticity One of these studies (Niwa et al., 2012b) found a small trial-todeveloped in the AC or the MGB as animals were learning to trial correlation between neural activity and an animal’s behavperform the task, given such plasticity in other tasks (Weinberger, ioral choice (choice probability of 0.512 for single units) and a 1993; David et al., 2012). significant modulation of firing rate in 13.8% (32/232) of cells. Our study focused on the activity of neurons during stimulus Lemus et al. (2009), in contrast, found no significant differences presentation; however, some of these neurons also showed in activity between trials that resulted in hits versus errors. changes in activity to various events within a trial. For example, a Neurons from the auditory thalamus also change their resubset of cells fired differently depending on the chosen reward sponses depending on context, and learning-induced changes port as animals moved to collect reward (observable in Fig. 6C). have been observed in various subdivisions of the medial genicStudies by others have shown that the firing of auditory neurons ulate body (Edeline and Weinberger, 1991; Weinberger, 2011). in the thalamus and cortex is influenced not only by sounds, but Moreover, studies comparing activity from thalamic cells during also by rewards and animals’ choices (Brosch et al., 2005; Komura engaged versus passive conditions have found changes in sponet al., 2005; Niwa et al., 2012b). We found indications of similar taneous (Otazu et al., 2009) and evoked (Ryan et al., 1984) firing. modulations in both the thalamus and the cortex and a detailed Komura et al. (2005) found that 14.6% In a multisensory task, account of these changes will be reported in the future. (56/384) of the sound-responsive thalamic neurons changed Are the effects observed in cortex simply a reflection of effects their firing to the same sound depending on a simultaneous vialready present in inputs from the thalamus? Fear-conditioning sual cue. When comparing responses between correct and error work by Weinberger (1993) indicated that frequency tuning trials, they found differences close to the response period, but shifts in the primary AC can be maintained for months, yet shifts not early during the stimulus presentation. To our knowledge, in the ventral nucleus of the MGB are transient. Changes in the there has been no comparison of thalamic evoked responses medial nucleus of the MGB seem to be maintained for longer, but after changes in stimulus–action associations without changes in reward. frequency tuning in this nucleus is broader than in A1. It is there-
Jaramillo et al. • MGB and AC Modulation during Flexible Categorization
fore unclear whether thalamic changes can fully explain changes in the cortex. Our results indicate that evoked responses to simple sounds are similar in thalamus and cortex. This seems to be the case even for natural sounds, and larger changes in information about stimulus identity have been found between the inferior colliculus and thalamus (Weinberger, 1993) than between thalamus and cortex (Chechik et al., 2006). We also found that the same percentage of cells is modulated in auditory thalamus and AC and that the magnitude of modulation is comparable between the two regions. This leaves open the possibility that flexibility in our task can be mediated by pathways that do not rely on the AC, as has been observed in fear conditioning to simple sounds (Romanski and LeDoux, 1992).
References Albanese D, Visintainer R, Merler S, Riccadonna S, Jurman G, Furlanello C (2012) mlpy: Machine Learning Python. Retrieved Feb. 5, 2014, from http://arxiv.org/abs/1202.6548. Bishop CM (1995) Neural networks for pattern recognition. Oxford: OUP. Britten KH, Newsome WT, Shadlen MN, Celebrini S, Movshon JA (1996) A relationship between behavioral choice and the visual responses of neurons in macaque MT. Vis Neurosci 13:87–100. CrossRef Medline Brosch M, Selezneva E, Scheich H (2005) Nonauditory events of a behavioral procedure activate auditory cortex of highly trained monkeys. J Neurosci 25:6797– 6806. CrossRef Medline Chechik G, Anderson MJ, Bar-Yosef O, Young ED, Tishby N, Nelken I (2006) Reduction of information redundancy in the ascending auditory pathway. Neuron 51:359 –368. CrossRef Medline David SV, Fritz JB, Shamma SA (2012) Task reward structure shapes rapid receptive field plasticity in auditory cortex. Proc Natl Acad Sci U S A 109:2144 –2149. CrossRef Medline Doron NN, Ledoux JE, Semple MN (2002) Redefining the tonotopic core of rat auditory cortex: physiological evidence for a posterior field. J Comp Neurol 453:345–360. CrossRef Medline Edeline JM, Weinberger NM (1991) Thalamic short-term plasticity in the auditory system: associative returning of receptive fields in the ventral medial geniculate body. Behav Neurosci 105:618 – 639. CrossRef Medline Floresco SB, Zhang Y, Enomoto T (2009) Neural circuits subserving behavioral flexibility and their relevance to schizophrenia. Behav Brain Res 204:396 – 409. CrossRef Medline Fritz J, Shamma S, Elhilali M, Klein D (2003) Rapid task-related plasticity of spectrotemporal receptive fields in primary auditory cortex. Nat Neurosci 6:1216 –1223. CrossRef Medline Goldberg TE, Weinberger DR (1988) Probing prefrontal function in schizophrenia with neuropsychological paradigms. Schizophr Bull 14:179 –183. CrossRef Medline Hill EL (2004) Executive dysfunction in autism. Trends Cogn Sci 8:26 –32. CrossRef Medline Hocherman S, Benson DA, Goldstein MH Jr, Heffner HE, Hienz RD (1976) Evoked unit activity in auditory cortex of monkeys performing a selective attention task. Brain Res 117:51– 68. CrossRef Medline Holt LL, Lotto AJ (2010) Speech perception as categorization. Atten Percept Psychophys 72:1218 –1227. CrossRef Medline Hubel DH, Henson C, Rupert A, Galambos R (1959) “Attention” units in the auditory cortex. Science 129:1279 –1280. CrossRef Medline Jaramillo S, Pearlmutter BA (2007) Optimal coding predicts attentional
J. Neurosci., April 9, 2014 • 34(15):5291–5301 • 5301 modulation of activity in neural systems. Neural Comput 19:1295–1312. CrossRef Medline Jaramillo S, Zador AM (2011) The auditory cortex mediates the perceptual effects of acoustic temporal expectation. Nat Neurosci 14:246 –251. CrossRef Medline Kadir SN, Goodman DF, Harris KD (2013) High-dimensional cluster analysis with the Masked EM Algorithm. Retrieved Feb. 5, 2013 from http://arxiv.org/abs/1309.2848. Komura Y, Tamura R, Uwano T, Nishijo H, Ono T (2005) Auditory thalamus integrates visual inputs into behavioral gains. Nat Neurosci 8:1203– 1209. CrossRef Medline Lemus L, Herna´ndez A, Romo R (2009) Neural codes for perceptual discrimination of acoustic flutter in the primate auditory cortex. Proc Natl Acad Sci U S A 106:9471–9476. CrossRef Medline Martin SJ, Grimwood PD, Morris RG (2000) Synaptic plasticity and memory: an evaluation of the hypothesis. Annu Rev Neurosci 23:649 –711. CrossRef Medline Miller JM, Sutton D, Pfingst B, Ryan A, Beaton R, Gourevitch G (1972) Single cell activity in the auditory cortex of rhesus monkeys: behavioral dependency. Science 177:449 – 451. CrossRef Medline Moore T, Armstrong KM (2003) Selective gating of visual signals by microstimulation of frontal cortex. Nature 421:370 –373. CrossRef Medline Niwa M, Johnson JS, O’Connor KN, Sutter ML (2012a) Active engagement improves primary auditory cortical neurons’ ability to discriminate temporal modulation. J Neurosci 32:9323–9334. CrossRef Medline Niwa M, Johnson JS, O’Connor KN, Sutter ML (2012b) Activity related to perceptual judgment and action in primary auditory cortex. J Neurosci 32:3193–3210. CrossRef Medline Ohl FW, Scheich H (2005) Learning-induced plasticity in animal and human auditory cortex. Curr Opin Neurobiol 15:470 – 477. CrossRef Medline Otazu GH, Tai LH, Yang Y, Zador AM (2009) Engaging in an auditory task suppresses responses in auditory cortex. Nat Neurosci 12:646 – 654. CrossRef Medline Paxinos G, Watson C (2005) The rat brain in stereotaxic coordinates, Ed 5. San Diego: Academic. Reynolds JN, Hyland BI, Wickens JR (2001) A cellular mechanism of reward-related learning. Nature 413:67–70. CrossRef Medline Romanski LM, LeDoux JE (1992) Equipotentiality of thalamo-amygdala and thalamo-cortico-amygdala circuits in auditory fear conditioning. J Neurosci 12:4501– 4509. Medline Russ BE, Lee YS, Cohen YE (2007) Neural and behavioral correlates of auditory categorization. Hear Res 229:204 –212. CrossRef Medline Ryan AF, Miller JM, Pfingst BE, Martin GK (1984) Effects of reaction time performance on single-unit activity in the central auditory pathway of the rhesus macaque. J Neurosci 4:298 –308. Medline Smits R, Sereno J, Jongman A (2006) Categorization of sounds. J Exp Psychol Hum Percept Perform 32:733–754. CrossRef Medline Vaadia E, Gottlieb Y, Abeles M (1982) Single-unit activity related to sensorimotor association in auditory cortex of a monkey. J Neurophysiol 48: 1201–1213. Medline Weinberger NM (1993) Learning-induced changes of auditory receptive fields. Curr Opin Neurobiol 3:570 –577. CrossRef Medline Weinberger NM (2011) Reconceptualizing the primary auditory cortex: Learning, memory and specific plasticity. In: The auditory cortex (Winer JA, Schreiner CE, eds), pp 465– 491. Boston: Springer. Znamenskiy P, Zador AM (2013) Corticostriatal neurons in auditory cortex drive decisions during auditory discrimination. Nature 497:482– 485. CrossRef Medline