OPTO−ELECTRONICS REVIEW 24(2), 82–94 DOI: 10.1515/oere−2016−0011
Detection of disease markers in human breath with laser absorption spectroscopy T. STACEWICZ*1, Z. BIELECKI2, J. WOJTAS2, P. MAGRYTA1, J. MIKOLAJCZYK2, and D. SZABRA2 1Institute
of Experimental Physics, Physics Faculty, University of Warsaw, ul. Pasteura 5, 02–093 Warsaw, Poland 2Military University of Technology, ul. Gen. Kaliskiego 2, 00–908 Warsaw, Poland
Au
Number of trace compounds (called biomarkers), which occur in human breath, provide an information about individual feature of the body, as well as on the state of its health. In this paper we present the results of experiments about detection of certain biomarkers using laser absorption spectroscopy methods of high sensitivity. For NO, OCS, C2H6, NH3, CH4, CO and CO(CH3)2 an analysis of the absorption spectra was performed. The influence of interferents contained in exhaled air was considered. Opti− mal wavelengths of the detection were found and the solutions of the sensors, as well as the obtained results were presented. For majority of the compounds mentioned above the detection limits applicable for medicine were achieved. The experiments showed that the selected optoelectronic techniques can be applied for screening devices providing early diseases detection.
1. Introduction
there is still a need to look for a cheap, sensitive and an accu− rate technique which leads to the use of small, affordable, easy−to−use equipment for medical screening. The techniques mentioned above are not applicable for these purposes. For instance, the treatment of a single sample with gas chromatog− raphy is time consuming (about 30–60 min.) and requires expensive equipment maintained by specialized staff. Appli− cation of optical methods, e.g., laser absorption spectroscopy (LAS) provides opportunity for fast and sensitive detection of certain compounds in a breath. Progress in optoelectronic technologies opens new capabilities of a trace matter detection in gases. It also leads to development of the efficient methods of breath investigation. Moreover, continuous development in optoelectronics causes miniaturization of optical apparatus which leads to the construction of desktop systems. In this paper we present results of our investigations on optical detection of biomarkers in breath. The main goal was to achieve substantial progress in early diagnosis of diseases due to application of a low cost and simple in maintenance equipment for the fast medical investigation. Their final goal will be the design of instrument for test screening in internal medicine doctors’ cabinets, clinics and in consulting−rooms. Such instruments can be implemented to the clinical practice as the early−warning, simple and low cost table top systems for disease detection in a real time. Simultaneously the instru− ments should be characterized by the sensitivity required for medical application. Therefore, the expensive solutions,
s or
th
Keywords: absorption spectroscopy, laser spectroscopy, detection of disease markers.
e−mail:
[email protected]
82
py
*
co
In air exhaled from human lungs, beside the main gases (N2, O2, CO2, H2O), about 2000 various compounds were already detected [1,2]. Breath composition depends on individual pa− tient feature, as well as on the state of his health. An excess of several compounds (called biomarkers) is related to certain diseases. Fast progress in development of breath analysis methods is observed recently. This activity is motivated by the great potential of disease diagnosis or therapy monitoring. In many cases the determination of biomarkers concentration provides opportunity of disease diagnosis at early state, which makes these methods useful for screening. Moreover, such medical investigation is simple, painless, distressful and non−invasive [3,4]. There is a variety of gas sensing techniques that are useful for this application. Gas chromatography combined with mass spectrometry and ion mobility spectrometry belong to the most versatile methods of breath composition investigation [5–9]. Other techniques like chemiluminescence [1], fiber op− toelectronic sensing [10], proton transfer reaction mass spec− trometry [11], selected ion flow tube mass spectrometry [12–18], and electrochemical sensing or the electronic noses [19,20] are also widely used for this purpose. Nevertheless,
Opto−Electron. Rev., 24, no. 2, 2016 Brought to you by | Military Technical Academy Authenticated |
[email protected] Download Date | 7/7/16 9:48 AM
2016 SEP, Warsaw
which are commonly used in scientific laboratories, consisting in complicated both light sources and detection systems, should be replaced by the devices that are offered (or will be offered in the nearest future) by contemporary optoelectro− nics.
2. Experimental setups
s or
th
Au
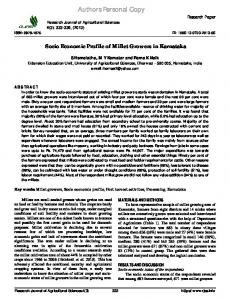
The detection of gas compounds using LAS methods consists in a measurement of light attenuation in a cell containing the investigated sample [21]. Selective detection of certain bio− markers in human breath requires optical radiation which is matched to a specific spectral line (so called fingerprint) of the compound of interest. Biomarkers belong to the group of compounds which occur in breath within the concentration range from ppt to ppm. As a result of the large number of the compounds, their absorption spectra might overlap biomarker fingerprints and disturb the measurement. The spectra of main constituents of air N2 and O2 usually do not interfere with the spectra of the molecules of interest, but carbon dioxide and water vapour are the main interfering species. CO2 and H2O are characterized by broad absorption bands and occur in breath at high concen− tration (up to 5% each at human body temperature). Other compounds, like CO, methane, ammonia and formaldehyde, which might reach relatively high concentrations should also be taken into account1. Therefore, the art of selection of wave− lengths and circumstances for optical detection for certain biomarkers consists of minimization of such interferences’ influence. Infrared is the most useful spectral range for optical detec− tion of small molecules (that are the main target of this investi− gation)2. For such compounds, the absorption spectrum con− sists of bands, containing sets of narrow lines corresponding to quantum transitions between ro−vibronic levels of funda− mental electronic state [22]. Using the spectroscopy the sensi− tive detection requires laser radiation that is precisely tuned to the peak of a selected line of the compound of interest. Those enable monitoring of specific markers existing in human breath at low mixing ratio and distinguish them among other interfering species. In many cases the fingerprint line of certain molecule might not exhibit sufficiently its absorption among the inter− fering species. Such example is shown in Fig. 1(a) for nitric oxide. Fingerprint lines of this compound are located within the range of 5.260–5.266 μm. Maximum of the absorption corresponds to the wavelength value of 5.263 μm, however at
Opto−Electron. Rev., 24, no. 2, 2016
py
level of CO and CH4 corresponds to 10 ppm; for NH3 and H2CO it can reach 2 ppm and 0.6 ppm, respectively. 2 Dense ro−vibronic lines of heavy molecules can overlap and constitute broad bands in IR range which makes problematic their selective detection.
co
1Morbid
Fig. 1. Absorption spectra of NO and main interferents at the pressure of 1 atm (a) and 0.1 atm (b).
normal pressure it is dominated by absorption bands of water vapour (almost over 45 times) and carbon dioxide (more than three times). The reduction of H2O concentrations by the fac− tor of 30 using a humidifier [23] does not improve the de− tection capabilities. Molecular collisions are mainly responsible for the spec− tral line shapes in the air samples [24]. As shown in Fig. 1(a), the collisionally broadened lines of CO2 and H2O perform a broad background which overrides the weak absorption spectrum of nitric oxide. Therefore, diminishing the air pres− sure in the sample is an approach that can efficiently reduce disturbance by the interferents. In Fig. 1(b) the relevant spec− tra of NO with H2O and CO2 at a pressure of 0.1 atm. were shown. Pressure broadening was reduced about 10 times. The backgrounds of H2O and CO2 were lowered about two orders of magnitude. In such circumstances, NO concentration of
T. Stacewicz Brought to you by | Military Technical Academy Authenticated |
[email protected] Download Date | 7/7/16 9:48 AM
83
Detection of disease markers in human breath with laser absorption spectroscopy
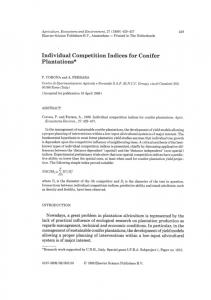
Fig. 2. Simplified schemes of optoelectronic biomarker sensors based on: (a) CRDS, (b) MUPASS.
a=
1æ 1 1ö - ÷, ç c èt A t 0 ø
(1)
where c denotes the light speed. Concentration of the absorber is found due to the relation: N A = a s A , where s A is the ab− sorption cross section. Several modifications of CRDS were developed. The best result might be achieved with continuous wave single mode lasers while they can be precisely matched with the peaks of narrowband absorption lines. This technique, so called, CW− −CRDS uses cw laser with beam externally AM modulated with frequency of tens of kilohertz [31,32]. Signal to noise ratio of the system might be increased many times when the cavity mode is precisely matched to laser frequency [33, 34]. However such technique leads to system complexity. In this case the Q−factor is often determined due to analysis of a pha− se shift which occurs between input and output signals of the cavity. The phase shift Dj is caused by the radiation storage in the cavity. Its relation to the photon lifetime in the resonator is expressed by the formula: tg( Dj) = 2pft , where f denotes the modulation frequency. Then, the absorber concentration can be determined using Eq. (1). Other solutions, like off−axis arrangement of the resonator, Integrated Cavity Output Spectroscopy (ICOS) or Cavity En− hanced Absorption Spectroscopy (CEAS) enable solving the problems related to cavity and laser frequency matching [35, 36]. In multipass spectroscopy [MUPASS – Fig. 2(b)] the high sensitivity is achieved due to light path lengthening in the experimental cell containing the investigated gas sample. The cell is ended with two concave mirrors with broadband coat− ings. Laser beam is introduced through a small hole in one mirror and then multiplies reflects among the mirrors. Due to that solution the light path might be lengthened tens or ever hundreds times inside the sample in comparison with common single−pass spectroscopy. Then, the beam leaves the cell through the same or the other hole in the mirror and reaches
s or
th
Au
5 ppb at the wavelength of 5.262961 μm might be detected. Subsequent reduction of H2O concentration using Nafion hu− midifier3 provides the opportunity to measure NO concentra− tion with precision of 0.2 ppb, i.e., to monitor this compound in breath of healthy man. As far as the breath compounds are usually characterized by a low absorption coefficient, the most sensitive techniques of absorption measurement are applied for the detection. Multipass spectroscopy (MUPASS), cavity ring down spec− troscopy (CRDS) and wavelength modulation spectroscopy (WMS) are the most useful for these applications. Schemes of such experimental systems are presented in Fig. 2. Their oper− ation idea was described in details in the publications [25,26]. Moreover, photoacoustics spectroscopy (PAS) and its modifi− cation – quartz enhanced photoacoustic spectroscopy (QEPAS) – are applied. Briefly, CRDS [Fig. 2(a)] exploits the experimental cell in the form of optical resonator (cavity) built with mirrors of very high reflectivity [28–30]. The measurement of absorp− tion coefficient of the sample contained inside consists in determination of the resonator quality (Q−factor) using laser radiation tuned to spectral line of the compound of interest. The Q−factor is found due to the analysis of a photoreceiver signal by the acquisition system. Then, the quality is com− pared with the case when the resonator is filled with a refer− ence gas (without the absorber). The absorption coefficient below 10–9 cm–1 can be observed. The measurement of the Q−factor is usually carried out within two−step process. First, the decay time t 0 of lasers’ radiation in the cavity without the absorber is found. Then, the cavity is filled with investigated air sample and the respective decay time t A is determined. The absorption coefficient is cal− culated using the formula
84
py
Drying of air sample might be performed with thin Nafion membranes (Perma Pure LLC), however their influence on certain biomarker contains is a matter of investigation.
co
3
Opto−Electron. Rev., 24, no. 2, 2016 Brought to you by | Military Technical Academy Authenticated |
[email protected] Download Date | 7/7/16 9:48 AM
2016 SEP, Warsaw
the photodetector. The absorption coefficient is found from Lambert – Beer absorption law. Simultaneously the technique, called wavelength modula− tion spectroscopy (WMS), is usually applied. The laser wave− length is periodically varied within the absorption line profile. Such wavelength modulation induces the amplitude modula− tion of the light beam passing through the cell with the ab− sorber. The relevant periodical changes occur in the pho− todetector output signal which is then demodulated with a lock−in amplifier. The signal amplitude is proportional to the absorption coefficient. Wavelength modulation spectroscopy improves the selectivity and enlarges the immunity of detec− tion process to noises and interferences. Using both MUPASS and WMS the absorption sensitivities of 10–7 cm–1 (and even better) are available.
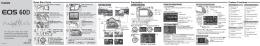
The detection limit of 5 ppb can be assumed. Therefore, the sensor might be used for monitoring of NO in the air after a calibration and for the statement of dangerous cases in breath. Further improvement of the sensor performances is pre− dicted. Higher power QCL with very narrow emission line will be applied as the light source. Matching of its wavelength to the absorption peak at 5.262961 μm [Fig. 1(b)] and reduc− ing the air pressure (to about 0.1 atm) would significantly improve the detection limit.
3.2. Carbonyl Sulfide (OCS)
Nitric oxide is a biomarker of diseases like asthma, hyperten− sion, rhinitis and various air way inflammations [37–43]. Its concentration in healthy people breath does not exceed the level of 50 ppb for adults and 35 ppb for children, according to American Thoracic Society (ATS) and European Respiratory Society (ERS) recommendation [44,45]. As it is shown in Fig. 1, NO has a strong absorption band around wavelengths of 5.26 μm. Using this spectral range nitric oxide has been already detected with sensitivity up to the ppb levels. The techniques as MUPASS – WMS [46–48], ICOS [49,50], and CALOS [51] were demonstrated. Our experiment with nitric oxide detection in the N2 was performed using CEAS technique. The optical cavity was built of two concave dielectric mirrors with CEAS procedure.
Carbonyl sulfide occurs in breath of healthy individuals with concentration values from 3 ppt to 30 ppb. For an unhealthy man, however, these values might reach the level about tens or even hundreds times higher [52]. This compound is known as a biomarker for cystic fibrosis, liver failure and acute rejection of transplanted lungs [53,54]. OCS molecule has absorption peaks within the spectral range of 3.3–5.5 μm. The detection limits of 0.5 ppb in breath [55] and 7 ppt in ambient air [56] wwere already published. In Fig. 4 the spectrum of OCS together with spectra of the main interferents contained in human breath are presented near the wavelength of 4.875 μm. At the concentration of 30 ppb the absorption coefficient of carbonyl sulfide domi− nates here over the interferents’ spectra. As one can see, using the laser tuned to the peak of OCS line, the precision of the measurement better than 15 ppb can be obtained. Further anal− ysis of HITRAN database [22] shows, that10−times reduction of sample pressure would provide the detection limit of 0.5 ppb due to the narrowing of spectral lines. In this case the wavelength shift of the absorption line also takes place and the precise laser tuning to the wavelength to 4.877716 μm should be applied.
Fig. 3. Calibration of NO sensor.
Fig. 4. Absorption spectrum of OCS near 4.875 μm together with spec− tra of main interferents in breath.
3. Measurements of selected biomarkers concentrations
s or
th
Au
3.1. Nitric oxide (NO)
py
co
Opto−Electron. Rev., 24, no. 2, 2016
T. Stacewicz Brought to you by | Military Technical Academy Authenticated |
[email protected] Download Date | 7/7/16 9:48 AM
85
Detection of disease markers in human breath with laser absorption spectroscopy
Fig. 5. Results of measurement of OCS concentration in reference gas.
s or
th
Au
Our approach to OCS detection in the N2 was performed using the similar experimental setup as the described in previ− ous chapter. Optical cavity equipped with mirrors of ~0.9998 reflectivity (CRD Optics Inc., Mountain View, CA, USA) and the pulsed parametric oscillator PG711−DFG−SH from the Ekspla Company (Vilnius, Lithuania) was used. The experi− ment was performed in pure air. The results are presented in Fig. 5. Nice linearity between the assumed concentration and the absorption coefficient was received. The detection limit might be evaluated as better than 1 ppb, however the measure− ment range was limited by the precision of the gas generator. The spectrum analysis and the experiment have shown that even using a relatively simple system the sensitivity sufficient for the statement of dangerous concentration (> 30 ppb) in human breath can be achieved. More advanced setup with reduced pressure and with single mode QC lasers tuned to the peak of the absorption line would provide the opportunity to monitor OCS in breath with the detection limit better than 1ppb.
86
Both preclude observation of C2H6 at atmospheric pres− sure [Fig. 6(a)]. The peak of ethane absorption coefficient (l = 3.34816 μm) is dominated by these interferents. More− over, the measurement may be also disturbed by formalde− hyde which might occur in breath of healthy men with the concentration even of 0.6 ppm. Successful measurement of ethane concentration in human breath requires reduction of sample pressure [0.1 atm, Fig. 6(b)]. In this case a significant separation of absorption lines takes place due to reduction of their collisional broaden− ing. Absorption coefficient of C2H6 dominates even in the in− terferents presence. Preliminary drying of the sample with Nafion membranes, which reduce water vapor amount about 30 times, further minimizes H2O interference. Due to that the observation of the ethane concentration of 3.5 ppb is possible using the laser tuned to 3.348151 μm. The detection limit of hundreds of ppt is available, even in the case of relatively high formaldehyde concentration.
py
Ethane is an inflammatory marker in the exhaled air. It might be also used as an indicator of vitamin E deficiency, as well as for identification of chronic respiratory diseases [57], cells oxidative stress [58] or an indication of scleroderma and cys− tic fibrosis [59–62]. Its concentration in a normal human bre− ath is about 0.12 ppb, while in unhealthy case it reaches the range of 3.5 ppb [63]. The detection limit of 100 ppt was reported at the spectral range of 2.6–4.0 μm [63–65]. Absorption spectrum of ethane is presented in Fig. 6, to− gether with spectra of the main interferents in breath. The pre− sented ethane line corresponds to maximal absorption in the wavelength range of 3–4 μm. Water vapour and CO2 are the most interfering compounds.
co
3.3. Ethane (C2H6)
Fig. 6. Absorption spectra of ethane and main interferents for the pres− sure of 1 atm (a) and 0.1 atm (b).
Opto−Electron. Rev., 24, no. 2, 2016 Brought to you by | Military Technical Academy Authenticated |
[email protected] Download Date | 7/7/16 9:48 AM
2016 SEP, Warsaw
Fig. 7. Results of measurement of ethane concentration in reference gas.
3.4. Ammonia (NH3)
py
co
Normal concentration of ammonia in human breath is in the range of 0.25–2.9 ppm [66]. However, the excessive concen− tration might suggest renal failure, Helicobacter Pyroli and oral cavity disease [67–68]. The highest sensitivities of am− monia detection using LAS setup can be achieved in 10–11 μm range, because of the largest values of the absorp− tion cross section. The detection limits reaching the values of tens and single ppb’s were already achieved by several groups [69,70], with MUPASS – WMS. In this spectral range the ammonia spectra are interfered by CO2 and H2O and sample drying and pressure reduction are necessary. The experiment with ammonia was performed using PAS setup at the Rice University Laser Science Group Laboratory with contribution of one of the authors (J.W.) of this paper [71]. The measurement was carried out with EC−QCL laser system (Daylight Solution) tuned to 10.3587 μm absorption line. Wavelength modulation and 2f detection was used. The setup provided detection limit of ~3 ppb at a pressure of 600 Torr. In Fig. 8 the shape of ammonia line registered using this PAS system is presented. Lower gas pressure ensured nar− Opto−Electron. Rev., 24, no. 2, 2016
rower gas absorption lines, but also lower PAS signal. It was because the energy transfer from excited molecules by means of a non−radiative processes is more efficient at higher pres− sures and leads to a stronger acoustic wave. Detection of biomarkers at the shorter wavelengths is more comfortable because of a large variety of available laser sources, optical elements, and photodetectors. The measure− ments of ammonia around 1.51 μm, were demonstrated using CEAS technique [72]. The detection limit of 18 ppb in a refer− ence gas was obtained. We found, that suitable wavelengths for ammonia detec− tion are also the lines at 1.5270005 μm and 1.5270409 μm. The NH3 absorption coefficient (at 2 ppm) reaches here about 3.5×10⁻⁵ cm–1 and the experimental techniques like MUPASS –WMS can be effectively used. In this range water vapour and carbon dioxide interferences are about 50 times weaker; there− fore, the detection limit of hundreds of ppb is available. Sam− ple drying or pressure reduction are not necessary to use, then the sensor construction and maintaining is cheaper and sim− pler than in mid−infrared (MIR) range. Our ammonia sensor worked at the lines presented in Fig. 9. The detection was performed with MUPASS – WMS system described in Chapter 2 [Fig. 2(b)]. Single mode diode laser (Toptica, model DL100, 20 mW) was used as a light source. The laser wavelength was modulated at a right wing of NH3 line within the wavelengths of 1.5270–1.5271 μm and a frequency of about 1 kHz. Precise AGF3102 digital genera− tor (Tektronix) was used for this purpose in order to achieve good repeatability of the data. Laser beam intensities were measured at both input and output of the multipass system with PDA10DT photodetectors (InGaAs – Thorlabs) and col− lected with SRS 830 lock−in voltmeters. The data were ave− raged over 1 min.
s or
th
Au
Ethane is characterized by a relatively low absorption co− efficient. Therefore, for its detection the most sensitive me− thod – CEAS − must be used. The test of our measuring system was performed using the reference gas samples prepared with 491M type KIN−TEK gas generator. CRDS setup with the optical cavity described earlier was applied. Pulsed parametric generator PG711−DFG−SH tuned to 3,348 μm was used as a light source. The test results are presented in Fig. 7. Simi− larly as in previous case, a good linearity between assumed concentration values and data obtained using CEAS was achieved.
Fig. 8. Example of normalized PAS signals for 1 ppm NH3 at different pressures.
T. Stacewicz Brought to you by | Military Technical Academy Authenticated |
[email protected] Download Date | 7/7/16 9:48 AM
87
Detection of disease markers in human breath with laser absorption spectroscopy served. This is probably a result of poor regulation of refer− ence concentration inside the sensor due to (mentioned above) NH3 deposit on the walls of the system. That causes a system− atic error of the measured data. Nevertheless, our multipass sensor is suitable for rough monitoring of this compound in the exhaled air and for detection of morbid states (> 2.9 ppm).
3.5. Carbon monoxide (CO)
Fig. 9. Absorption spectra of ammonia, H2O and CO2 around 1.527 μm.
s or
th
Au
Mixtures of ammonia in air were prepared with the system build of flow mass controllers (BetaErg). The system was sup− plied from a bottle of water free ammonia of the highest purity and from a bottle with filtered air. Concentrations of the mix− tures were calculated using flow controllers settings, because any independent system of the mixtures characterization was not available. In order to achieve NH3 concentration of several ppm and lower two step dilution of pure ammonia was neces− sary. The measurement was performed at the atmospheric pressure. In order to avoid the measurement disturbing by NH3 molecules adsorbed on the walls (and then desorbed), the sensor was kept at the temperature of 50oC. The results are presented in Fig. 10. The sensor provides proper results for NH3 concentrations up to about 1 ppm. For lower values the deviation from linear characteristics is ob−
Carbon monoxide is a biomarker of hyperbilirubina, oxidative stress, respiratory infections, and asthma [73–77]. It is also used to monitor bilirubin production in smoking cessation and access the lung diffusion capacity. Its concentration in healthy man breath should not exceed the value of 10 ppm, neverthe− less in some cases (for smokers) it can reach 20 ppm [78]. The best detection limits of CO in human breath (reaching hun− dreds and tens of ppb) were demonstrated in the spectral range of 4.6–5 μm using MUPASS – WMS approach [79]. Although the MIR spectroscopic systems of CO detection are characterized by the best detection limit, these solutions require the use of quantum cascade lasers, specialized pho− todetectors and optical materials. Looking for cheap solutions, suitable for screening investigation, it is reasonable to con− struct the sensors working in near−infrared (NIR) range. One can expect lower sensitivity but still enough for effective monitoring of CO in human breath, where the morbid level reaches 10 ppm. A profit consists in easily available and rela− tively cheap diode lasers, photodetectors (photodiodes, much more sensitive than for MIR spectral range) and standard optics. The measurement with the sensitivity of 900 ppb at the wavelength of 1.564 μm was already reported [80]. The analysis of HITRAN database [22] shows however, that CO absorption lines in 1.56–1.57 μm range are weak and strongly affected by H2O and CO2. More efficient detection can be performed in the spectral range of 2.33 μm (Fig. 11).
py
co
Fig. 10. Results of ammonia measurement with MUPASS – WMS system.
88
Fig. 11. Absorption spectrum of carbon oxide around 2.3337 μm.
Opto−Electron. Rev., 24, no. 2, 2016 Brought to you by | Military Technical Academy Authenticated |
[email protected] Download Date | 7/7/16 9:48 AM
2016 SEP, Warsaw
The absorption line of 2.33372 μm is the best candidate: its absorption coefficient at 10 ppm reaches the value of 4.4×10⁻⁶ cm–1, i.e., about 50 times higher than at 1.56 μm. High value of the absorption provides opportunity using MUPASS – WMS system. The interference by water vapour is about 200 times weaker and for CO2 this effect is negligible. The detec− tion limit might be reduced only in the case of methane pres− ence in the sample, but even at morbid level of CH4 (10 ppm) its interference is about 30 times weaker than the absorption of CO. Figure 12 presents the results of our CO sensor investiga− tion. The mixtures were prepared with the system constructed of flow mass controllers that was described in previous chap− ter. Good linear correlation between data supplied by the gas mixing system and the sensor was observed within the con− centration range of 0.4–100 ppm4. That is sufficient for CO monitoring in human breath for both morbid case and healthy man case.
Au
3.6. Methane (CH4)
used. Triangle shaped modulation of diode current enabled periodic scanning of laser wavelength over CH4 absorption line. The observation was performed for two cases: with the scanning from the line peak to its right wing, (i.e., within the range of 2.25366–2.2537 μm) or with modulation across the line (i.e., the wavelengths from 2.2536 to 2.2537 μm). The registration was made at the first or the second harmonic, respectively. Laser tuning signal was produced by digital ge− nerator (Tektronix). Mixtures of the gases were prepared with the system build of flow mass controllers which was described above. The measurements were performed at the atmospheric pressure. In order to check the sensor capabilities below the level limited by amount of methane in atmosphere, CH4 the mixtures were prepared with spectrally pure argon as carrier gas. Investigation results of the multipass methane sensor are presented in Fig. 14. Good linear characteristics was observed
s or
th
Mean methane concentration in ambient air is about 1.7 ppm. Its concentration in exhaled air is about 3–8 ppm, but the upper limit for healthy man can reach 10 ppm. The excess of CH4 concentration has been identified as a biomarker of co− lonic fermentation and intestinal problems [81]. Methane can be observed in NIR and MIR spectral ranges. Sensitive detection was already performed near wavelengths of 7.8 μm and the range of 3.3–3,5 μm with WMS and single pass spectrophotometry [80]. The detection limit of 0.5 ppm was achieved. It is sufficient to monitor CH4 in human breath. In near infrared (1.63 μm) the obtained limit was 6 ppm using 0.3 mW laser and photoacoustic system [82]. We found that the range of 2.25 μm is much more profit− able than the 1.63 μm one (Fig. 13). Although the absorption coefficient of methane for both cases is similar (~1.2×10⁻⁶ cm–1 at the concentration of 10 ppm), the region of shorter wavelengths is strongly affected by carbon dioxide band (a » 0.9×10⁻⁶ cm–1) [22]. Such interference is much weaker for the line of 2.25366 μm, since the absorption coefficients by CO2 and H2O are more than three orders of magnitude lower. Ammo− nia, which could occur in breath, might reduce the detection limit of methane to parts of ppm. Our observation of CO in in air was performed in the MUPASS – WMS system described above. As a light source, cw single mode DFB−diode laser was
Fig. 12. Results of CO sensor test.
py
co
4A
gap that occurs in Fig. 12 between two series of the experi− mental points (i.e., for the concentrations £ 4 ppm and the concentra− tions ³ 6 ppm) follows from a systematic error by gas supplying system. Large concentrations are produced due to a single step dilu− tion of CO in carrier gas (air it his case), while for small concentra− tions the two−step dilution was required. Opto−Electron. Rev., 24, no. 2, 2016
Fig. 13. Absorption spectrum of methane around 2.25366 μm.
T. Stacewicz Brought to you by | Military Technical Academy Authenticated |
[email protected] Download Date | 7/7/16 9:48 AM
89
Detection of disease markers in human breath with laser absorption spectroscopy
Fig. 15. UV extinction spectra of acetone, CO2 and Rayleigh scattering in air. Fig. 14. Results of methane sensor test.
Au
3.7. Acetone (CO(CH3)2)
s or
th
for both low and high concentrations. The precision of mea− surement was better than 0.1 ppm. As it was mentioned above, the concentration of methane in breath of a healthy man should not exceed 10 ppm. Therefore, such simple optical sys− tem fulfils well the requirement of precise sensor for monitor− ing of CH4 in the exhaled air.
py
co
Acetone can occur in the exhaled air of healthy man with a concentration of 0.39 to 0.85 ppm [66, 83–85]. The concen− tration exceeding the value of 1.4 ppm might suggest diabetes, but it also occurs in breath of children who are on a high−fat diet for the treatment of epilepsy [86]. This compound can also serve as an indicator of congestive heart failure and car− diac index [87,88]. Acetone may be detected using 0.266 μm radiation (Fig. 15) [89], however the observations at NIR spectral re− gion were reported, as well. CRDS is the best technique for this purpose due to a weak absorption coefficient (about 1.7×10⁻⁶ cm–1) in the UV spectral range at the limit of a mor− bid level. Such system was already demonstrated by Wang et al. [89–91]. Spectral fingerprints of acetone in the deep UV down to 115 nm were also reported [92]. Acetone may be detected using 0.266 μm radiation (Fig. 15) [89], however the observations at NIR spectral region was reported, as well. CRDS is the best technique for this purpose due to a weak absorption coefficient (about 1.7×10⁻⁶ cm–1) in the UV spectral range at the limit of morbid level. Such system was already demonstrated by Wang et al. [89–91]. Spectral fingerprints of acetone in the deep UV down to 115 nm were also reported [92].
90
The wavelength of 0.266 μm seems to be very suitable for acetone detection. Relatively cheap, pulsed or cw diode pum− ped solid state lasers (IV harmonic of YAG) are commercially available for this wavelength. No precise tuning to the broad absorption spectrum of acetone is necessary. Light detection might be performed with low noise solar blind photomulti− pliers. Neither water vapour nor carbon monoxide affect the CO(CH3)2 spectrum (Fig. 15). That simplifies sensor con− struction and makes it relatively cheap. However, despite of these advantages, the achievement of low detection limit finds the obstacles here. Rayleigh scattering in air is the main inter− fering phenomenon. The scattering at 0.266 μm dominates the absorption coefficient of acetone while it reaches the value of 2×10⁻⁶ cm–1 [93]. As far as both CRDS and multipass spec− troscopy provide the extinction coefficient of the sample, the radiation scattering cannot be distinguished from the absor− ption using these methods. The achievement of a low detection limit using CRDS is also problematic at 0.266 μm. Reflection coefficient of the mirrors that are commonly available on the market does not exceed the value of R = 0.993. Then, the photon lifetime in a typical cavity of L = 0.5 m length: t = L c (1 - R) = 0.33 μs. In such circumstances after the analysis of Eq. (1) one achie− ves the sensitivity limit of about 10–6 cm–1 only, assuming 1% – precision of photon lifetime determination. These problems were the main reason of poor results achieved with our CRDS sensor for acetone detection (Fig. 16). The measurement was done with a pulsed Nd:YAG laser generating at the fourth harmonics. The parameters of the cavity corresponded to the ones considered in the above paragraph. The gas mixing system with flow controllers, that was described above, was used again to prepare air – acetone mixture. In this case the system was supplied from a 5 l cham− ber containing saturated vapour of this compound in air. The
Opto−Electron. Rev., 24, no. 2, 2016 Brought to you by | Military Technical Academy Authenticated |
[email protected] Download Date | 7/7/16 9:48 AM
2016 SEP, Warsaw
high concentrations (ppm) resulting in relatively high ab− sorption coefficients (~10–6 cm–1) are mainly predestinated for such detection. For the sensors of such biomarkers a sim− ple multipass cell of effective light path length of tens of meters is sufficient.
Acknowledgements This work was supported by the National Science Centre funds due to DEC−2011/03/B/ST7/02544 decision.
References
Fig. 16. Results of acetone concentration measurement with CRDS system at 0.266 μm.
s or
th
Au
vapour was generated with liquid acetone evaporated at room temperature [94]. Unprecise work of the gas mixing system (20%) increased the experimental error in this case. The obstacles presented above, especially Rayleigh scat− tering, do not provide to imagine that such system of acetone detection in breath could be significantly improved. A reduc− tion of the air pressure in the sample does not lead to work around this problem. In opposite to IR spectra, the absorption band in UV occurs due to the transition to a higher electronic state. This band consists of a large number of overlapping lines. Therefore, the reduction of the sample pressure would lead to a diminution of both, Rayleigh scattering efficiency and acetone absorption coefficient. Quartz enhanced photoacoustic spectroscopy seems to be the most promising system for acetone detection at 0.266 μm. The photoacoustic sensors, which principle of operation con− sists in converting the light energy to the acoustic signal, are sensitive for absorbed radiation only; therefore the problem of Rayleigh scattering would be automatically eliminated. Good immunity for the external acoustic noises of quartz enhanced approach, its capability to analyse small gas samples, down to 3 mm3 in volume, would guarantee a high detection limit [27,95].
1. A. Ulanowska, T. Ligor, M. Michel, and B. Buszewski, “Hy− phenated and unconventional methods for searching volatile cancer biomarkers”, Ecol. Chem. Eng. 17(1), 9–23 (2010). 2. T. Ligor, Analityka wydychanego powietrza z zastosowaniem sprzężonych technik chromatograficznych z przeznaczeniem do badań przesiewowych chorób płuc, Wydawnictwo Naukowe Uniwersytetu Mikołaja Kopernika, Toruń, 2011. (IN POLISH) 3. T. Ligor, “Analytical methods for breath investigation”, Crit. Rev. Anal. Chem. 39, 2–12 (2009). 4. B. Buszewski, M. Kesy, T. Ligor, and A. Amann, “Human ex− haled air analytics: biomarkers of diseases”, Biomed. Chro− matogr. 21, 553–566 (2007). 5. W. Mueller, J. Schubert, A. Benzing, and K. Geiger, “Method for analysis of exhaled air by microwave energy desorption coupled with gas chromatography−flame ionization detection− −mass spectrometry”, J. Chromatogr. B 716, 27–38 (1998). 6. P.J. Mazzone, “Exhaled breath volatile organic compound bio− markers in lung cancer”, J. Breath Res. 6, 027106 (2012). 7. A. Ulanowska, E. Trawinska, P. Sawrycki, and B. Buszewski, “Chemotherapy control by breath profile with application of SPME−GC/MS method”, J. Sep. Sci. 35, 2908–2913 (2012). 8. A.W. Boots, J.J.B.N. Van Berkel, J.W. Dallinga, A. Smolinska, E.F. Wouters, and F.J.Van Schoten, “The versatile use of ex− haled volatile organic compounds in human health and dis− ease”, J. Breath Res. 6, 027108 (2012). 9. W. Miekisch, J. Herbig, and J.K. Schubert, “Data interpretation in breath biomarker research: pitfalls and directions”, J. Breath Res. 6, 1–10 (2012). 10. I.B. Silva, A.C. Freitas, T.A.P. Rocha−Santos, M.E. Pereira, and A.C. Duarte, “Breath analysis by optical fiber sensor for the determination of exhaled organic compounds with a view to diagnostics”, Talanta 83, 1586–1594 (2011). 11. F.S. Cikach Jr. and R.A. Dweik, “Cardiovascular biomarkers in exhaled breath”, Prog. Cardiovasc. Dis. 55, 34–43 (2012). 12. S. Kumar, J. Huang, J.R. Cushnir, P. Spanel, D. Smith, and G.B. Hanna, “Selected ion flow tubems analysis of headspace vapour from gastric content for the diagnosis of gastro−esopha− geal cancer”, Anal. Chem. 84, 9550–9557 (2012). 13. D. Smith and P. Spanel, “The challenge of breath analysis for clinical diagnosis and therapeutic monitoring”, Analyst 132(5), 390–396 (2007). 14. P.R. Boshier, J.R. Cushnir, and V. Mistry, “Online, real time monitoring of exhaled trace gases by SIFT−MS in the perio−
Opto−Electron. Rev., 24, no. 2, 2016
py
Our investigation of optoelectronic laboratory setups for de− tection of biomarkers in human breath shows that there is an opportunity to build relatively cheap, table−top systems des− ignated for monitoring of selected compounds using laser spectroscopy techniques. CEAS and MULTIPASS − WMS techniques are especially suitable for such constructions. The compounds that occur in the exhaled air at relatively
co
4. Conclusions
T. Stacewicz Brought to you by | Military Technical Academy Authenticated |
[email protected] Download Date | 7/7/16 9:48 AM
91
Detection of disease markers in human breath with laser absorption spectroscopy
15.
16.
17. 18.
19.
20.
29. K.W. Busch and M.A. Busch, Cavity−ringdown Spectroscopy, an Ultratrace−Absorption Measurement Technique, ACS Sym− posium series, American Chemical Society, Washington DC, 1999. 30. G. Berden and R. Engeln, Cavity Ring−Down Spectroscopy: Techniques and Applications, Edition, Wiley−Blackwell, 2009. 31. D. Romanini, A.A. Kachanov, N. Sadeghi, and F. Stoeckel, “CW−cavity ring down spectroscopy”, Chem. Phys. Lett. 264, 316–322 (1997). 32. J. Ye, L.S. Ma, and J.L. Hall, “Ultrastable optical frequency reference at 064 μm using a C2HD molecular overtone transi− tion”, IEEE T. Instrumentation and Measurement 46, 178–182 (1997). 33. A. Cygan, D. Lisak, P. Masłowski, K. Bielska, S. Wójtewicz, J. Domysławska, R. Trawiński, R. Ciuryło, H. Abe, and J.T. Hodges, “Pound−Drever−Hall−locked, frequency−stabilized ca− vity ring−down spectrometer”, Rev. Sci. Instrum. 82, 063107−1− 063107−12 (2011). 34. A. Cygan, S. Wójtewicz, J. Domysławska, P. Masłowski, K. Bielska, M. Piwiński, K. Stec, R. Trawiński, F. Ozimek, C. Radzewicz, H. Abe, T. Ido, J. T. Hodges, D. Lisak, R. and Ciuryło, “Spectral line−shapes investigation with Pound−Dre− ver−Hall−locked frequency−stabilized cavity ring−down spec− troscopy”, Eur. Phys. J. Spec. Top. 222, 2119–2142 (2013). 35. R. Engeln, G. Berden, R. Peeters, and G. Meier, “Cavity en− hanced absorption and cavity enhanced magnetic rotation spec− troscopy”, Rev. Sci. Instrum. 69, 3763–3769 (1998). 36. J.D. Ayers, R.L. Apodaca, W.R. Simpson, and D.S. Baer, “Off− −axis cavity ringdown spectroscopy: application to atmospheric nitrate radical detection”, Appl. Opt. 44, 7239–7242 (2005). 37. S.A. Kharitonov and P.J. Barnes, “Nitric oxide, nitrotyrosine, and nitric oxide modulators in asthma and chronic obstructive pulmonary disease”, Curr. Allergy Asthma Rep. 3, 121–129 (2003). 38. S.A. Kharitonov, A.U. Wells, B.J. O'Connor, P.J. Cole, D.M. Hansell, R.B. Logan−Sinclair, and P.J. Barnes, “Elevated levels of exhaled nitric oxide in bronchiectasis”, Am. J. Respir. Crit. Care Med. 151, 1889–1893 (1995). 39. J. Schilling, P. Holzer, M.Guggenbach, D. Gyurech, K. Ma− rathia, and S. Geroulanos, “Reduced endogenous nitric oxide in the exhaled air of smokers and hypertensives”, Eur. Respir. J. 7, 467–471 (1994). 40. U. Martin, K. Bryden, M. Devoy, and P. Howarth, “Increased levels of exhaled nitric oxide during nasal and oral breathing in subjects with seasonal rhinitis”, J. Allergy Clin. Immunol 97, 768–772 (1996). 41. S.A. Kharitonov and P.J. Barnes, “Nitric oxide in exhaled air is a new marker of airway inflammation”, Monaldi. Arch. Chest Dis. 51, 533–537 (1996). 42. K. McCluskie, M.A. Birrell, S. Wong, and M.G. Belvisi, “Ni− tric oxide as a noninvasive biomarker of lipopolysaccharide−in− duced airway inflammation: possible role in lung neutrophilia”, J. Pharmacol. Exp. Ther. 311, 625–633 (2004). 43. M.A. Birrell, K. McCluskie, E. Hardaker, R. Knowles, and M.G. Belvisi, “Utility of exhaled nitric oxide as a noninvasive biomarker of lung inflammation in a disease model”. Eur. Respir. J. 28, 1236–1244 (2006).
s or
th
22.
Au
21.
perative setting: a feasibility study”, Analyst 136, 3233– 3237 (2011). W. Tianshu, P. Andriy, D. Kseniya, S. Patrik, and S. David, “Analysis of breath, exhaled via the mouth and nose, and the air in the oral cavity”, J. Breath Res. 2, 037013 (2008). P. Čáp, K. Dryahina, F. Pehal, and P. ŠpanÆl, “Selected ion flow tube mass spectrometry of exhaled breath condensate headspace”, Rapid Commun. Mass Spectrom. 22, 2844–2850 (2008). T.H. Risby and S.F. Solga, “Current status of clinical breath analysis”, Appl. Phys. B 85, 421–426 (2006). S. Kumar, J. Huang, J.R. Cushnir, P. Spanel, D. Smith, and G.B. Hanna, “Selected ion flow tube−ms analysis of headspace vaper from gastric content for the diagnosis of gastro−esopha− geal cancer”. Anal Chem. 84, 9550–7 (2012). F.Di Francesco, R. Fuoco, M.G.Trivella, and A. Ceccarini, “Breath analysis: trends in techniques and clinical applica− tions”, Microchem. J. 79, 405–410 (2005). R.F. Machado, D. Laskowski, O. Deffenderfer, T. Burch, S. Zheng, P.J. Mazzone, T. Mekhail, C. Jennings, J.K. Stoller, J. Pyle, J. Duncan, R.A. Dweik, and S.C. Erzurum, “Detection of lung cancer by sensor array analyses of exhaled breath”, Am. J. Respir. Crit. Care Med. 171, 1286–1291 (2005). B. Buszewski, D. Grzywinski, T. Ligor, T. Stacewicz, Z. Bie− lecki, and J. Wojtas, “Detection of volatile organic compounds as biomarkers in breath analysis by different analytical tech− niques”, Bioanalysis 5, 2287–2306 (2013). L.S. Rothman, I.E. Gordon, Y. Babikov, A. Barbe, D.C. Ben− ner, P.F. Bernath, M. Birk, L. Bizzocchi, V. Boudon, L.R. Brown, A. Campargue, K. Chance, E.A. Cohen, L.H. Coudert, V.M. Devi, B.J. Drouin, A. Fayt, J.M. Flaud, R.R. Gamache, J.J. Harrison, J.M. Hartmann, C. Hill, J.T. Hodges, D. Jac− quemart, A. Jolly, J. Lamouroux, R.J. LeRoy, G. Li, D.A. Long, O. Lyulin, C. Mackie, S.T. Massie, S. Mikhailenko, H.S. Müller, O. Naumenko, A. Nikitin, J. Orphal, V.I. Perevalov, A. Perrin, E.R. Polovtseva, C. Richard, M.A.H. Smith, E. Stari− kova, K. Sung, S. Tashkun, J. Tennyson, G.C. Toon, Vl.G. Tyuterev, and G. Wagner, “The HITRAN 2012 molecular spectroscopic database”, J. Quant Spectr. Radiation Transfer 130, 4–50 (2013). https://www.google.pl/search?q=nafion+humidifier&ie=utf−8 &oe=utf−8&gws_rd=cr&ei=QrR_Vr−GCsXVyAOgso7wDQ. G. Peach, “Theory of the pressure broadening and shift of spec− tral lines”, Adv. in Phys. 30 (3): 367–474 (1981). J. Wojtas, Z. Bielecki, T. Stacewicz, J. Mikolajczyk, and M. Nowakowski,“Ultrasensitive laser spectroscopy for breath ana− lysis”, Opt. Electron. Rev. 20, 77–90 (2012). T. Stacewicz, J. Wojtas, Z. Bielecki, M. Nowakowski, J. Miko− łajczyk, R. Mędrzycki, and B. Rutecka, “Cavity ring down spectroscopy: Detection of trace amounts of matter”, Opt. Elec− tron. Rev. 20, 34–41 (2012). P. Patimisco, G. Scamarcio, F.K. Tittel, and V. Spagnolo, “Quartz−Enhanced Photoacoustic Spectroscopy: a Review”, Sensors 14, 6165–6206 (2014). A.O’ Keefe and D.A.G. Deacon, “Cavity ring−down optical spectrometer for absorption measurements using pulsed laser sources”, Rev. Sci. Instrum. 59, 2544–2551 (1988).
25.
26.
27.
28.
92
py
24.
co
23.
Opto−Electron. Rev., 24, no. 2, 2016 Brought to you by | Military Technical Academy Authenticated |
[email protected] Download Date | 7/7/16 9:48 AM
2016 SEP, Warsaw
59. M. Refat, T.J. Moore, M. Kazui, T.H. Risby, J.A. Perman, and K.B. Schwarz, “Utility of breath ethane as a noninvasive bio− marker of vitamin E status in children”, Pediatr. Res. 30, 396–403 (1991). 60. C.A. Riely, G. Cohen, and M. Lieberman, “Ethane evolution: a new index of lipid peroxidation”, Science 183, 208–210 (1974). 61. G.D. Lawrence and G. Cohen, “Ethane exhalation as an index of in vivo lipid peroxidation: concentrating ethane from a breath collection chamber”, Anal. Biochem. 122, 283–290 (1982). 62. P. Paredi, S.A. Kharitonov, and P.J. Barnes, “Elevation of ex− haled ethane concentration in asthma”, Am. J. Respir. Crit. Care Med. 162, 1450–1454 (2000). 63. C.S. Patterson, L.C. McMillan, K. Stevenson, K. Radhakri− shnan, P.G. Shiels, M.J. Padgett, and K.D. Skeldon, “Dynamic study of oxidative stress in renal dialysis patients based on breath ethane measured by optical spectroscopy”, J. Breath Res. 1(2), 026005:1–026005:8 (2007). 64. C. Wang, P. Sahay, “Breath analysis using laser spectroscopic techniques: breath biomarkers, spectral fingerprints, and detec− tion limits”, Sensors 9, 8230–8262 (2009). 65. D. Halmer, S. Thelen, P. Hering, and M. Mürtz, “Online moni− toring of ethane traces in exhaled breath with a difference fre− quency generation spectrometer”, Appl. Phys. B: Lasers Opt. 85, 437–443 (2006). 66. C.J. Wang, S.T. Scherrer, and D. Hossain, “Measurements of cavity ringdown spectroscopy of acetone in the ultraviolet and nearinfrared spectral regions: Potential for development of a breath analyzer”, Appl. Spectroscopy 58, 784–791 (2004). 67. D.J. Kearney, T. Hubbard, and D. Putnam, “Breath ammonia measurement in Helicobacter pylori infection”, Dig. Dis. Sci. 47, 2523–2530 (2002). 68. D. Smith, T. Wang, A. Pysanenko, and P. Spanel, “A selected ion flow tube mass spectrometry study of ammonia in mouth− and nose−exhaled breath and in the oral cavity”, Rapid Com− mun. Mass Spectrom. 22, 783–789 (2008). 69. J. Manne, O. Sukhorukov, W. Jager, and J. Tulip, “Pulsed quantum cascade laser−based cavity ring−down spectroscopy for ammonia detection in breath”, Appl. Opt. 45, 9230–9237 (2006). 70. J. Manne, W. Jager, and J. Tulip, “Sensitive detection of am− monia and ethylene with a pulsed quantum cascade laser using intra and interpulse spectroscopic techniques”, Appl. Phys. B: Lasers Opt. 94, 337–344 (2009). 71. J. Wojtas, F.K. Tittel, T. Stacewicz, Z. Bielecki, R. Lewicki, J. Mikołajczyk, M. Nowakowski, D. Szabra, P. Stefanski, and J. Tarka, “Cavity enhanced absorption spectroscopy and photo− acoustic spectroscopy for human breath analysis”, Int. J. Ther− mophysics 35, 2215–2225 (2014). 72. M.J. Thorpe, D. Balslev−Clausen, M.S. Kirchner, and J. Ye, “Cavity−enhanced optical frequency comb spectroscopy: appli− cation to human breath analysis”, Opt. Express 16, 2387–2397 (2008). 73. H.J. Vreman, J.J. Mahoney, and D.K. Stevenson, “Carbon mo− noxide and carboxyhemoglobin”, Adv. Pediatr. 42, 330–334 (1995).
s or
th
Au
44. http://www.thoracic.org/about/overview.php 45. http://www.ersnet.org/images/stories/pdf/ERS_Annual_re− port_1314.pdf 46. C. Roller, K. Namjou, J.D. Jeffers, M. Camp, A. Mock, P.J. McCann, and J. Grego, “Nitric oxide breath testing by tun− able−diode laser absorption spectroscopy: application in moni− toring respiratory inflammation”, Appl. Opt. 41, 6018–6029 (2002). 47. K. Namjou, C.B. Roller, and G. McMillen, “Breath analysis us− ing mid infrared tunable laser spectroscopy”, Proc. of the 6th Annual IEEE Conf. on Sensors, Atlanta, GA, USA, pp. 1337–1340, 2007. 48. Y.A. Bakhirkin, A.A. Kosterev, C. Roller, R.F. Curl, and F.K Tittel,. “Mid−infrared quantum cascade laser based off−axis in− tegrated cavity output spectroscopy for biogenic nitric oxide detection”, Appl. Opt. 43, 2257–2266 (2004). 49. M.R. McCurdy, Y. Bakhirkin, G. Wysocki, and F.K. Tittel, “Performance of an exhaled nitric oxide and carbon dioxide sensor using quantum cascade laser−based integrated cavity output spectroscopy”, J. Biomed. Opt. 12, 034034:1–034034:9 (2007). 50. A.A. Kosterev, A.L. Malinovsky, F.K. Tittel, C. Gmachl, F. Capasso, D.L. Sivco, J.N. Baillargeon, A.L. Hutchinson, and A.Y. Cho, “Cavity ringdown spectroscopic detection of nitric oxide with a continuous−wave quantum−cascade laser”, Appl. Opt. 40, 5522–5529 (2001). 51. K. Heinrich, T. Fritsch, P. Hering, and M. Murtz, “Infrared la− ser−spectroscopic analysis of 14NO and 15NO in human breath”. Appl. Phys. B: Lasers Opt. 95, 281–286 (2009). 52. L. Ciaffoni, R. P. a. G. A. D. R. (2011). “Laser spectroscopy on volatile sulfur compounds: possibilites for breath analysis”, J. Breath Research 5, 024002 (2011). 53. G. Neri, A. Bonavita, S. Ipsale, G. Micali, G. Rizzo, and N. Donato, “Carbonyl Sulphide (COS) monitoring on MOS sen− sors for biomedical applications”. ISIE 2007, pp. 2776–2781 (2007). 54. L. Bennett, L. Ciaffoni, W. Denzer, G. Hancock, A.D. Lunn, R. Peverall, S. Praun, and G.A.D. Ritchie, “A chemometric study on human breath mass spectra for biomarker identification in cystic fibrosis”, J. Breath Res. 3, 1–7 (2009). 55. D. Halmer, G. von Basum, P. Hering, and M. Murtz, “Mid−in− frared cavity leak−out spectroscopy for ultrasensitive detection of carbonyl sulfide”, Opt. Lett. 30, 2314–2316 (2005). 56. C. Fischer and M.W. Sigrist, “Trace gas sensing in the 3.3 μm region using a diode based difference frequency laser pho− toacoustic system”, Appl. Phys. B: Lasers Opt. 75, 305–310 (2002). 57. S.R. Svedahl, K. Svendsen, E. Tufvesson, P.R. Romundstad, A.K Sjaastad, T. Qvenild, and B. Hilt, “Inflammatory markers in blood and exhaled air after short−term exposure to cooking fumes”, The Annals of Occupational Hygiene 57, 230–239 (2012). 58. R. Matthew Y.B. McCurdy, G. Wysocki, R. Lewicki, and F.K. Tittle. “Recent advances of laser−spectroscopy−based techni− ques for applications in breath analysis”, J. Breath Res. 1, 014001 (2007).
py
co
Opto−Electron. Rev., 24, no. 2, 2016
T. Stacewicz Brought to you by | Military Technical Academy Authenticated |
[email protected] Download Date | 7/7/16 9:48 AM
93
Detection of disease markers in human breath with laser absorption spectroscopy 85. K. Namjou, C.B. Roller, T.E. Reich, J.D. Jeffers, G.L. McMillen, P.J. McCann, and M.A. Camp, “Determination of exhaled nitric oxide distributions in a diverse sample popula− tion using tunablediode laser absorption spectroscopy”, Appl. Phys. B: Lasers Opt. 85, 427–435 (2006). 86. K. Musa−Veloso, S.S. Likhodii, E. Rarama, S. Benoit, Y.M.C. Liu, D. Chartrand, R. Curtis, L. Carmant, A. Lortie, F.J.E. Comeau, and S.C. Cunnane, “Breath acetone predicts plasma ketone bodies in children with epilepsy on a ketogenic diet”, Nutrition 22, 1–8 (2006). 87. F. Pabst, W. Miekisch, P. Fuchs, S. Kischkel, and J.K. Schu− bert, “Monitoring of oxidative and metabolic stress during car− diac surgery by means of breath biomarkers: an observational study”, J. Cardiothorac. Surg. 2, 37 (2007). 88. M. Kupari, J. Lommi, M. Ventila, and U. Karjalainen, “Breath acetone in congestive heart failure”, Am. J. Cardiol. 76, 1076–1078 (1995). 89. C. Wang and A. Mbi, “A new acetone detection device using cavity ringdown spectroscopy at 266 nm: evaluation of the in− strument performance using acetone sample solutions”, Meas. Sci. Technol. 18, 2731–2741 (2007). 90. C. Wang, A. Mbi, M. Shepherd, “A study on breath acetone in diabetic patients using a cavity ringdown breath analyzer: ex− ploring correlations of breath acetone with blood glucose and glycohemoglobin A1C”. IEEE. J. Sensors. 10, 54–63 (2010). 91. C. Wang and A.B. Surampudi, “An acetone breath analyser us− ing cavity ringdown spectroscopy: an initial test with human subjects under various situations”. Meas. Sci. Technol. 19, 105604–105614 (2008). 92. F. da Silva, M. Nobre, A. Fernandes, R. Antunes, D. Almeida, G. Garcia, N.J. Mason, and P. Limăo−Vieira, “Spectroscopic studies of ketones as a marker for patients with diabetes”, J. Phys.: Conf. Series 101, 012011/1–7 (2008). 93. B.A. Bodhaine, N.B. Wood, E.G. Dutton, and J.R. Slusser, “On Rayleigh Optical Depth Calculation”, J. Atm. Ocean. Tech. 16, 1854–1861 (1999). 94. Lange's Handbook of Chemistry, Sixteenth Edition, McGraw− −Hill Education: New York, Chicago, San Francisco, Lisbon, London, Madrid, Mexico City, 2005. 95. Y. Ma, R. Lewicki, M. Razeghi, and F.K. Tittel, “QEPAS based ppb−level detection of CO and N2O using a high power CW DFB−QCL”, Opt Express. 21, 1008–19 (2013).
s or
th
Au
74. D.K. Stevenson and H.J. Vreman, “Carbon monoxide and bili− rubin production in neonates”, Pediatr. Rev. 100, 252–259 (1997). 75. L.A. Applegate, P. Luscher, and R.M. Tyrrell, “Induction of heme oxygenase: a general response to oxidant stress in cul− tured mammalian cells”, Cancer Res. 51, 974–978 (1991). 76. M. Yamaya, K. Sekizawa, S. Ishizuka, M. Monma, K. Mizuta, and H. Sasaki, “Increased carbon monoxide in exhaled air of subjects with upper respiratory tract infections”, Am. J. Respir. Crit. Care Med. 158, 311–314 (1998). 77. K. Zayasu, K. Sekizawa, S. Okinaga, M. Yamaya, T. Ohrui, and H. Sasaki, “Increased carbon monoxide in exhaled air of asthmatic patients”, Am. J. Respir. Crit. Care Med. 156, 1140–1143 (1997). 78. M.J. Thorpe, K.D. Moll, J.R. Jones, B. Safdi, and J. Ye, “Broadband cavity ringdown spectroscopy for sensitive and rapid molecular detection”, Science 311, 1595–1599 (2006). 79. B.W. Moeskops, S.M. Cristescu, and F.J. Harren, “Sub−part− −per−billion monitoring of nitric oxide by use of wavelength modulation spectroscopy in combination with a thermoelectri− cally cooled, continuous−wave quantum cascade laser”, Opt. Lett. 31, 823–825 (2006). 80. K.L. Moskalenko, A.I. Nadezhdinskii, and I.A. Adamovskaya, “Human breath trace gas content study by tunable diode laser spectroscopy technique”, Infrared Phys. Tech. 37, 181–192 (1996). 81. L. Le Marchand, L.R. Wilkens, P. Harwood, and R.V. Cooney, “Use of breath hydrogen and methane as markers of colonic fermentation in epidemiologic studies: circadian patterns of ex− cretion”, Environ. Health Perspect. 98, 199–202 (1992). 82. M. Scotoni, A. Rossi, D. Bassi, R. Buffa, S. Iannotta, and A. Boschetti, “Simultaneous detection of ammonia, methane and ethylene at 1.63 μm with diode laser photoacoustic spectros− copy”, Appl. Phys. B: Lasers Opt. 82, 495–500 (2006). 83. J.C. Anderson, W.J.E. Lamm, and M.P. Hlasatala, “Measuring airway exchange of endogenous acetone using a single−exhala− tion breathing maneuver”, J. Appl. Physiol. 100, 880–889 (2005). 84. C. Turner, P. Spanel, and D. Smith, “A longitudinal study of ammonia, acetone and propanol in the exhaled breath of 30 subjects using selected ion flow tube mass spectrometry SIFT−MS”, Physiol. Meas. 27, 321–337 (2006).
py
co
94
Opto−Electron. Rev., 24, no. 2, 2016 Brought to you by | Military Technical Academy Authenticated |
[email protected] Download Date | 7/7/16 9:48 AM
2016 SEP, Warsaw