Automated Atmospheric Visibibility Measurements using a Digital Camera and Image Registration Fernando M. Janeiro1,2, Frank Wagner3, Pedro M. Ramos2,4, Ana M. Silva1,3 1
Universidade de Évora, Departamento de Física, Rua Romão Ramalho, nº. 59, 7000-671 Évora, Portugal, Phone: +351-266745300; e-mail:
[email protected],
[email protected] 2 Instituto de Telecomunicações, Av. Rovisco Pais 1, 1049-001 Lisbon, Portugal 3 Centro de Geofísica de Évora, Rua Romão Ramalho, nº. 59, 7000-671 Évora, Portugal, e-mail:
[email protected] 4 Department of Electrical and Computer Engineering, Instituto Superior Técnico, Technical University of Lisbon, IST, Av. Rovisco Pais 1, 1049-001 Lisbon, Portugal Phone: +351-218418485; Fax: +351-218418472, e-mail:
[email protected]
Abstract- In this paper, a prototype for automatically measuring the atmospheric visibility using a digital camera is described. The dark object approach is used on the images obtained by the camera. In this method, two dark objects must first be identified in the images so that visibility can be derived using the modified Koschmieder formula. Due to inherent camera positioning shifts, the images are not always aligned which leads to an altered position of the chosen objects. Therefore, image registration algorithms are needed so that the atmospheric visibility can be automatically retrieved. The dark object approach and the image registration algorithms are described. Results for a clear day and for an hazy day are presented.
I. Introduction Atmospheric visibility is an important parameter in many aspects of everyday life, from transport systems to air quality and tourism. In airports, planes may not land or takeoff if the visibility is below a certain value. Road transportation is prone to accidents, especially when the visibility changes drastically in space or in time, since drivers may not have the time to react to a sudden visibility reduction (e.g. appearance of fog). Low visibility values may indicate poor air quality due to high particle concentration, which absorbs and scatters light therefore reducing visibility. Tourism is also affected by low visibility values for example, when landscape scenery may not be visible from a view point. Commercial instruments used to measure visibility accomplish the task in an indirect way. Visibility meters determine the scattered light intensity in a point, transmissiometers measure the light reduction between a short distance of 20 up to 100 m, and telephotometers measure radiation intensity with a high spectral resolution using artificial dark objects. From those measurements the atmospheric visibility can be derived [1, 2]. Another approach is to use digital photography to assess the atmospheric visibility [3], based on obtaining the contrast between a dark object and the background [4]. This approach has the advantage of being low cost and can also be used for landmark detection which is the way a human observer estimates visibility values. The atmospheric visibility is closely connected to the aerosols distribution in the atmosphere [5]. The possibility of using the setup presented in this paper to study the aerosol composition is also discussed. This paper describes a digital camera based prototype for measuring the atmospheric visibility by using the dark object approach. The automation of the real time measurements is accomplished by computer controlling the digital camera and applying image registration algorithms [6-8] to correctly identify the objects used in deriving visibility values. The extinction coefficient of the atmosphere along the path where the visibility is being measured is also available from the measurements based on this method.
II. Experimental Setup and Method Atmospheric visibility is defined as the maximum distance at which an object can be distinguished against the background by the human eye. This occurs when the contrast between the object and the background falls below a certain threshold. This contrast can be defined as C ( x) =
IB − I ( x)
(1)
IB
where I B is the background intensity and I ( x ) is the intensity of the object located at distance x from the observer. The apparent object intensity varies with distance because of the absorption and scattering of light (coming from the direction of the object) by atmospheric particles and molecules. It is possible to show that, due to these effects, the contrast of an object is given by the Lambert-Beer law [1] C ( x ) = C0 exp ( −bext x )
(2)
where C0 is a calibrating constant and bext is the extinction coefficient which accounts for the absorption and scattering by the atmosphere. The calibrating constant depends on the nature of the object and its lighting conditions, as well as on the background conditions and can be eliminated by using two similar objects located at different distances from the observer. Figure 1 shows the setup used for this purpose where a digital photograph is taken at a landscape which includes two similar objects at distances x1 and x2 from the observer.
Background
x2 x1
Hills Tree Group
Figure 1. Experimental setup and actual landscape and objects used for visibility derivation.
By measuring the intensities of both objects and the background, the contrast for each object can be determined and the calibrating constant eliminated through C ( x2 ) C ( x1 )
= exp ⎡⎣ −bext ( x2 − x1 ) ⎤⎦ .
(3)
The extinction coefficient can be extracted from (3) and the atmospheric visibility can be inferred by using the modified Koschmieder formula [9] Visibility =
3.0 . bext
(4)
The factor 3.0 corresponds to having a contrast threshold of 5% in (2). If a threshold of 2% were used then the constant 3.0 should be replaced by 3.9 [9]. In a study by Middleton [9], where 1000 people were tested, it was found that the contrast threshold for an object to be distinguished against the background can vary, from person to person, from 1% to 20%. However, most people can still detect
an object when the contrast is 2%, if looking with enough attention. In normal everyday conditions a 5% contrast threshold is a more realistic value. The method described is only exact under ideal conditions, which includes the use of black objects (no light is reflected from the object into the camera) and low particle concentrations, so that multiple scattering effects can be neglected. The latter constraint is usually fulfilled under normal atmospheric conditions, except for fog. The use of artificial objects is not practical since they would be expensive. Also, with increasing distance, the objects sizes must also increase so that the camera can detect them. Natural objects should therefore be used, but in reality, natural black objects do not exist. However, sufficiently dark objects (e.g. forests) may be used for this method. It is only needed that the radiance due to the reflection of light by the dark object is much smaller than radiance coming from the objects direction caused by scattering processes in the atmosphere. Figure 1 shows a picture of the real landscape and the objects used for testing this experimental setup. The objects used are a tree group located at x1 = 6 km from the camera and the tree covered hills in the back at distance x2 = 24 km . The red squares show the areas used for measuring the intensities of each object and the background. The effects of spatial inhomogeneities of each region, either caused by the object, the atmosphere or the camera, are reduced by averaging all pixel values inside each marked region. The digital camera used is a commercial Olympus C-4000 Zoom with a 4 MPixel CCD, an aperture range from f2.8 to f11 and a shutter speed between 1 s and 1/1000 s. The camera is computer controlled and a picture is taken every 10 minutes which is then stored in the computer (in TIFF format) for automatic processing. The aperture and exposure time are determined automatically by the camera. The availability of the Red, Green and Blue channels allows the calculation of the extinction coefficient and atmospheric visibility at those wavelength bands with mean values around 600 nm, 550 nm and 450 nm, respectively.
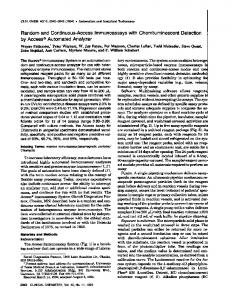
III. Image Registration To calculate the atmospheric visibility from the pictures obtained during the day and over different days, it is necessary to extract the intensities of the different objects identified in Figure 1. However, due to the inaccuracies in the camera positioning on different days and also due to small camera movements caused by wind, the objects change their position on the image relative to a so-called reference picture. Hence it is necessary to identify the objects positions on each picture. This is a tedious and time consuming task that can be automated by applying image registration algorithms that automatically align the acquired images with a reference image. Since the pixel location for each object is known on the reference image, they will also be available on the analyzed imaged after registration. In general, if the images need to be translated, rotated, scaled or even warped, image registration algorithms can be very complex and computationally demanding. However, for affine transformations the algorithms are significantly simplified, and if only translations are needed the normalized cross-correlation between two images can be used [6, 8]. Since the zoom used is fixed, the misalignment of the camera only creates translations on images acquired at different times. However, when the prototype is deployed to different locations and in different conditions, image rotations should also be taken into account. Figure 2 shows: a) the reference image; b) image to be registered, acquired around noon; and c) image to be registered, acquired at sunset. The images presented are cropped at about ¼ of the original images, so that the objects can be clearly identified. The processing of such cropped images is also faster than if the original images were used. In both cases the images can be registered by horizontal and vertical translation only. It should be noted that any image which includes the tree group and the hills behind may be used as reference image. a)
b)
c)
Figure 2. Cropped landscape pictures used for image registration: a) reference image; b) and c) images with different lighting conditions that need to be registered for automatic processing.
Analysis of Figure 2 b) and c) shows that very different lighting conditions can be encountered in the acquired images. This can be a problem for the image registration algorithms, which fail when there is a large illumination difference between the reference and the acquired images. One way to solve this problem is to apply an edge detection algorithm to both images and then apply the normalized cross-correlation. The Sobel operator is frequently used in edge detection [6, 7]. It calculates the derivative of a grayscale image. By applying a certain threshold value to the result of the Sobel operator, a black and white image with only the edges is produced. A threshold of 0.02 is used and the result is shown in Figure 3. Several threshold levels were tested and the value 0.02 was found to be suitable for our purposes. The lighting differences have now disappeared and the normalized crosscorrelation between the analyzed and reference images yields a translation of 123 pixels to the right and 36 pixels upwards.
a)
b)
c)
Figure 3. Edge filtering of images in Figure 2 using a Sobel operator with a threshold value of 0.02.
IV. Measurement Results The image registration algorithms described in the previous section are fast enough to have automated real-time atmospheric visibility measurements. The camera-prototype has been tested on different weather conditions such as clear days, cloudy days, both with high or low visibility values. The derived visibility values for the green channel were always close to the visibility estimated by a human observer. The green channel is preferred for comparison because the human eye is most sensitive in the green part of the visible light spectrum. Due to the usually increased scattering of radiation at shorter wavelengths, the visibility values for the blue channel are lower and for the red channel higher than the values for the green channel (see Figures 4 and 5). The results presented in Figure 4 were obtained on March 11th, 2007 in the South of Portugal. The extinction coefficient as well as the atmospheric visibility values were obtained for the three different channels (RGB). The visibility was unusually high during the whole day with values on the range between 70 km and 80 km for the green channel. The extinction coefficient values were also very low when compared with the average for this time of the year. These results are corroborated by in situ measurements at Évora’s Geophysics Center (CGE) observatory at ground level. Several different instruments determined that the particle load was very low on this day, which corresponds to low atmospheric extinction coefficients and is consistent with high atmospheric visibility values. For example, on this day the nephelometer measured a scattering coefficient of 0.014 km-1 at 550 nm (corresponding to the green channel), which is a very low value for the region at this time of the year, thus confirming the high visibility conditions encountered. This is also in agreement with the findings by Horvath et. al. [2], where it was reported that for rural areas in Europe, the visibility may be as high as 100 km. Figure 5 shows the extinction coefficient and the corresponding atmospheric visibility values obtained on a cloudy and hazy day – June 14th, 2005. The extinction coefficient values are much higher than on the previous example, which is consistent with an atmosphere with a higher density of particles. The atmospheric visibility remained around 25 km along the whole day (for the green channel). However, the temporal variability was much larger when compared to the clear day. The extinction coefficient is equal to the absorption plus scattering of light by the particles (i.e., aerosols) and the molecules in the atmosphere. The effect of molecules on the extinction coefficient can be corrected for, and the result is just the extinction of the aerosols. From this information it is possible to obtain a rough estimation of the particle number and size distribution. Thus, besides measuring atmospheric visibility, this setup has the potential to be used as an aerosol monitoring system.
120
0.07
B
R
100
0.05 80
G
Visibility [km]
Extinction Coefficient [km-1]
0.06
0.04 R 0.03
G
B
60
40 0.02 20
0.01
11-03-2007
11-03-2007 0 6:00
8:00
10:00
12:00
14:00
16:00
18:00
0 6:00
20:00
8:00
Time of Day
10:00
12:00
14:00
16:00
18:00
20:00
Time of Day
Figure 4. Extinction coefficient and atmospheric visibility values for the RGB channels on a clear day.
0.2
50 B
R
Visibility [km]
-1
Extinction Coefficient [km ]
40 0.15
G 0.1 R
30 G 20
B
0.05 10
14-06-2005
14-06-2005 0 10:00
12:00
14:00
16:00
18:00
20:00
0 10:00
12:00
Time of Day
14:00
16:00
18:00
20:00
Time of Day
Figure 5. Extinction coefficient and atmospheric visibility values for the RGB channels on an hazy day.
V. Summary and Conclusions In this paper, an automated atmospheric visibility measuring device, based on digital photography, is described. The measuring method is based on the dark object approach. The experimental setup as well as a suitable landscape are presented and used to derive the atmospheric visibility. Due to inherent inaccuracy of the camera positioning over time, image registration algorithms are needed to automate the visibility measurements. The image registration used works well for translations and its robustness to different lighting conditions is ensured by a Sobel edge detector before the application of the normalized cross-correlation. The image processing is sufficiently fast for real-time operation. Measurement results for both a clear day and an hazy day were presented. The extinction coefficient and the atmospheric visibility were derived for these days and the values obtained are consistent with in situ measurements by different instruments at CGE observatory. The system was tested on a variety of days with different weather conditions and the results were in good agreement with the values obtained by a human observer using the landmark detection method.
Acknowledgements Frank Wagner’s work was supported by Fundação para a Ciência e Tecnologia under grant SFRH-BPD-29687-2006.
References [1] J. Seinfeld and S. Pandis, Atmospheric Chemistry and Physics, John Wiley & Sons, New York, 1998. [2] H. Horvath, “Estimation of the Average Visibility in Central Europe”, Atmospheric Environment, vol. 29, pp. 241-246, 1995. [3] F. M. Janeiro, F. Wagner and A. Silva, “Visibility Measurements Using a Commercial Digital Camera”, in Conference on Visibility, Aerosols, and Atmospheric Optics, Vienna, Austria, September 2006. [4] H. Horvath, “Spectral Extinction Coefficients of Rural Aerosol in Southern Italy – A Case Study of Cause and Effect of Variability of Atmospheric Aerosol”, J. Aerosol Sci., vol. 27, pp. 437-453, 1996. [5] J.L. Hand, S.M. Kreidenweis, D.E. Sherman, J.L. Collett Jr., S.V. Hering, D.E. Day and W.C. Malm, “Aerosol size distributions and visibility estimates during the Big Bend regional aerosol and visibility observational (BRAVO) study”, Atmospheric Environment, vol. 36, pp. 5043-5055, 2002. [6] W. K. Pratt, Digital Image Processing, John Wiley & Sons, New York, 2001. [7] B. Jähne, Digital Image Processing, Springer Verlag, Berlin, 2002. [8] B. Zitova and J. Flusser “Image registration methods: a survey”, Image and Vision Computing, vol. 21, pp. 977-1000, 2003. [9] W. Middleton, Vision Through the Atmosphere, University of Toronto Press, Toronto, 1968.