perceptual features that pathologists use to derive their HER2 staining assessment. ..... Clinical Oncology/College of American Pathologists guideline.
AUTOMATED EVALUATION OF HER-2/NEU IMMUNOHISTOCHEMICAL EXPRESSION IN BREAST CANCER USING DIGITAL MICROSCOPY Marios A. Gavrielides 1, Hela Masmoudi 1,2, Nicholas Petrick 1, Kyle J. Myers1, and Stephen M. Hewitt3 1
National Institute of Biomedical Imaging and Bioengineering (NIBIB)/Center for Devices and Radiological Health (CDRH) Laboratory for the Assessment of Medical Imaging Systems, U.S Food and Drug Administration, Silver Spring, MD, U.S.A. 2 Department of Electrical and Computer Engineering, The George Washington University, Washington, DC, U.S.A. 3 Tissue Array Research Program, Center for Cancer Research, National Cancer Institute, National Institutes of Health, Bethesda, MD, U.S.A.
ABSTRACT HER-2/neu (HER2) has been shown to be a valuable biomarker for breast cancer. However, inter-observer variability has been reported in the evaluation of HER2 with immunohistochemistry. It has been suggested that automated computer-based evaluation can provide a consistent and objective measure of HER2 expression. In this manuscript, we present an automated method for the quantitative assessment of HER2 using digital microscopy. The method employs imaging algorithms on whole slide images of tissue specimens for the extraction of two features describing HER2 membrane staining, namely membrane staining completeness and membrane staining intensity. A classifier was trained to merge the extracted features into an overall slide assessment score. Preliminary results showed good agreement with the provided truth. The developed automated method has the potential to be used as a computer aid for the immunohistochemical evaluation of HER2 expression with the objective of increasing observer reproducibility. Keywords: microscopy imaging, immunohistochemistry, biomarker imaging, HER2/neu, computer aided analysis. 1. INTRODUCTION The HER2 biomarker (HER2/neu or erb-B2) has been identified as a valuable prognostic and predictive factor for breast cancer. HER2 is over-expressed in approximately 20% of high-grade invasive breast cancers [1] and has been associated with rapid tumor growth, increased risk of recurrence after surgery, poor response to conventional chemotherapy and shortened survival [2]. HER2 has primarily been used over the last few years to identify likely responders to trastuzumab therapy (Herceptin, Genentech, CA). Adjuvant trastuzumab has been shown in several studies [3] to reduce the risk of recurrence and mortality by one half and one third, respectively, in patients with early stage breast cancer. On the other hand, trastuzumab therapy is costly and has side effects, making it necessary to correctly identify HER2-positive breast cancer patients and at the same time avoid false classification. One of the most widely used methods for determining HER2 status is immunohistochemistry (IHC). The evaluation of HER2 with IHC involves the visual examination of cell membrane staining in paraffin-embedded tissue slides with a light microscope and overall slide classification in categories of {0, 1+, 2+, and 3+} corresponding to no staining, weak, moderate, and strong staining. According to recent guidelines [3], cases scored as 3+ are recommended for trastuzumab therapy, whereas 2+ cases are subject to further testing with fluorescent in situ hybridization (FISH). Evaluating criteria such as intensity and uniformity of staining, and estimating the percentage of stained cells is a subjective process that contributes to inter-observer variability. A recent study by Hsu et. al [4] on the evaluation of HER2 by 5
978-1-4244-2003-2/08/$25.00 ©2008 IEEE
808
observers reported complete agreement in 48% of HER-2 cases (22 out of 46). Distinguishing moderately (2+) from strongly (3+) positive results showed agreement in only 13 (59%) of 22 positive cases. The use of automated image analysis was suggested as a means of decreasing inter-and intra-observer variability in the interpretation of HER2. Even though a number of studies focused on the segmentation of cell nuclei in IHC images, very few studies have reported on automated quantitative assessment of HER2 from IHC images. Hatanaka et. al. [5] extracted a semi-quantitative score from slides using image software that provided the user with the different color spectra of an image. In the study by Ciampa et. al [6], a commercial system was used to evaluate HER2 status. In this manuscript we present an automated method for the quantitative assessment of HER2 immunohistochemical expression in breast cancer tissue specimens. The method was applied on images of the whole tissue slide to extract continuous measures of membrane staining intensity and membrane completeness, two perceptual features that pathologists use to derive their HER2 staining assessment. An algorithm merged the features to classify the slides into HER2 categories. Briefly, the main steps of the overall system are the following. First, whole slide imaging was used to digitize each case. Then, linear regression pixel classifiers were trained to distinguish between stained membrane and nuclei pixels. Nuclei pixels were further processed to form nuclei regions, morphological operators to remove small and elongated regions, and the watershed algorithm to separate overlapping cells. For each nucleus, a quantitative assessment of membrane staining intensity and completeness was extracted by modeling the cell membrane with ellipse fitting. Clustering analysis was then used to assign each case to a HER2 category. Agreement analysis was used to evaluate the performance of the system. This paper is organized as follows: In Section 2, the data used for algorithm development and evaluation is presented. The method for quantitative assessment of HER2 expression is presented in Section 3 and results and associated discussion are given in Section 4. Finally, we conclude with section 5. 2. MATERIALS 2.1. Data The dataset for algorithm development and evaluation included 77 formalin fixed, paraffin embedded breast cancer tissue slides acquired from the archives of the Department of Pathology, University of California at Irvine. The tissue was sectioned to positively charged slides and deparaffinized. Pretreatment was performed using Dako Target Retrieval Solution, pH 6 in a pressure cooker for 5 minutes. Immunoperoxidase reactions for HER2 were performed using a Dako Autostainer Plus automated immunostainer (Dako Inc., Carpinteria, CA) according to the
ISBI 2008
manufacturer's instructions. The chromogen was diaminobenzidine for all reactions. Negative controls were prepared in the same fashion, except that the primary antibody was substituted with rabbit immunoglobulin. The archived scores of each slide in categories of 1+, 2+, or 3+, resulting from manual evaluation by a surgical pathologist with experience in breast pathology, were provided for this study. The evaluation applied the grading system of the Dako Herceptest. Briefly, no staining is designated as 0 (not available in our data set), incomplete, faint membrane staining in >10% of cells in a section was designated 1+, and moderate or strong complete membrane staining in >10% of cancer cells was designated 2+ or 3+ respectively. The distribution of the slides’ scores was as follows: 26 were scored 1+, 27 were scores as 2+, and 24 were scored as 3+. The data set provided training and testing sets for algorithm design and evaluation respectively. Specifically, 13 slides were used for algorithm development and parameter optimization, and the remaining 64 slides (22 with a score of 1+, 22 with a score of 2+, and 20 with a score of 3+) were used for cross-validation performance evaluation, as will be described in Section 3.5.
from 0 for unstained/non-membranous pixels to 1 for membranous pixels showing intense staining.
2.2. Whole slide digitization and ROI selection All tissue slides were scanned using the Aperio Scanscope T2 whole slide imager (Aperio Technologies, Vista, CA). The system employed 20X objectives, an auto-focus function, and a robotic arm for feeding slides for scanning. For each of the resulting digital slides, regions of interest (ROIs) were extracted from areas of epithelial cells. Enough ROIs were extracted to cover the whole area of epithelial cells, with an average of 10 ROIs per digital slide. Each ROI image was saved in a color TIFF format with 8 bits and a size of 646 x 816 pixels.
Several color spaces served as features to describe the color content of each pixel and train the two linear regression classifiers. For this application we investigated the use of Red-Green-Blue (RGB), Hue-Saturation-Value (HSV) and CIELab (LAB) color spaces. For each training pixel, a feature vector was constructed consisting of the RGB, HSV and LAB coordinates for a total of 9 feature values. Stepwise linear regression was used to select features which contributed to a statistically significant improvement in classifier performance and to determine the weights of the classifier. By applying a threshold tmemb on the classifier output, pixels were classified as membranous or nonmembranous. The remaining non-membranous pixels were classified by the second linear classifier to distinguish between nuclei and background pixels. The second classifier used the same color features and stepwise discrimination analysis as used in the first classifier. However, due to the noisy nature of nuclei and background areas, we utilized the mean value of the 5 x 5 neighborhood around each pixel to compute the color features. Following classification, each pixel in an ROI image was identified as either a membrane, nucleus, or background pixel, and served as input to region segmentation as described below.
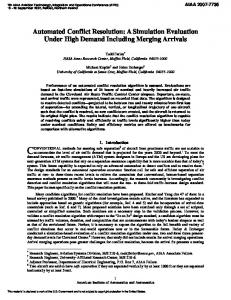
3. METHODS The automated method for the IHC assessment of HER2 consisted of a multistage algorithm that processed each ROI image. The extracted feature values describing membrane staining from all the ROIs of the same slide were averaged and served as inputs to a classifier which assigned an overall score for the whole slide. The main steps of the algorithm are depicted in Figure 1. 3.1 Color pixel classifier In the first stage of the algorithm, a color pixel classifier was trained to distinguish between three classes of pixels: epithelial cell nuclei, epithelial cell membrane, and background, which consisted of the remaining pixels. Pixel classification was performed in two steps. First, a linear regression classifier was used to extract membrane pixels in the image. A second linear regression classifier was applied on the remaining pixels in order to distinguish between nuclei and background pixels. The motivation behind the two-stage pixel classification was the fact that nuclei and background pixels had similar color properties which were distinctively different from those of the membrane pixels, making it more efficient to treat this problem as two separate binary classification tasks. A total of 468 membrane training pixels and 811 non-membranous pixels (427 nuclei and 384 background pixels) were manually selected from ROIs of the 13 training slides to reflect a wide range of membranous staining (from faint, light brown pixels to strong and intense brown colored membrane pixels), and non-membrane pixels. Training pixels were assigned a continuous score ranging
809
For each digital slide Extract ROI images
For each ROI image Color pixel classifier Epithelial nuclei segmentation Membrane staining assessment
Combine membrane feature values from all ROIs
Slide Classification
Figure 1. Block diagram of automated method for the extraction of quantitative descriptors of HER2 expression
3.2 Epithelial nuclei segmentation Following pixel classification, connected component analysis on the detected nuclei pixels was used to form nuclei regions. From the resulting regions, small areas of less than 50 pixels were removed based on the minimum area of a typical epithelial cell nucleus. The remaining regions included a number of overlapping nuclei. In order to address this problem, the marked watershed segmentation algorithm [7], was employed. The watershed algorithm groups image pixels around regional minima (or catchment basins) of an image and assigns a distinct value to each catchment basin. However, this procedure often leads to oversegmentation due to noise in the image. A solution to this problem is the marked watershed transform, where local minima of certain depth (or intensity difference from its neighbors) were used as catchment basins in order to guide segmentation. This approach
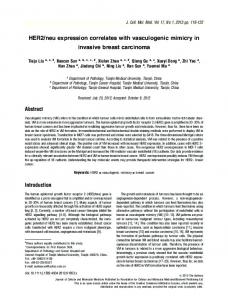
has been previously used for nuclei segmentation in FISH image analysis and described in [8]. The marked watershed algorithm was selectively applied only to structures consisting of overlapping cells. In order to identify these structures and avoid unnecessary segmentation of single nuclei, the shape of each region was analyzed prior to segmentation. Structures of overlapping cells appeared to be more irregular than single nuclei. An ellipse was adaptively fitted around each region and the overlap between the ellipse-enclosed area and the region area was used to identify structures of overlapping cells. The identified structures were subject to the procedure of marked watershed segmentation described above. As a final processing step, a hole filling operation was applied to the remaining regions. This step was necessary to correct for imperfections in pixel classification. At the end of this stage, nuclei regions were segmented and were used to assess membrane staining as described in the next section. An example of the procedure described above for nuclei segmentation is shown in Figure 2.
Figure 2. Nuclei segmentation example. From the left: Original ROI, result after pixel classification, and output following morphological operators and application of the marked watershed algorithm.
3.3 Membrane staining assessment For each nuclei region in an ROI image, the membrane pixels within a search window around the nucleus were identified and used to extract quantitative measures of HER2 staining. The search window dimensions for each nucleus were empirically selected as a rectangle with sides 1.5 x (the sides of the minimum rectangle enclosing the nucleus region). For each membrane pixel, the output of the linear regression classifier described was available, ranging from 0 for a light brown (indicating low HER2 expression) to 1 for a dark brown pixel (indicating high HER2 expression). Membrane pixels within the search window with classifier output value larger than a threshold tellipse were used to fit an ellipse enclosing them. The value of tellipse essentially defined “positive” or “stained” cells, which were further analyzed to extract staining evaluation measures. Ellipse fitting was based on minimizing the least square error between those pixels and the fitted ellipse. The value of tellipse was initially set to 1 and was reduced until enough points were available for ellipse fitting, so that pixels with the highest intensity would be included in the fit. The ellipse fit was considered proper if it overlapped the area of the nucleus and was within the search window of the nucleus. Examples of the resulting ellipse fits are shown in Figure 3 for 1+ and 3+ slides. Based on the resulting ellipses fitted around nuclei, the following two features describing membrane HER2 staining were extracted: a) Membrane completeness (or closing), defined as the percentage of ellipse pixels overlapping with membrane pixels with classifier output value larger than a threshold T1. This feature approaches 1 if the fit overlaps completely with membrane pixels of intensity larger than T1. b) Membrane average intensity, defined as the average classifier output value of ellipse pixels overlapping with membrane pixels with classifier output value larger than a
810
threshold T2. The two features provided a quantitative assessment of membrane staining intensity and degree of closing, two measures that pathologists evaluate perceptually to derive an assessment score of HER2 staining.
Figure 3. Examples of ROIs extracted from 1+ and 3+ slides (row 1, and 3 respectively). Original images are shown on the left and the result of the corresponding membrane ellipse fitting is shown on the right. Yellow ellipses indicate those ellipses fitted around available membrane pixels with tellipse