2Following a call for tenders of the CNRS .... rotation of the fragment, passing by its center of gravity or its geodesic center, then .... several positions relatively to an object model. We need a method ..... In CISST, Las Vegas, June 25â28 2001.
Automatic Classification of Archaeological Potsherds Chaouki Maiza and V´eronique Gaildrat Department of Computer Science, IRIT UPS, 118 route de Narbonne 31062 Toulouse Cedex 4, France Phone. (+33) 5 61 55 74 31 Fax. (+33) 5 61 55 62 58 E-mail:{maiza,gaildrat}@irit.fr Abstract
During archaeological excavations, one of the most time consuming stages is the treatment of the great number of pottery sherds found on the site (labelling, drawing, measuring and classifying as related to the known object models). This step is also the most difficult one because it requires an extended knowledge of the characteristics of the already identified object models that can be found on a given archaeological site. As digitalization techniques have become financially reachable, new computerized solutions to this problem can help the archaeologists. We present in this paper a matching method between a sherd and a shape model, based on one hand on the use of Implicit Surfaces to obtain a distance metric and on the other hand on Genetic Algorithms in order to find the best possible position, relatively to the previous distance measure. Keywords: Matching, Classification, Profile, Surfaces of revolutions, Genetic Algorithms, Implicit Surfaces
1
Introduction
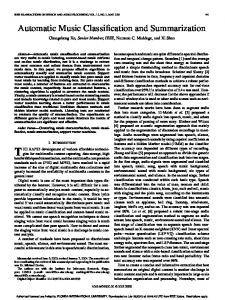
The studied ceramics are sigill´ees potteries manufactured in the sites of La Graufesenque or Montans, both situated in the South of France (Gallo-Roman province). These ceramics were made during the two first centuries of our era, in relatively standardized manner (one oven contained over 40,000 pieces)[2, 14]. These objects were obtained by molding or turning, and are assimilated to revolution shapes. A revolution object is totally defined by its axis of symmetry and its profile. The archaeologists represent all pots as in Figure 1.
Figure 1: The Drag 27 drawn with a conformateur. To the left the profile line and to the right the outside surface of the pottery, the line of separation between both sights is the axis of rotation.
During archaeological excavations, a great quantity of pottery sherds are found, as this material has been preserved and didn’t attract robbers. The archaeologists then start a long routine work. They have to label the sherds, represent them by a two dimensional drawing and take different measures (height, diameter, thickness, etc.)[15]. Then, they have to classify each sherd in order to find the shape it comes from, consulting voluminous paper catalogs which reference the identified shape models. This research stage is not documented because it is only performed from the gained
knowledge of archaeologists, thanks to their field experience. This explains why it takes from one to six hours minimum to match each fragment. In the framework of a project named SIAMA1 a collaboration2 has been initiated between the UTAH archaeologists team3 and the SIRV team4 . The goal of this project is to study the contribution of three dimensions imaging to the description, archiving and diffusion of archaeological data. Therefore the UTAH team has been equipped with a 3D scanner5 used to build up a database of entire digitalized objects. First, this database is used by the archaeologists to have a distant access to the studied objects (the 3D visualization of an object is more evocative than the two dimensional sketching that they usually have at their disposal). The objects contained in the database constitute the shape models tested during the automatic matching process of the sherds. Thus, we have at our disposal a 3D triangular mesh of each digitalized object from which we can extract some suitable shape features (axis of symmetry and profile curve) that are added to the database. The digitalization of the sherds to be matched with the shape models will allow us to obtain a geometrical characterization used during the search. The difficulty lies in the lack of information on the orientation of the fragments that have no characteristic component (a piece of rim or base, presence of grooves, etc.). For our study, we have: a nomenclature of shapes[5, 4, 12], a database of complete objects and digitalized sherds. 1 Syst` eme
d’Imagerie et d’Analyse du Mobilier Arch´eologique a call for tenders of the CNRS 3 http://www.univ-tlse2.fr/rech/equipes/utah.html 4 http://www.irit.fr/recherches/SIRV/SIRV.frame.shtml 5 KONICA-MINOLTA VI-910, http://www.minolta-3d.com/ 2 Following
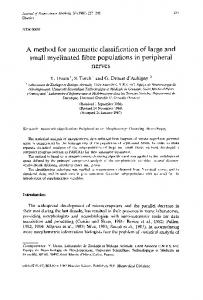
Figure 2: Displacement of a fragment with regard to a 2D model.
From this database we offer to provide the best possible match, or in most cases shape models which present the best probabilities of matching with a fragment. Our approach is based on the exploration of a solution space constituted by all the positions that a fragment can take, relatively to a tested shape model, see Figure 2. To achieve this exploration, we first need a technique to evaluate the distance between a particular position of the fragment and the tested model. Then we use genetic algorithms in order to determine an optimum position of the fragment. This search is based on the previous computation of the distance so as to evaluate the quality of the fragment’s matching. In the next part, we are going to present some methods which have been used to solve similar problems. Then in section 3, we will present and detail our approach, followed by our results in section 4. Finally, we will conclude and give future ways of research in order to improve our results in section 5.
2
State of the art
Using the computational power of computers in a discipline such as archaeology and more particularly ceramology is not a recent idea. Many projects tried these last years to
relieve the archaeologists of repetitive and fastidious tasks. The researchers were initially interested in the estimation of the principal characteristics of the potteries, namely the axis of rotation and the profile, by using either an algebraic model of the surface[26], or an approach based on the spheres of curvatures[3], even with a method inspired of the Hough transformation[27, 9], or even with a multistep optimization technique using notably Mestimators, circle and line fitting[7, 8]. Schurmans et al, extract geometrical characteristics (points or areas) from the 3D model and the profile of the studied shapes[22], so as to classify the potteries, study their uniformity and standardization[23]. They create an extensible model of a numerical library representing this classification in order to allow analysis, visualization, and diffusion of these potteries[18], using an XML6 schema. A measurement of distance based on the curvatures of the external profiles of the pots permits the search of an object in the database[6]. Sablatnig et al, use an automatic segmentation of the profiles[11] and represent the database as a graph according to a description language. Then, they carry out a classification by applying a measurement of similarity on this graph[20]. Some works take aim at the reconstruction of potteries from their fragments. A first approach associates two fragments at a time by aligning the curves of fractures[10]. An other approach uses a Bayesian method to reconstitute an entire object[24, 25]. Contrary to all those which want to conceive entirely automated systems, Melero[16] developed a semi-automatic system that uses genetic algorithms to carry out classification of potteries using rim-fragments, by mimick6 eXtentible Markup http://www.w3.org/TR/REC-xml
Language
(XML)
1.0,
ing the method of the archaeologists (orientation, diameter estimation, profile extraction, drawing of the fragment, additional measurements). Using genetic algorithms permits a flexible approach adapted to the noise produced by the digitalization of the objects. One can see that except [20] that proposes a measure of similarity on a graph in order to carry out pairings between parts of fragments, and [6] who proposes a distance based on the curvatures of the profiles without using it, there were really no works concerning this stage of “fragment - whole object” matching. This is the problem we propose a solution for in this article.
3
Our works
We are going to present the resolution method that we have chosen in order to conceive a matching tool beetween fragments and whole objects of sigill´ees potteries. We also detail the way we have implemented this model. 3.1
3D Acquisition
The studied potteries are digitalized thanks to the VI-910 of the UTAH team. They supply us with a battery of files containing the 3D triangulated meshes representing potteries and their associated profiles7 on which we will apply our matching model. 3.2
Obtaining profiles
We have seen in section 1, that the determination of the rotational axis and the profile of the pot, which is a revolution object, is sufficient to completely describe it. We have also listed automatic and semi automatic methods, 7 File formats : Wavefront OBJ, VRML, IGES ASCII, Maya ASCII et STL.
that extract those two characteristics, in section 2. For our matching tool, we also need a technique to automatically extract the representative profiles from the shape models, as well as from the fragments. 3.2.1
Profile of an object model
For the database, we fix the position and the orientation of each 3D object so as to put its base on the (x, y) plane and to align its axis of rotation with the z axis. From this, we obtain a profile by carrying out a vertical cut of the object with a plane passing through the z axis and perpendicular to the (x, y) plane. This is directly done under Maya8 . 3.2.2
Profile of a fragment
For the fragments, the major problem is to specify their orientation. This is a non trivial problem because a great number of fragments have no determining characteristics (a piece of rim or base, presence of external or interior grooves due to handling during the molding of the object before cooking, a more important quantity of material in one of the ends of the object). Most methods that we have studied, in section 2, first try to determine the axis of symmetry corresponding to a fragment in order to find its orientation, without taking account of possible specific characteristics. Then, they extract the profile curve. The results obtained by these methods show that this is not sufficient to obtain the right axis and profile. We propose an incremental approach for extracting profiles from the fragments based on the archaeologists knowledge and on the study of the previous works. This approach depends initially on the presence or not of edges, then 8 http://www.alias.com
of various determining characteristics of ceramics like grooves or thickness variation. If the fragment owns a part of the rim, we align it relatively to a plane parallel with the (x, y) one so that its axis of rotation is parallel to the z axis. We do the same for fragments which own a part of the base. Then, we carry out several vertical cuts with planes passing through the rotational axis, and we keep only the longest profile, generally considered as the most representative one9 . Then we dispose of a closed Figure 3: Multiple cutting planes. boundary that will be used in order to evaluate an estimation of the matching between the Second case: We saw that the thickness of fragment and the object models. the profile is more significant at the base of the majority of pots: one object can be classified Absence of edges on the fragments: When there as a thinned one or a thickened one according are no edges, we have to calculate an axis of to the variation of the thickness of its wall. We rotation of the fragment, passing by its center can then detect two possible orientations for of gravity or its geodesic center, then we fix a fragment by testing its thickness for various a step of rotation and generate cutting planes orientations. that will enable us to have a sampling of profiles, see Figure 3. Third case: We have no information allowing us to determine the good orientation of the fragment. First case: The fragments have grooves, eiEdge presence:
ther external on the turned pots, or interior on the molded ones. Thus, based on the curvatures of our profiles we can limit the number of possible profiles, and even find directly the good orientation of the fragment. 9 The
profile of a directed fragment is supposed to be the longest outline, parallel with the axis of rotation. The outline being the intersection of the fragment and a vertical plane passing by the axis of rotation. The profile is thus calculated as follows: • We calculate the width of the fragment and we decide the number N of intersecting planes that have to be used to estimate the profile. • We select the closest points to the plane as candidates for the profile. • We compute the distance Zmax − Zmin for each profile. • We select the longest profile.
• From the extraction of some geometrical parameters, we compute the axis of rotation of the fragment. This will enable us to orientate the sherd and extract its profile. • Finally, we seek the longest profile among the profiles obtained from the fragment. 3.3
Representation of the profiles and calculation of the “fragment - object model” distance
The profiles are extracted as B-Splines curves sampled to obtain a vector of 2D points. We can thus change the precision of our contour by varying the number of samples.
To compare the profiles, it is necessary to have a distance measure that gives the quality of matching between two profiles (one from a sherd and the other from an object model). To compute such a distance, we searched an approach enabling us to dispose of a distance field for each object model’s profile. This distance field allows us to have a pairing measure between a fragment and an object model. Then we chose to base our distance computation on works previously carried out within our team concerning implicit surfaces[1]. For each object model’s profile an implicit surface defines an associated distance field. The field generated by the implicit surface being a 3D field, in future works, this method could be extended to match fragments and object models without using the associated profile curves. Consequently, we adopt two different representations for the profiles whether they are from shape models or from fragments.
Figure 4: Entire profile → Skeleton → Implicit surface.
This technique enables us to obtain an implicit function ( f (x, y, z) ) that fits the initial profile. This function can be seen as a 3D extrapolation of the profile of a shape model. The advantage of having an implicit function is the possibility to apply the function to a point and then to deduce the position of this point relatively to the surface defined by the function: • f (p) < 0.5 if the point is outside, • f (p) = 0.5 if the point is on surface,
3.3.1
Profile of an object model
We represent the profile of a shape model by its associated implicit function. We use a technique, developed by Anca Alexe[1], which computes the implicit function representing a 3D shape, extrapolated from a 2D closed boundary. To apply this technique and obtain the implicit function that evaluates the membership of a point to the profile thus represented, three stages are necessary:
• f (p) > 0.5 if the point is inside. As said before, the implicit function defines a potential field and for a given value we obtain an iso-surface which delimits a volume. The Figure 5 shows various iso-surfaces obtained (their projection in the secant plane), relatively to the values chosen in the potential field, all around the profiles10 .
1. Make a Delauney Triangulation of the sur3.3.2 Profile of a fragment face delimited by the profile curve, 2. Extract and store the skeleton using the We keep the previous representation for fragment profiles (namely a vector of 2D points), Chordal Axis Transform[17], see Figure 6. 3. Using the skeleton, generate the corre10 Code of the colors: f(p) == 0.0 red, 0. < f(p) < 0.5 orange, 0.5 sponding implicit surface that best fits the < f(p) < 1. yellow, 1. < f(p) < 1.5 green, 1.5 < f(p) < 2. cyan, 2. < f(p) < 2.5 blue, 2.5 < f(p) magenta. profile, see Figure 4.
3.3.3
Relative positioning “fragment - object model”
To evaluate the distance between a fragment and an object model, the fragment must be positioned relatively to the object model. In section 2, we saw that the computation of the axis of rotation allows to restrict the choices of the orientation of a fragment. So the fragment is vertically orientated, but if the characteristics are not determining, the position of the top and the bottom of the fragment cannot be automatically deduced and additional tests are necessary.
Figure 5: Potential field for the profile of the digitalized object, a Drag 27.
On the other hand, the orientation of a fragment, even if it can be made in a nonambiguous way, is not enough to position it relatively to a shape model. As seen in Figure 2, a fragment can take several positions relatively to an object model. We need a method for finding the best solution (position) in this search space. Even if genetic algorithms cannot ensure that we obtain a global optimum, they have shown their efficiency in solving archaeological, and non archaeological, optimization problems. And they allow fast treatments and bring flexibility for dealing with noisy data resulting from the digitalization of archaeological objects, see [16, 19].
Figure 6: Visualization of a profile in an IGES file.
In our case, a genetic algorithm based approach allows to seek multiple positions of a fragment in order to minimize the distance criterion between this fragment and an object model. Our matching algorithm is the following:
Algorithm 1 Matching between a fragment and shape models. For the profile of a fragment for the profile of each object model do Create a population (n sherd positions) while average fitness changes OR error > min do Compute fitness of the n fragment positions. Apply operators on the population. end while end for
The genetic algorithm population is a set of chromosomes, each one representing a two dimensional point (one gene per dimension, Figure 7: Presentation of the result of the search. (x, y)). This population is initialized with individuals belonging to the skeleton of the implicit surface and other points randomly gen2. Then we test a set of points of the surface erated. delimited by the profile of the fragment. The crossover is done by exchanging the In fact, a stochastic sampling of points of genes of two chromosomes, eg: (x1, y2) and this surface is carried out in order to also (x2, y1). Mutation is also carried out on one obtain the number of points inside, outside gene only, eg: (x, y) becomes (newX, y). or on the implicit surface. These operators are used with appliance probabilities. The fitness is the distance between the proFor each of these two tests, the result is a file of the fragment in the specified position succession of three percentages. The merge of and the profile of the object model. the two results allowing us to obtain an evaluThis technique tests a great number of con- ation of the matching for the tested couples. figurations, so as to converge towards the soThe first test determines the zones where lution representing a good position. two profiles differ. The second one, compares the real overlaying of surfaces (the implicit 3.3.4 Distance “fragment - object model” surface and the surface delimited by the proThe evaluation of the “fragment - object file of the fragment). model” distance is done by using two complementary tests to obtain a quality of matching between a fragment and a complete vessel of 3.3.5 Presentation of the solution the database. 1. We test a regular sampling of points from the profile of the fragment, relatively to the implicit surface of the object model, to estimate the distribution of these points: inside, outside or on the implicit surface.
The algorithm must test a fragment with all the object models of the database and select the k best matchings. One solution is represented by an object model with the well positioned fragment, as in Figure 7.
Figure 8: The Dragendorff 27 and its associated triangular mesh.
4
Results
We have implemented a tool, called CLAPS11 , that allows us to obtain probabilities of matching between a sherd and shape models. This tool will be a part of an automatic system of classification of potsherds, whose purpose will be to simplify the archaeologists task. First of all, we have chosen to work on a pot named Dragendorff 27, see Figure 8. It was digitalized with the 3D scanner. We have extracted its profile, as explained in section 3.2.1, by carrying out a vertical cut on a location chosen by an archaeologist. We have also obtained the implicit surface and the distance field associated with this profile, using the method seen in section 3.3.1. Then, as we had no digitalized sherds, we simulated them by cutting out the profile of our Drag 27 in 3 parts (and closing the curves), see Figure 9. Then, we have implemented the two tests of section 3.3.4, namely the evaluation of the points of the profile, and of points belonging to the surface delimited by the profile, with regard to the implicit surface representing the profile of the shape model, see resulting colors in Figure 9. The last step has been the implementation 11 Automatic
CLassification of Sigill´ees Potteries
Figure 9: Our fragments and their matching score.
of the genetic algorithm that carries out the search of a good positioning of a fragment compared to the object models. We have then run CLAPS for each fragment several times (about 60). The table 1 gives the results of the locations with a population of 100 individuals. The crossover probability was fixed at 0.8 and the mutation probability at 0.1. The given error, in millimeters, is the distance from the best position found. The dimensions of the entire profile are: 4.5cm for the width and 4cm for the height. Sherd High Low Central
Good 30% 60% 60%
Means 60% (er < 2) 40% (er < 0.5) 40% (er < 0.5)
False 10% (er > 4.5)
jects, show a certain feasibility. We thus work with the archeologists team to continue the development our database. The digitalization of twenty other pots has been done by the UTAH team. We face some problems of lack of precision of the archaeological objects, due to the data’s noise. Figure 10 shows a test that we have carried out to evaluate the relevance of our choice of a profile on the Drag 27. As we see, the profiles differ a lot. This indeed confirms the fact that the stage of extraction of the profile is crucial and a bad choice can make a good fragment positioning impossible.
Table 1: Some results of location search.
We see that for the Low and the Central fragments the 40% of “means” solutions are only 0.5 millimeters far from the best (ideal) position on an object of 40 millimeters height. The error equals then 1%, so, results could always be considered as good matchings for these two fragments. For the high fragment, 90% of the results are good ones with an error smaller than 6% (< 2.5 millimeters). This profile gives the worst results because of its shape (long and thin) compared to the Central profile (thick) and to the Low profile (complex shape). This leads the high profile to have a high matching score even in a bad position.
5
Conclusion and perspectives
We have shown in this paper a rather original approach allowing to carry out an automatic matching between potsherds and shape models. Our current results, with few digitalized ob- Figure 10: Presence of noise in the triangulated meshes.
The technique of distance computation integrated in our approach is still currently empirical, because of the use of implicit surfaces that give a pseudo distance field. We are now working on more robust distance measures to achieve our matchings. We have chosen the genetic algorithms to perform the search, because they have already been used in our team to solve optimization problems (notably object layout[21]) and have shown good results when a solution has to be found in a huge search space. As the search space in our current problem is also a huge one (the size of the data base of object models is led to quickly grow), we also study other methods like Meta-Heuristics that are able to manage complex problems[13]. The goal of our first approach was to show a certain feasibility. Now we must improve our tool and for that we have to implement other search techniques, more precise and reliable.
References [1] A. Alexe, V. Gaildrat, and L. Barthe. Interactive modelling from sketches using spherical implicit functions. In AFRIGRAPH ’04: Proceedings of the 3rd international conference on Computer graphics, virtual reality, visualisation and interaction in Africa, pages 25– 34. ACM Press, 2004. [2] C. B´emont and J.-P. Jacob. La terre sigill´ee gallo-romaine: Lieux de production du Haut Empire: implantations, produits, relations. Documents d’Arch´eologie Franc¸aise, 6, Paris, 1986.
Conference, Crete, Greece, June 26 wednesday 2002. [4] J. D´echelette. Les vases c´eramiques orn´es de la Gaule romaine, volume 2. Paris : Picard et fils, 1904. [5] H. Dragendorff. Terra Sigillata, ein Beitrag zur Geschichte der grieschischen und r¨omischen keramik. Number 96. Bonner Jahrb¨ucher, 1895. [6] J.C. Femiani, A. Razdan, and G. Farin. Curve shapes: Comparison and alignment. submitted to TPAMI, November 2004. [7] R. Hal´ıˇr. An automatic estimation of the axis of rotation of fragments of archaeological pottery: A multi-step modelbased approach. In V. Skala, editor, Proc. of the 7th International Conference in Central Europe on Computer Graphics, Visualization and Interactive Digital Media (WSCG’99), 1999. [8] R. Hal´ıˇr and J. Flusser. Estimation of profiles of sherds of archaeological pottery. In T. Pajdla, editor, Proc. of Czech Pattern Recognition Workshop ’97, pages 126–130, Praha, Czech Republic, February 1997. Czech Pattern Recognition Society. www.utia.cas.cz/library/prace/970209.ps. [9] M. Kampel and R. Sablatnig. An automated pottery archival and reconstruction system. Journal of Visualization and Computer Animation, 14(3):111–120, July 2003. www3.interscience.wiley.com/cgibin/jissue/104540298.
[3] Y. Cao and D. Mumford. Geometric structure estimation of axially symmetric pots from small fragments. In Signal Processing, Pattern Recognition, [10] M. Kampel and R. Sablatnig. 3d puzzling and Applications, IASTED International of archeological fragments. In Danijel
Skocaj, editor, Proc. of 9th Computer Vision Winter Workshop, pages 31–40, Piran, Slovenia, 2004. Slovenian Pattern Recognition Society.
D. Arnold, A. Chalmers, editor, 4th International Symposium on Virtual Reality, Archaeology and Intelligent Cultural Heritage, VAST’03, November 5-7 2003.
[11] M. Kampel, R. Sablatnig, and E. Costa. [17] L. Prasad. Morphological analysis of shapes. CNLS Newsletter, 139: 1–18, Classification of archaeological fragJuly 1997. ments using profile primitives. In Stefan Scherer, editor, Computer Vision, Com- [18] A. Razdan, D. Liu, M. Bae, M. Zhu, puter Graphics and Photogrammetry G. Farin, A. Simon, and M. Henderson. A Common Viewpoint, Proc. of the 25th Using geometric modeling for archiving Workshop of the Austrian Association for and searching 3d archaeological vessels. ¨ Pattern Recognition (OAGM), volume In CISST, Las Vegas, June 25–28 2001. 147 of Schriftenreihe der OCG, pages 151–158, Oldenburg, Wien, M¨unchen, [19] C. Reynoso and E. Jezierski. Genetic algorithm solver for archaeology. In 29th 2001. Conference of CAA: Pushing the Envelope. BAR International Series no. 1016, [12] R. Knorr. T¨opfer und Fabriken verzierter 2001. Terra Sigillata des ersten Jahrhnderts. Stuttgart, 1919. [20] R. Sablatnig and C. Menard. 3d reconstruction of archaeological pottery using [13] M. Larive, O. Le Roux, and V. Gaildrat. profile primitives. In N. Sarris and M.G. Using meta-heuristics for constraintStrintzis, editors, Proc. of Intl. Workshop based 3d objects layout. In Dimitri on Synthetic-Natural Hybrid Coding and Pl´em´enos, editor, The Seventh InternaThree-Dimensional Imaging, pages 93– tional Conference on Computer Graph96, Rhodes, Greece, September 1997. ics and Artificial Intelligence, 3IA’2004, MSI Laboratory, Facult´e des sciences, [21] S. Sanchez, O. Le Roux, H. Luga, and V. Gaildrat. Constraint-based 3d-object Limoges, France, May 12-13 2004. layout using a genetic algorithm. In Dim[14] T. Martin. C´eramiques Sigill´ees et itri Pl´em´enos, editor, The Sixth InternaPotiers Gallo-Romains de Montans. tional Conference on Computer Graphe´ dition Arch´eosite, 1996. ics and Artificial Intelligence, 3IA’2003, MSI Laboratory, Facult´e des sciences, [15] M.-T. Marty and M.-L Maraval. Manuel Limoges, France, May 14-15 2003. pour les m´ethodes de fouille et mode d’enregistrement des donn´ees. Unit´e [22] U. Schurmans, A. Razdan, A. Simon, P. McCartney, M. Marzke, D. Van Alfen, Toulousaine d’Arch´eologie et d’histoire, G. Jones, J. Rowe, G. Farin, D. Collins, UTAH, Universit´e Toulouse-Le Mirail, M. Zhu, D. Liu, M. Bae, T. Tasdizen, 1998-2004. Chantier-´ecole de Coup´er´e. J. Tarel, and D. Cooper. Advances in geometric modeling and feature extrac[16] F.J. Melero, J.C. Torres, and A. Leon. tion on pots, rocks and bones for repreOn the interactive 3d reconstruction sentation and query via the internet. In of iberian vessels. In F. Niccolucci
Proc. of the 28th Computer Applications and Quantitative Methods in Archaeology, CAA’01, April 25 - 29 2001. [23] A. Simon. Advances in 3d knowledge and ceramic vessel morphology. Technical report, PRISM / Archaeological Research Institute, October 01 2002. [24] A. Willis and D. Cooper. Alignment of multiple non-overlapping axially symmetric 3d datasets. In ICPR, volume IV, pages pp. 96–99, August 2004. [25] A. Willis and D. Cooper. Bayesian assembly of 3d axially symmetric shapes from fragments. In CVPR, volume I, pages pp. 82–89, June 2004. [26] A. Willis, X. Orriols, and D. Cooper. Accurately estimating sherd 3d surface geometry with application to pot reconstruction. In CVPR Workshop : ACVA, June 2003. [27] S.B. Yacoub and C. Menard. Robust axis determination for rotational symmetric objects out of range data. In W. Burger and eds M. Burge, editors, 21th Workshop of the Oeagm, pages 197–202, Hallstatt, Austria, May 1997.