Itzamá López Yáñez*, Rolando Flores Carapia, Cornelio Yáñez Márquez,. Oscar Camacho Nieto ... Keywords: Cranial fractures, radiographic images, pattern.
Rev. Fac. Ing. Univ. Antioquia N.° 61 pp. 29-40. Diciembre, 2011
Automatic detection of cranial fractures in radiological images using a pattern classifier Detección automática de fracturas craneales en imágenes radiográficas usando un clasificador de patrones Itzamá López Yáñez*, Rolando Flores Carapia, Cornelio Yáñez Márquez, Oscar Camacho Nieto Instituto Politécnico Nacional (IPN) Centro de Investigación en Computación (CIC). Av. Juan de Dios Bátiz s/n casi esq. Miguel Othón de Mendizábal, Unidad Profesional “Adolfo López Mateos”, Edificio CIC. Col. Nueva Industrial Vallejo, C. P. 07738, México, D.F. México. (Recibido el 1 de marzo de 2011. Aceptado el 14 de julio de 2011) Abstract In this work, an automatic pattern classification system is presented, whose goal is detecting the presence or absence of fractures in cranial radiographic images. The basis for the proposal is an original coding technique, coupled with an emerging pattern classifier: the Gamma classifier. This proposal draws concepts from three areas of current scientific research: Mathematical Morphology, image histograms, and Alpha-Beta associative models. Also, an experimental study is presented, comparing the performance shown by the system to that exhibited by other pattern classifiers present in current scientific literature. The results obtained are competitive, reaching 94.23% of correct classification. ----- Keywords: Cranial fractures, radiographic images, pattern classification, alpha-beta associative models Resumen En este trabajo se presenta un sistema automático de clasificación de patrones, cuyo propósito es detectar la presencia o ausencia de fracturas en imágenes radiografías craneales. La propuesta se basa en una técnica original de codificación de patrones acoplada a un clasificador de patrones emergente: el clasificador Gamma. Esta propuesta toma conceptos de tres áreas de investigación científica: la Morfología Matemática, los histogramas Autor de correspondencia: teléfono: +52 + 555 + 729 60 00-56584, fax: +52 + 555 + 729 60 00-56607, correo electrónico: ilopezy@ipn. mx; (I. López)
*
29
Rev. Fac. Ing. Univ. Antioquia N.° 61. Diciembre 2011
de imágenes y los modelos asociativos Alfa-Beta. Asimismo, se presenta un estudio experimental en el que se compara el desempeño mostrado por el sistema con el que exhiben otros clasificadores de patrones presentes en la literatura científica actual. Los resultados obtenidos son competitivos, alcanzando 94,23% de clasificación correcta. ----- Palabras clave: Fracturas craneales, imágenes radiográficas, clasificación de patrones, modelos asociativos alfa-beta
Introduction The last decades have seen an impressive rise in the number of emerging instruments, means and techniques used to detect, store, analyze, and visualize medical images. This has positioned computational methods related to digital images processing and pattern recognition as important tools to support and enhance the activities of medical specialists. However, in order to achieve systems which are both effective and efficient, a close collaboration between medics, scientists, and engineers is needed [1]. Nonetheless, for the particular case of cranial images, such interdisciplinary research have not been very extensive and, therefore, publications relating aspects of image processing to engineering applications on cranial fracture images are somewhat scarce [2-7]. One of the computational techniques which has been repeatedly applied on the field of medical image processing is Mathematical Morphology [8,9]. On the other hand, some research groups working on Computer Sciences have turned their attention to associative memories, using such models on tasks related to the theory of pattern recognition and its applications [10-24]. In this sense, the basic goal of an associative memory is to correctly recall whole patterns starting from input patterns, which may have been modified by some kind of alteration [10,11]. Since the beginnings of the 1960s to the present day, the development of associative memories has gone through such influential models as: the first known model of associative memory (proposed in 1961 by the German scientist Karl Steinbuch), the Lernmatrix [12]; and the Linear
30
Associator, which is the generic name by which two classic models published independently in 1972 by Anderson [13] and Kohonen [14] are known today. Later, the Morphological associative memories [89, 15] served as inspiration for the creation of the Alpha-Beta associative memories [16]. The latter has been the basis for the birth of several new models and algorithms [17-24], setting even the foundation for the emergence of a new approach to Pattern Recognition: the Associative Approach. In the current paper, a relevant application of Alpha-Beta associative models to pattern classification on cranial radiographic images is presented. The rest of the paper is organized as follows: first comes the presentation of the dataset of radiographic images used, with the description of the concepts drawn from Mathematical Morphology, image histograms, and the Alfa-Beta associative models after that. Then, the proposed system, on one hand, and the experiments done and the obtained results on the other, are discussed, while the conclusions and future work are presented later, and finally the references are included. Cranial fracture radiographic images database The dataset of cranial radiographic images is made up by 52 images and was provided by the University of Hawaii [25]. Out of the 52 images, 27 show fractures while 25 are free of fractures. These images are approximately 300 by 300 pixels of size, in JPEG format, including several images using the four usual standard views: anteroposterior, Towne, and both lateral views.
Automatic detection of cranial fractures in radiological images using a pattern classifier
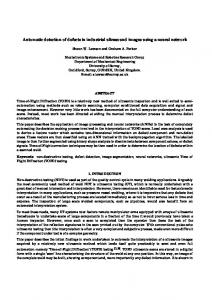
Some examples of radiographic images without fracture are shown in figure 1, while examples of images with fracture can be seen in figure 2.
Figure 2 Cranial radiographic images with fracture Mathematical morphology Mathematical Morphology (MM) is a framework based on set theory, which has been successfully applied in digital image processing. The theoretical foundation of MM comes from two set operations named after Hermann Minkowsky (addition and subtraction), through which its two basic operators are defined: dilation and erosion [8,9].
Figure 1 Cranial radiographic images without fracture
Dilation can be stated in a simplified, intuitionist manner, as adding pixels to an image, or enlarging it. On the other hand, erosion can be stated in a similar manner as taking pixels away from an image, or shrinking it. An example of dilation can be seen in figure 3, where the image on the left is dilated by the image in the middle (which is known as the structuring element and contains the origin, as indicated by the white “X”), obtaining the image on the right. Similarly, an example of erosion is shown in figure 4.
31
Rev. Fac. Ing. Univ. Antioquia N.° 61. Diciembre 2011
assigned a point on the X axis of a bidimensional plane, and the number of pixels having that value will be its corresponding point on the Y axis.
Figure 3 Dilation of binary image on the left (set O), by the structuring element in the middle (set S, corresponding to the von Neumann neighborhood), obtaining the image on the right
Figure 4 Erosion of binary image on the left (set O), by the structuring element in the middle (set S), obtaining the image on the right More formally, the dilation operation can be defined as the Minkowsky addition of sets O (the image) and S (the structuring element), and is computed as follows:
O ⊕ S = {o + s o ∈ O and s ∈ S }
(1)
On the other hand, the erosion operation is defined as the Minkowsky subtraction of set O by set S, and is calculated using this equation:
{
}
2 O S = x ∈ x + s ∈ O for each s ∈ S (2)
Image histograms The histogram of an image is a graphical representation of the distribution of pixel values through the image. In a sense, the histogram indicates the probability of finding a given value in one pixel of the image [26]. In order to build the histogram, each possible value a pixel can take is
32
Thus, the histogram of a grayscale image (which has 256 levels of gray) will be represented by a bar chart with 256 points on the X axis (0 to 255), and the number of pixels having each value as its corresponding point on the Y axis. For a color image (usually represented using the RGB format), a different histogram is drawn for each color plane (i.e. one histogram for the red plane, another for the green plane, and another for the blue plane). The histogram provides a description of the general appearance of the image: if the gray levels are concentrated towards the low-value extreme of the range, the global appearance of the image is dark (figure 5a), while if the gray levels are concentrated in the high-value end of the range, the global appearance is light (see figure 5b). On the other hand, a histogram with a few values having large frequencies (narrow profile) indicates an image with low contrast (figure 5a), while an histogram with present values dispersed throughout the whole range indicate a high contrast image (figure 5c). Alpha–Beta associative models For the proposed system, the Gamma classifier is used, since it has shown promising results [21,23]. The basis of the Gamma classifier is the generalized gamma operator, which is based on the alpha (a), beta (b), and ub operators and their properties, in particular when dealing with binary vectors coded with the modified Johnson-Möbius code. Then, these components of the Gamma classifier (the alpha and beta operators, the ub operator, the modified Johnson-Möbius code, the gamma operator) will be discussed, and later the algorithm for the classifier is presented [21,23].
Preliminaries The alpha and beta operators were introduced in [16-18] and are the basis of the Alpha-
Automatic detection of cranial fractures in radiological images using a pattern classifier
Beta associative memories. The operators are defined in a tabular manner, as shown in table 1,
considering that the sets A and B are defined as A = {0, 1} and B = {0, 1, 2}.
a) histogram of a dark, low contrast image
b) histogram of a light image
c) histogram of a high contrast image Figure 5 Examples of image histograms (taken from [26]): a) dark, low contrast image; b) light image; c) high contrast image These operators have set the foundation for the development of several mathematical models employed in Pattern Recognition, such as the original Alpha-Beta associative memories
[16], the Alpha-Beta bidirectional associative memories [17,18], the Gamma classifier [2123], or the Alpha-Beta associative support vector machines [24].
33
Rev. Fac. Ing. Univ. Antioquia N.° 61. Diciembre 2011
Table 1 Definition of the alpha and beta operators α : A× A → B
negative integer number q; and gives a binary number as output; can be calculated as follows:
β : B× A→ A 1
g g ( x, y , θ ) =
if m − uβ α ( x, y ) mod 2 ≤ θ (4) otherwise
x
y
a(x, y)
x
y
b(x, y)
0
0
1
0
0
0
0
1
0
0
1
0
1
0
2
1
0
0
1
1
1
1
1
1
The Gamma classifier algorithm
2
0
1
2
1
1
Let k , m, n, p ∈ + ; x µ µ = 1, 2, , p be the fundamental pattern set with cardinality p, where ∀µ x µ ∈ n , and let y ∈ n be an n-dimensional real-valued pattern to be classified. It is assumed that the fundamental set is partitioned into m different, mutually exclusive classes, each class having a cardinality ki, i = 1, 2, , m , and thus ki = p . In order to classify y, these steps are followed:
where mod 2 indicates the usual modulo 2 operator.
{
Regarding the unary ub operator, it receives as input an n-dimensional binary vector x, outputs a non-negative integer number, and is calculated as shown below: n
uβ ( x ) = ∑ β ( xi , xi )
(3)
i =1
On the other hand, the modified Johnson-Möbius code —which is a modification to the classical Johnson-Möbius code and was proposed by the authors research group— allows us to convert a set of real numbers into binary representations by following these steps: 1. Subtract the minimum (of the set of numbers) from each number, leaving only non-negative real numbers. 2. Scale up the numbers (truncating the remaining decimals if necessary) by multiplying all numbers by an appropriate power of 10, leaving only non-negative integer numbers. 3. Concatenate em–ej zeros with ej ones, where em is the greatest non-negative integer number to be coded, and ej is the current non-negative integer number to be coded. Finally, the generalized gamma operator gg, which takes as input two binary patterns x ∈Am and y ∈Am —with n, m ∈ + , n ≤ m — and a non-
34
0
}
∑
1. Code the fundamental set with the modified Johnson-Möbius code, obtaining a value em for each component. This em value is calculated as defined in the following equation: p
em ( j ) = ∨xij
(5)
i =1
where ∨ represents the usual maximum operator. That is, em is the maximum value across all fundamental patterns, considering only their j-th component. 2. Compute the stop parameter, as expressed below, n
ρ = ∧em ( j )
(6)
j =1
where ∧ represents the usual minimum operator.
3. Code y with the modified Johnson-Möbius code, using the same parameters used with the fundamental set (step 1). If any yj is
Automatic detection of cranial fractures in radiological images using a pattern classifier
greater than the corresponding em(j), the gg operator will use such yj instead of m. 4. Transform the index of all fundamental patterns into two indices: one for their class, and another for their position in the class (i.e. xm assigned to class i becomes xiω). 5. Initialize q to 0.
(
)
6. Do g g x j , y j , θ for each component of the fundamental patterns in each class (equation 4). iω
7. Compute a weighted addition ci for each class, according to this equation:
∑ ∑ = ω ki
ci
=1
n j =1
g g ( xijω , y j , θ )
(7)
ki
8. If there is more than one maximum among the different ci, increment q by 1 and repeat steps 6 and 7 until there is a unique maximum, or the stop condition θ≥ρ is fulfilled. 9. If there is a unique maximum, assign y to the class corresponding to such maximum: m
C y = C j such that ∨ci = c j i =1
Meanwhile, the classification phase consists of computing g g xijω , y j , θ between each fundamental pattern and the test pattern, for each component. Then, a weighted addition is performed, adding all results corresponding to the same class. The weight part corresponds to the division of the addition by the class cardinality, thus normalizing unbalanced classes.
(
)
When there is a unique maximum among the weighted additions for all classes, that class is assigned to the test pattern. In case of a tie, q is incremented and the algorithm is repeated from step 6, for as many times as required to break the tie or reach the stop condition. If the stop condition θ ≥ ρ is met, the test pattern is assigned the first class with a maximum. The Gamma classifier has been applied to several different problems: classification of the Iris Plant database, localization of mobile stations, software development effort estimation of small programs, and environmental data prediction [21-23]. In these problems, some quite different from each other —and even some for which the basic premises of the classifier do not hold— the Gamma classifier has shown competitive experimental results.
(8)
10. Otherwise, assign y to the class of the first maximum. The first five steps in the former algorithm can be seen as the learning phase of the classifier, while steps 6 to 10 (including any iteration if present) can be considered the classification phase. Thus, the learning phase consists of coding all patterns (from both the fundamental and test sets) with the modified Johnson-Möbius code, using the same parameters. Also, the index of the fundamental patterns is converted into two indices, in order to identify the class to which each fundamental pattern belongs with the first of these indices. Finally, the stop parameter r is computed and q is initialized to 0.
The proposed system Our proposal is divided in two stages: during the first one, patterns are extracted and coded from input images, while the second stage is where the pattern recognition is done. Below are the descriptions of both stages. Stage 1: Pattern Codification The algorithm for extracting and coding the patterns is as follows: 1. Begin with a grayscale image. 2. Negate the image. By doing this, most of the pixels containing information of interest have low values in grayscale. 3. Assign a value of 0 to the two most significant bits and to the two least significant bits of
35
Rev. Fac. Ing. Univ. Antioquia N.° 61. Diciembre 2011
the grayscale value of each pixel. With this, the higher values are ignored (since they contain little information of interest and may even introduce unwanted noise), and several remaining values are grouped together (thus diminishing the actual resolution of the available information to only 16 possible values). 4. Obtain the erosion of (3) with the structuring element of the von Neumann neighborhood of 3 × 3 pixels (figure 3). The effect: dark pixels get strengthened. 5. Obtain the dilation of (3) with the structuring element of the von Neumann neighborhood of 3 × 3 pixels (figure 3). The effect: light pixels get strengthened. 6. Obtain the histograms of both (4) and (5), which represent a better contrast than if (3) was used directly. 7. Normalize both histograms of (6) to 256, with respect to the maximum frequency found in each histogram. 8. Obtain the binary representation of each of the 16 values in each histogram, using the modified Johnson-Möbius code. 9. Concatenate the 16 binary vectors which code the histogram of (4) with the 16 binary vectors for the histogram of (5), obtaining the pattern x representing the image. Thanks to step 3, the histograms obtained in step 6 have only 16 values each. But the histogram values were normalized to 256 in step 7, thus step 8 outputs 32 binary vectors which are 256 bits long. Then, the binary pattern obtained after step 9 has 32 × 256 = 8192 binary components. Stage 2: Pattern Classification This stage, dedicated to training and operating the Gamma classifier with the patterns obtained from stage 1, is in time divided into two phases: learning and classification phases. For this stage, it is assumed that the classifier has a fundamental
36
set of images from which to learn, and a test set of images (which may be comprised of only one) to be classified. The algorithm for the learning phase is as shown here: 1. Code each of the images in the fundamental set using the algorithm of stage 1, obtaining p fundamental patterns xm. 2. Build the fundamental set of patterns x µ µ = 1, 2, , p , where the class to which each pattern belongs is known.
{
}
3. Train the Gamma classifier with the fundamental set. Notice that some of the steps in the algorithm of the classifier have already been taken care of in the algorithm of stage 1, so they do not need to be done again. On the other hand, the algorithm for the classification phase of the proposed system is shown below. If the test set is composed of more than one image, the algorithm is repeated for each image. 1. Code the test image using the algorithm of stage 1, obtaining the test pattern y. 2. Present the test pattern y to the Gamma classifier, obtaining its class. Some steps in the algorithm of the classifier can be skipped since they have already been done in stage 1. The general architecture of the proposed method can be seen in figure 6.
Figure 6 General architecture of the proposed method
Experimental results For the experiments, two validation techniques were used: Hold-Out and Leave-One-Out [27], assuming that each image has already been
Automatic detection of cranial fractures in radiological images using a pattern classifier
assigned to one of two classes (Fracture Present and Fracture Absent). In the case of Hold-Out, these steps were followed: 1. Define a percentage combination to partition the full dataset into a fundamental and test sets; a usual combination is 70% for the fundamental and 30% for the test set. 2. Both fundamental and test images are selected randomly. 3. The proposed system is operated with the fundamental and test sets. 4. The percentage of accurate classification is calculated. On the other hand, the technique of Leave-OneOut consists of the following steps: 1. The test set is made up by the first image, while the fundamental set contains the rest of the images in the dataset. Thus, for the current dataset the fundamental set has a cardinality of 51, and the test set has only one image. 2. Operate the proposed system with these fundamental and test sets. 3. Record whether the test pattern was correctly classified or not. 4. Repeat steps 1 thru 3 for each image in the full dataset, for a total of 52 experiments. 5. Calculate the percentage of images which were accurately classified. Figure 7 Shows how the fundamental and test sets are built with both of these techniques. Given that the scarcity of publications related to this particular problem, the authors were unable to find another published result based on the same dataset to compare against. Thus, a well known classifier was implemented and tested on the same dataset of cranial radiographic images: the k-Nearest Neighbor (k-NN) classifier [28,29] (with k = 1). Also, the WEKA [30] platform was used, running several experiments with different methods, from which only the best results were taken. These results are shown in table 2.
As can be seen, the k-NN did well: it has the highest results of the known methods. From the rest, KStar has the best percentage of correct classification on Hold-Out, with 15 /26 = 57.69%, and Classification Via Clustering (using KMeans to form the clusters) offers the best performance with on Leave-One-Out with 36 / 52 = 69.23%. Meanwhile, the proposed method clearly surpasses all these methods: it only made 4 mistakes on Hold-Out for a correct classification of 24 / 26 = 92.31%, and 3 mistakes on leaveOne-Out for a performance of 49 / 52 = 94.23%.
Conclusions and future work In this work, a pattern classifier is applied to automatically detect the presence or absence of cranial fractures in radiographic images, taken from a database provided by the University of Hawaii. The proposed method uses an original coding technique to convert grayscale images into numeric patterns, which are then classified by the Gamma classifier into the two categories considered: Fracture Present and Fracture Absent. For this particular task, the proposed method exhibits a competitive performance, surpassing several classification methods: the k-Nearest Neighbor algorithm, as well as KStar and Classification Via Clustering (using KMeans), among others. However, the proposed system is not limited to working only with this kind of medical images: it can be applied to grayscale images of different domains. In particular, the present work may be used to detect fractures on radiographic images of other body parts, such as the tibia, fibula, femur, radius, ulna, coccyx, foot and hand bones, as well as parts of the thorax and vertebral column [1, 25, 31,32]. Another future avenue of research is the extension of this method, in particular regarding the coding technique, to enable its application on color images.
37
Rev. Fac. Ing. Univ. Antioquia N.° 61. Diciembre 2011
a) full dataset
b) fundamental set using Hold-Out (taken randomly from the full data set; the 16 images left belong to the test set)
c) fundamental set using Leave-One-Out (for iteration 1, Image 1 is the test set; for the i-th iteration, the i-th image is the test set) Figure 7 Partitioning of the (a) full dataset into fundamental and tests set, using (b) Hold-Out and (c) LeaveOne-Out
38
Automatic detection of cranial fractures in radiological images using a pattern classifier
Table 2 Experimental results (correct classification percentage) Method
Hold-Out
Leave-One-Out
BayesNet [30]
46.15
57.69
DecisionStump [30]
53.85
61.54
PART [30]
53.85
61.54
RandomForest [30]
53.85
61.54
SMO [30]
53.85
61.54
KStar [30]
57.69
65.38
Dagging [30]
50.00
65.38
5.
J. K. Wong, B. Blenkinsop, D. Chiasson, R. E. Wood. “A simple means of demonstrating skull fractures using radiographic altered image geometry”. Journal of Forensic Odonto-Stomatology. Vol. 15. 1997. pp. 17-21.
6.
K.Y. C. Goh, A. Ahuja, S. B. Walkden, W. S. Poon. “Is routine computed tomographic (CT) scanning necessary in suspected basal skull fractures”. Injury. Vol. 28. 1997. pp. 353-357.
7.
R. E. Wood, R. Blend, S. E. Brooks, B. Blenkinsop. “Use of computer assisted tomography for woundweapon comparison of lethal skull fractures”. Journal of the Canadian Society of Forensic Science. Vol. 29. 1996. pp. 49-55.
8.
J. Serra. Image Analysis and Mathematical Morphology. Vol. I. Ed. Academic Press. London. 1982. pp. 610.
9.
Classification Via Clustering [30]
53.85
69.23
J. L. Díaz De León, C. Yáñez Márquez. Introducción a la morfología matemática de conjuntos. Serie Ciencia de la Computación. Fondo de Cultura Económica. México. 2003. pp. 79-152.
k-Nearest Neighbor [28-29]
80.77 (61.54)
82.69
10. M. H. Hassoun. Associative Neural Memories. Ed. Oxford University Press. New York. 1993. pp. 3-30.
Proposed method
92.31
94.23
11. T. Kohonen. Self-Organization and Associative Memory. Ed. Springer-Verlag. Berlin. 1989. pp. 233248.
Acknowledgements The authors would like to thank the Instituto Politécnico Nacional (Secretaría Académica, COFAA, SIP, and CIC), the CONACyT, SNI, and the ICyTDF (grants PIUTE10-77 and PICSO10-85) for their economical support to develop this work.
References 1.
A. Meyer-Baese. Pattern Recognition in Medical Imaging. Ed. Academic Press. 2003. pp. 8-57.
2.
V. VandeVyver, M. Lemmerling, K. Verstraete. “Multiple growing skull fractures”. Journal Belge de Radiologie. Vol. 90. 2007. pp. 52.
3.
A. Taha, Y. C. Gan, S. V. Chavda, J. Wasserberg. “A review of base of skull fractures”. Trauma. Vol. 9. 2007. pp. 29-37.
4.
R. Ramaswamy, D. Macarthur, B. D. White. “Vascular threat in base of skull fractures”. British Journal of Neurosurgery. Vol. 18. 2004. pp. 197-198.
12. K. Steinbuch. “Die Lernmatrix”. Kybernetik. Vol. 1. 1961. pp. 36-45. 13. J. A. Anderson. “A simple neural network generating an interactive memory”. Mathematical Biosciences. Vol. 14. 1972. pp. 197-220. 14. T. Kohonen. “Correlation matrix memories”. IEEE Transactions on Computers. Vol. 4. 1972. pp. 353-359. 15. G. X. Ritter, P. Sussner, J. L. Diaz-de-Leon. “Morphological associative memories”. IEEE Transactions on Neural Networks. Vol. 9. 1998. pp. 281-293. 16. C. Yáñez Márquez. Memorias Asociativas basadas en Relaciones de Orden y Operadores Binarios. Tesis de Doctorado. Instituto Politécnico Nacional. Centro de Investigación en Computación, México. 2002. pp. 5362. 17. M. E. Acevedo Mosqueda. Memorias Asociativas Bidireccionales Alfa-Beta. Tesis de Doctorado. Instituto Politécnico Nacional. Centro de Investigación en Computación. México. 2006. pp. 35-89.
39
Rev. Fac. Ing. Univ. Antioquia N.° 61. Diciembre 2011
18. M. E. Acevedo Mosqueda, C. Yáñez Márquez, I. López Yáñez. “Alpha-Beta Bidirectional Associative Memories: Theory and Applications”. Neural Processing Letters. Vol. 26. 2007. pp. 1-40. 19. R. Flores Carapia. Memorias asociativas Alfa-Beta basadas en el código Johnson-Möbius modificado. Tesis de Maestría. Instituto Politécnico Nacional. Centro de Investigación en Computación. México. 2006. pp. 45-61.
24. L. O. López-Leyva, C. Yáñez-Márquez, R. FloresCarapia, O. Camacho-Nieto. “Handwritten Digit Classification Based on Alpha-Beta Associative Model”. Lecture Notes in Computer Science. Ed. Springer-Verlag. Berlin Heidelberg. 2008. pp. 437-444. 25. L. G. Yamamoto, R. M. Di Mauro, A. S. Inaba. Radiology Cases in Pediatric Emergency Medicine. Vol. 5. Ed. Kapiolani Medical Center, University of Hawaii, Honolulu, Hawaii, USA. 1999. pp. 1-52.
20. C. Yáñez-Márquez, E. M. Felipe-Riverón, I. LópezYáñez, R. Flores-Carapia. “A Novel Approach to Automatic Color Matching”. Lecture Notes in Computer Science. Ed. Springer-Verlag .Berlin Heidelberg. 2006. pp. 529-538.
26. R. C. Gonzalez, R. E. Woods. Digital Image Processing. Ed. Prentice Hall. New Jersey. USA. 2002. pp. 88-103.
21. I. López Yáñez. Clasificador Automático de Alto Desempeño. Tesis de Maestría. Instituto Politécnico Nacional. Centro de Investigación en Computación. México. 2007. pp. 18-41.
28. T. M. Cover, P. E. Hart. “Nearest Pattern Classification”. IEEE Trans. on Information Theory. Vol. 13. 1967. pp. 21-27.
22. C. Yáñez-Márquez, I. López-Yáñez, G. dela L. SáenzMorales. “Analysis and Prediction of Air Quality Data with the Gamma Classifier”. Lecture Notes in Computer Science. Ed. Springer-Verlag. Berlin Heidelberg. 2008. pp. 651-658. 23. I. López-Yáñez, C. Yáñez -Márquez, V. M. SilvaGarcía. “Forecasting Air Quality Data with the Gamma Classifier”. Pattern Recognition. Y. Peng-Yeng (editor). INTECH. Croatia. 2009. pp. 499-512. Available from: http://sciyo.com/articles/show/title/forecasting-airquality-data-with-the-gamma-classifier Consultado el 20 de febrero de 2011.
40
27. A. R. Webb. Statistical Pattern Recognition. 2nd. ed. Ed. John Wiley & Sons, Ltd. 2002. pp. 1-514.
29. Y. Wu, K. Ianekiev, V. Govindaraju. “Improved k-nearest neighbor classification”. Pattern Recognition. Vol. 35. 2002. pp. 2311-2318. 30. M. Hall, E. Frank, G. Holmes, B. Pfahringer, P. Reutemann, I. H. Witten. “The WEKA Data Mining Software: An Update”. SIGKDD Explorations. Vol. 11. 2009. pp. 10-18. 31. K. Hauser, B. Longo, F. Jameson. Harrison Principios de Medicina Interna. Ed. McGraw Hill. 2006. pp. 2509, 2694-2699. 32. R. Snell. Neuroanatomía Clínica. Ed. Médica Panamericana. 2001. pp. 28-29.