However, in real life applications, speech is usually corrupted by noise and band- ..... cepstral mean subtraction or RASTA, model-based methods, e.g. speaker ...
Autoregressive models for text independent speaker identification in noisy environments by
Moataz El Ayadi
A thesis presented to the University of Waterloo in fulfillment of the thesis requirement for the degree of Doctor of Philosophy in Electrical and Computer Engineering
Waterloo, Ontario, Canada, 2008
c Moataz El Ayadi 2008
I hereby declare that I am the sole author of this thesis. This is a true copy of the thesis, including any required final revisions, as accepted by my examiners. I understand that my thesis may be made electronically available to the public.
ii
Abstract The closed-set speaker identification problem is defined as the search within a set of persons for the speaker of a certain utterance. It is reported that the Gaussian mixture model (GMM) classifier achieves very high classification accuracies (in the range 95% - 100%) when both the training and testing utterances are recorded in sound proof studio, i.e., there is neither additive noise nor spectral distortion to the speech signals. However, in real life applications, speech is usually corrupted by noise and bandlimitation. Moreover, there is a mismatch between the recording conditions of the training and testing environments. As a result, the classification accuracy of GMM-based systems deteriorates significantly. In this thesis, we propose a twostep procedure for improving the speaker identification performance under noisy environment. In the first step, we introduce a new classifier: vector autoregressive Gaussian mixture (VARGM) model. Unlike the GMM, the new classifier models correlations between successive feature vectors. We also integrate the proposed method into the framework of the universal background model (UBM). In addition, we develop the learning procedure according to the maximum likelihood (ML) criterion. Based on a thorough experimental evaluation, the proposed method achieves an improvement of 3 to 5% in the identification accuracy. In the second step, we propose a new compensation technique based on the generalized maximum likelihood (GML) decision rule. In particular, we assume a general form for the distribution of the noise-corrupted utterances, which contains two types of parameters: clean speech-related parameters and noise-related parameters. While the clean speech related parameters are estimated during the training phase, the noise related parameters are estimated from the corrupted speech in the testing phase. We applied the proposed method to utterances of 50 speakers selected from the TIMIT database, artificially corrupted by convolutive and additive noise. The signal to noise ratio (SNR) varies from 0 to 20 dB. Simulation results reveal that the proposed method achieves good robustness against variation in the iii
SNR. For utterances corrupted by covolutive noise, the improvement in the classification accuracy ranges from 70% for SNR = 0 dB to around 4% for SNR = 10dB, compared to the standard ML decision rule. For utterances corrupted by additive noise, the improvement in the classification accuracy ranges from 1% to 10% for SNRs ranging from 0 to 20 dB. The proposed VARGM classifier is also applied to the speech emotion classification problem. In particular, we use the Berlin emotional speech database to validate the classification performance of the proposed VARGM classifier. The proposed technique provides a classification accuracy of 76% versus 71% for the hidden Markov model, 67% for the k-nearest neighbors, 55% for feed-forward neural networks. The model gives also better discrimination between high-arousal emotions (joy, anger, fear), low arousal emotions (sadness, boredom), and neutral emotions than the HMM. Another interesting application of the VARGM model is the blind equalization of multi input multiple output (MIMO) communication channels. Based on VARGM modeling of MIMO channels, we propose a four-step equalization procedure. First, the received data vectors are fitted into a VARGM model using the expectation maximization (EM) algorithm. The constructed VARGM model is then used to filter the received data. A Baysian decision rule is then applied to identify the transmitted symbols up to a permutation and phase ambiguities, which are finally resolved using a small training sequence. Moreover, we propose a fast and easily implementable model order selection technique. The new equalization algorithm is compared to the whitening method and found to provide less symbol error probability. The proposed technique is also applied to frequency-flat slow fading channels and found to provide a more accurate estimate of the channel response than that provided by the blind de-convolution exploiting channel encoding (BDCC) method and at a higher information rate.
iv
Acknowledgements
I gratefully acknowledge my indebtedness to my supervisors Prof. Mohamed Kamel and Prof. Fakhri Karray who initiated and supervised this work. They conducted a lot of fruitful discussions and have been a source of inspiration and encouragement. They provided me with a lot of references and materials that were very essentials for the completion of this work. Moreover, they enrolled me in other research activities that enriched my experience in speech recognition. I would like to express my gratefulness to all my friends who supported me during my PhD program. They helped me overcome some stressful situations and pass both the comprehensive exam and the final defense easily. In particular, I would like to thank Ahmed Shamy, Azmy Faisal, Ayman Abdel Rahman, Hatem Al-Beheiry, Hatem Zein El Din, Nizar Abdullah, and Rami Langar. Special thanks go to Khaled Hammouda and Shady Shehata. They helped me a lot in technical issues and provided me with a convenient research environment. I am also very grateful to Ahmed Khairy, Mohamed Hammouda, and Shady Shehata for their encouragement and help during my last year of the program. They also helped me in the preparation of the presentation of the final defense. I am also very thankful to my PAMI colleagues who were keen to attend my presentations and provide me with their useful comments and feedback. In particular, I would like to thank Abbas Ahmadi, Sami Ullah, Akram Al Ghazali, Hanan Ayad, Mostafa Adel, Nabil Drawil, and Rasha Kashef. I wish for them all the best and success in their future life. Finally, I do not find words to express my deep gratefulness and love to my father, Prof. Hatem El Ayadi, my mother, Mona, my brother, Moatase, and my sister, MennatAllah, who supported me in many aspects and prayed for me a lot to pass my exams easily.
v
Dedication
To my parents, my brother, and my sister.
vi
Contents
List of Tables
xii
List of Figures
xiv
1 Introduction
1
1.1
Speaker recognition: principles and applications . . . . . . . . . . .
2
1.2
Thesis motivation and contributions . . . . . . . . . . . . . . . . . .
3
1.3
Thesis organization . . . . . . . . . . . . . . . . . . . . . . . . . . .
6
1.4
Notations . . . . . . . . . . . . . . . . . . . . . . . . . . . . . . . .
7
2 Text-independent speaker identification: a brief review
9
2.1
Problem formulation . . . . . . . . . . . . . . . . . . . . . . . . . .
10
2.2
Feature extraction
. . . . . . . . . . . . . . . . . . . . . . . . . . .
11
2.3
Classification techniques . . . . . . . . . . . . . . . . . . . . . . . .
16
2.3.1
Unsupervised learning techniques . . . . . . . . . . . . . . .
17
2.3.2
Supervised learning techniques . . . . . . . . . . . . . . . . .
21
Mismatch reduction techniques . . . . . . . . . . . . . . . . . . . .
24
2.4.1
Feature-based compensation techniques . . . . . . . . . . . .
24
2.4.2
Model-based compensation techniques . . . . . . . . . . . .
26
2.4
vii
2.4.3 2.5
Score-based compensation techniques . . . . . . . . . . . . .
27
Summary and conclusions . . . . . . . . . . . . . . . . . . . . . . .
29
3 Gaussian Mixture models
30
3.1
Mathematical definition of the GMM . . . . . . . . . . . . . . . . .
30
3.2
Standard maximum likelihood framework . . . . . . . . . . . . . . .
31
3.2.1
Parameter estimation . . . . . . . . . . . . . . . . . . . . . .
32
3.2.2
Classification framework . . . . . . . . . . . . . . . . . . . .
35
3.3
The Gaussian mixture model/universal background model framework 36
4 Vector autoregressive Gaussian Mixture model
42
4.1
Vector autoregressive models . . . . . . . . . . . . . . . . . . . . . .
43
4.2
Parameter estimation of the VARGM model . . . . . . . . . . . . .
45
4.2.1
The general case . . . . . . . . . . . . . . . . . . . . . . . .
46
4.2.2
Diagonal autoregression matrices . . . . . . . . . . . . . . .
49
4.3
Model order selection . . . . . . . . . . . . . . . . . . . . . . . . . .
50
4.4
Classification using the VARGM model . . . . . . . . . . . . . . . .
56
4.4.1
Standard VARGM/ML framework
. . . . . . . . . . . . . .
56
4.4.2
VARGM/UBM . . . . . . . . . . . . . . . . . . . . . . . . .
56
5 Generalized maximum likelihood adaptation
59
5.1
Main statistical model . . . . . . . . . . . . . . . . . . . . . . . . .
60
5.2
Model parameter estimation . . . . . . . . . . . . . . . . . . . . . .
61
5.3
Selection of the optimum regression order . . . . . . . . . . . . . . .
65
5.4
Adaptation using the GML rule . . . . . . . . . . . . . . . . . . . .
67
5.5
Blind equalization of MIMO channels . . . . . . . . . . . . . . . . .
69
viii
5.5.1
Problem formulation . . . . . . . . . . . . . . . . . . . . . .
72
5.5.2
Parameter estimation of the equalizer filter . . . . . . . . . .
75
5.5.3
The proposed equalization algorithm . . . . . . . . . . . . .
79
6 Experimental Evaluation 6.1
6.2
6.3
6.4
82
Group I: Closed-set text-independent speaker identification using the VARGM model . . . . . . . . . . . . . . . . . . . . . . . . . . . . .
83
6.1.1
The 2000 NIST speaker recognition evaluation . . . . . . . .
83
6.1.2
A comparison between GMM and VARGM . . . . . . . . . .
84
6.1.3
VARGM model order selection . . . . . . . . . . . . . . . . .
86
Group II: Speech emotion recognition using the VARGM model . .
87
6.2.1
The Berlin emotional database . . . . . . . . . . . . . . . . .
88
6.2.2
Results and discussion . . . . . . . . . . . . . . . . . . . . .
89
Group III: Adaptive speaker identification using the GML rule . . .
93
6.3.1
The TIMIT database . . . . . . . . . . . . . . . . . . . . . .
93
6.3.2
Modeling the mismatch by convolutive noise . . . . . . . . .
94
6.3.3
Modeling mismatch by additive white Gaussian noise . . . .
96
Group IV: Blind equalization of MIMO channels . . . . . . . . . . .
98
6.4.1
Comparison with the whitening approach . . . . . . . . . . .
99
6.4.2
Equalization over frequency-flat slow fading channels . . . . 101
6.4.3
Separable MIMO channels . . . . . . . . . . . . . . . . . . . 102
7 Conclusions and future work
107
7.1
Summary of results and thesis contribution . . . . . . . . . . . . . . 107
7.2
Future research directions . . . . . . . . . . . . . . . . . . . . . . . 109 ix
7.3
Publications . . . . . . . . . . . . . . . . . . . . . . . . . . . . . . . 111 7.3.1
Accepted journal papers . . . . . . . . . . . . . . . . . . . . 111
7.3.2
Submitted journal papers . . . . . . . . . . . . . . . . . . . 112
7.3.3
Accepted conference papers . . . . . . . . . . . . . . . . . . 112
APPENDICES
113
A Derivation of relations for the smoothed statistics in the GML framework
114
B Proof of Theorem 1 in Chapter 5
117
C Convergence Analysis of the EM algorithm used to estimate the equalizer filter
120
Bibliography
124
x
List of Tables 6.1
Classification performances of the GMM and the VARGM systems when applied to utterances from the 2000 NIST speaker recognition evaluation. . . . . . . . . . . . . . . . . . . . . . . . . . . . . . . . .
6.2
85
Classification performances of the GMM-UBM and the VARGMUBM systems when applied to utterances from the 2000 NIST speaker recognition evaluation. . . . . . . . . . . . . . . . . . . . . . . . . .
6.3
Classification performance of the AIC, the BIC, and the KIC model order selection techniques for the 2000 NIST database. . . . . . . .
6.4
86
87
Recognition accuracies, average identification times, and selected structural parameters of different recognition techniques when applied to the Berlin emotional speech database. . . . . . . . . . . . . . . . . . . . .
6.5
Normalized confusion matrix of the VARGM recognition technique when applied to the Berlin database. . . . . . . . . . . . . . . . . . . . . . .
6.6
92
Normalized confusion matrix of the HMM classifier when applied to the Berlin database. . . . . . . . . . . . . . . . . . . . . . . . . . . . . .
6.7
92
93
Classification accuracies of classifiers 1 and 2 when mismatch is modeled by convolutive noise. Number of speakers = 50; GM model order = 3. . . . . . . . . . . . . . . . . . . . . . . . . . . . . . . . . . . .
6.8
96
Classification accuracies of classifiers 1 and 2 when mismatch is modeled by convolutive noise. The SNR is known in advance. Number of speakers = 50; GM model order = 3. xi
. . . . . . . . . . . . . . .
97
6.9
Classification accuracies of classifiers 1 and 2 when mismatch is modeled by additive Gaussian white noise. Number of speakers = 50. GM model order = 3. . . . . . . . . . . . . . . . . . . . . . . . . . .
98
6.10 A comparison between the exact and the approximate versions of the AIC, the KIC, and the BIC. . . . . . . . . . . . . . . . . . . . . . . 101
xii
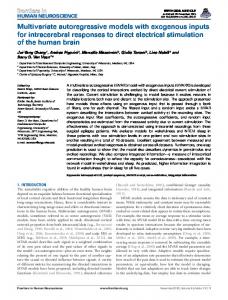
List of Figures 2.1
Functional block diagram of a speaker identification system. . . . . . . .
10
2.2
The speech feature extraction process. . . . . . . . . . . . . . . . . . .
13
2.3
The filter bank design used in our experimental study. Each filter has a triangular bandpass frequency response, and the spacing as well as the bandwidth is determined by a constant mel frequency interval. (The spacing is approximately 62.5 mels and the width of the triangle is about
. . . . . . . . . . . . . . . . . . . . . . . . . . . . . . . .
15
2.4
Functional block diagram of MFCC feature extraction. . . . . . . . . .
15
2.5
Multi-layer perceptron neural network. . . . . . . . . . . . . . . . . . .
22
2.6
The basic parallel model combination process. . . . . . . . . . . . . . .
28
3.1
The standard ML framework for speaker identification. (a) Training sub-
125 mels).
system. (b) Testing sub-system. . . . . . . . . . . . . . . . . . . . . .
3.2
37
The GMM/UBM framework for speaker identification. (a) Training subsystem. (b) Testing sub-system. . . . . . . . . . . . . . . . . . . . . .
41
5.1
The architecture of a GML-based classification system. . . . . . . . . .
69
5.2
Functional block diagram of the proposed equalization algorithm. . . . .
81
6.1
Average recognition accuracy of the VARGM recognizer when applied to the Berlin emotional speech database. . . . . . . . . . . . . . . . . . .
xiii
91
6.2
Symbol error probability for both the proposed method and the whitening method.
6.3
. . . . . . . . . . . . . . . . . . . . . . . . . . . . . . . . . 100
NMSE of the proposed method and the BDCC method with block length of 100, 400, 1600 symbols. . . . . . . . . . . . . . . . . . . . . . . . . 103
6.4
BER of the proposed method and the BDCC method with block length of 100 symbols. . . . . . . . . . . . . . . . . . . . . . . . . . . . . . . 103
6.5
A comparison between the symbol error probability of the proposed method and the ultimate equalizer in example 3. . . . . . . . . . . . . . . . . . 105
6.6
Relative error in H0 in example 3. . . . . . . . . . . . . . . . . . . . . 105
6.7
Equalization time versus SNR in example 3. . . . . . . . . . . . . . . . 106
xiv
List of Algorithms 4.1
Selection of the regression order. . . . . . . . . . . . . . . . . . . . .
53
4.2
The binary split algorithm. . . . . . . . . . . . . . . . . . . . . . . .
54
4.3
The proposed model order selection algorithm . . . . . . . . . . . .
55
5.1
Selection of the optimal regression order of the GML adaptation algorithm. . . . . . . . . . . . . . . . . . . . . . . . . . . . . . . . .
66
5.2
Approximate model order selection for the GML adaptation algorithm. 68
5.3
Estimation of the channel equalizer filter using the EM algorithm. .
xv
78
Abbreviations AIC
Akaike information criterion
ANN artificial neural networks AWGM additive white Gaussian noise BDCC blind de-convolution exploiting channel coding BER bit error probability BIC
Bayesian information criterion
CMS cpestral mean normalization CMVN cepstral mean and variance normalization CSI
channel state information
CSLU center for spoken language understanding DTW dynamic time warping EM
expectation maximization
GLRT generalized likelihood ratio test GML generalized maximum likelihood GMM Gaussian mixture model GVQ group vector quantization xvi
HMM hidden Markov model HOS higher order statistics HTK hidden Markov toolkit IFC
inverse filter criteria
IIR
infinite impulse response
KIC
Kullback information criterion
kNN k-nearest neighbor LBG-VQ Linde-Buzo-Gray vector quantization LDPC low density parity check LVQ learning vector quantization MAP maximum a posteriori MCE minimum classification error MFCC mel-frequency cepstrum coefficients MIMO multiple input multiple output ML
maximum likelihood
MLP multi-layer perceptron MMI maximum mutual information NAR-HMM non-stationary autoregressive hidden Markov model NMSE normalized mean square error OLS ordinary least squares PMC parallel model combination xvii
QPSK quadrature phase shift keying RBF radial basis function SE
super exponential
SISO single input single output SMS speaker model synthesis SNR signal to noise ratio SOS
second-order statistics
SRM structural risk minimization SS
spectral substraction
SVM support vector machines UBM universal background model VAR vector autoregressive VARGM vector autoregressive Gaussian mixture VMA vector moving average VQ
vector quantization
xviii
Chapter 1 Introduction The speech signal is the fastest and the most natural way of communication between humans. Moreover, it carries several types of information. From the speech point of view, it carries the following types of information: linguistic information (the spoken word sequence), speaker information (e.g. identity, emotional state, accent), and environmental information (e.g. the signal to noise ratio and the transmission bandwidth). Such nice properties of the speech signal have motivated researchers to think of speech as a fast and efficient way of interaction between human and machine. However, this requires that the machine should have the sufficient intelligence to recognize human voices. This faculty is referred to as Voice Recognition to which we generally attribute the faculties of Speech Recognition and Speaker Recognition. Speech recognition is defined as the process of extracting the spoken words and phrases from a given speech utterances. It has many applications such as voice dialing, call routing, content-based spoken audio search, simple data entry, preparation of structured documents, and speech-to-text processing. On the other hand, the research on speaker recognition is concerned with extracting the identity of the person speaking the utterance. Some of the important applications of speaker recognition include customer verification for bank transactions, access to bank accounts through telephones, control on the use of credit cards, machine-voice commands 1
and security check in military environments [17]. The first speaker recognition system was implemented at Bell labs in the late 60’s by Lawrence Kersta [67]. The basic idea of that system is based on the visual comparison between the spectrogram of the testing system and those of the training candidates. Over the past four decades, a significant progress has been achieved in speaker recognition. However, natural speaker recognition is still a difficult task due to many factors such as mismatch between the training and testing recording conditions (e.g. different microphones for enrollment and verification), different levels of surrounding noise, spectral distortion of speech caused by the band-limitation of the communication medium (e.g. the telephone channel), and multi-path fading effects [79, 17]. In this thesis, we mainly address the speaker recognition problem in noisy envirnments.
1.1
Speaker recognition: principles and applications
The research on speaker recognition is divided into three main categories: identification, verification, and segmentation [42, 18, 98]. The speaker identification problem is defined as the determination of a speaker identity from his/her voice. A speaker identification system is said to be open-set if it can determine whether the given testing utterance belongs to the set of enrolled speakers or not. Otherwise, it is called a closed-set speaker identification system [17]. Another distinguishing feature of speaker recognition system is whether it is text-dependent or text-independent. In text-dependent systems, the underlying texts of training and testing utterances are the same. On the other hand, the task is more difficult in text-independent systems where there is no restriction on the sentences spoken by the user of the system [94]. In speaker verification, the goal is to decide whether a certain speech utterance belongs to a certain speaker or not [36]. Therefore, it is a binary decision problem. 2
This problem is also called speaker detection, speaker authentication, talker verification or authentication, and voice verification [62]. Usually, two kinds of speakers are defined for the speaker verification problem: target speakers, which refer to the normal users of the system, and imposter speakers, which refer to unwanted people who fake the voices of the target speakers. Therefore, the speaker verification problem is an open-set problem. Clearly, voice-stamp security applications are based on speaker verification. Furthermore, speaker verification is the basis of many practical applications. In most speech recognition and speaker recognition systems, it is often assumed that the spoken utterance contains speech from one speaker only. However, in some applications, the voice of the intended speaker may be mixed with other speakers, e.g. a telephone conversation. In this case, it is necessary to divide the speech utterance into segments of each speaker in the conversation before applying the speaker recognition techniques. This task is called speaker segmentation and clustering. It is important in applications involving multi-speakers conversations such as meetings and TV shows.
1.2
Thesis motivation and contributions
In this thesis, we mainly consider the text-independent closed-set speaker identification problem in real-life environment. When both the training and testing utterances are recorded in clean environment, e.g. sound-proof studio, very high recognition accuracies (in the range %95 - %100) can be achieved using the Gaussian mixture model (GMM) classifier [96, 103]. However, in real life applications, there are many factors that significantly degrades the classification performance [60, 48] such as: • the use of different microphones for enrolment and verification. • the surrounding noise. When the signal to noise ratio differs from one utterance to another, the degradation in performance is more severe. 3
• the spectral distortion of the testing utterances caused by transmitting the speech signal through a band-limited channel. • multi-path fading effects [79, 17]. • extreme emotional states of the speaker, e.g. stress or happiness. • sickness and aging [17]. Therefore, it is still difficult to implement an accurate speaker recognition system in practice [79]. These factors motivated research on how to reduce the effect of handset/channel mismatch. Channel compensation techniques can be categorized into three groups: feature-based methods, e.g. spectral subtraction (SS) [14], cepstral mean subtraction or RASTA, model-based methods, e.g. speaker model synthesis [110] and parallel model combination (PMC) [43], and score-based methods, e.g. H-Norm [100], Z-Norm [9], and T-Norm [5]. A brief review on these compensation methods is given in Chapter 2. The main contribution in this thesis is the development of a two-step procedure for improving the classification performance of GMM-based text-independent speaker identification systems. In the first step of our procedure, we relax the assumption of statistical independence between successive feature vectors, employed in the ordinary GMM-based classification framework [96]. Although this assumption is incorrect, the GMM classifier provides high classification accuracies in clean environments [103]. However, we believe that modeling correlations between feature vectors is useful for utterances recorded in telephone channels. The main reason is that the telephone channel can be modeled by a bandpass filter, which naturally introduces correlation between successive speech time samples. It is also believed that modeling speaker-dependent temporal information present in the prompted phrases is useful in speaker identification [17, 130]. The correlation between successive feature vectors is modeled through an autoregressive relation. Therefore, the proposed model is a generalization to the
4
standard vector autoregressive (VAR) model in which the distribution of the innovation sequence is a mixture of Gaussian densities. The new introduced model is called vector autoregressive Gaussian mixture (VARGM) model. It can be also considered as a combination of the standard VAR (modeling correlation between feature vectors) and the standard GMM since it models the multi-modality in the distribution of the training data. When applied to the 2000 NIST speaker recognition evaluation, the proposed VARGM model is shown to provide a 3-5% increase in the classification accuracy over the standard GMM-based systems. In the second phase in our improvement procedure, we attempt to overcome the problem of the mismatch between the recording environments of the training and the testing utterances. Inspired by the successful application of the generalized likelihood ratio test (GLRT) in radar and sonar signal detection [12] and in voice/unvoiced detection [40], we modified the GLRT to fit into the multihypotheses classification problems. The new introduced rule is called the generalized maximum likelihood (GML) decision rule. We applied the proposed method to utterances in the TIMIT database, artificially corrupted by convolutive and additive noise. The signal to noise ratio (SNR) varies from 0 to 20 dB. Experiments were applied for 50 speakers. Simulation results reveal that the proposed method achieves good robustness against variation in the signal to noise ratio. As a side application, we successfully applied our proposed VARGM model to the speech emotion classification problem [6]. When applied to the Berlin emotional speech database [15], the proposed technique improves the classification accuracy by 5% over the hidden Markov model (HMM), 9% over the k-nearest neighbors (kNN), and 21% over the feed-forward artificial neural networks (ANN). The model gives also better discrimination between high-arousal emotions (joy, anger, fear), low arousal emotions (sadness, boredom), and neutral emotions than the HMM. Finally, the proposed GML adaptation framework is modified to fit into the problem of blind equalization of multi input multiple output (MIMO) communication channels. The main motivations behind considering this application are the
5
great similarities between the two problems and the recent interest in the latter problem [117, 116, 11, 81, 65, 24]. It should be mentioned that the scalar autoregressive Gaussian mixture model was introduced and proposed to blindly equalize single input single output (SISO) channels in [120]. However, besides considering the MIMO case, we generalize their approach in two other ways. First, complex time series are considered instead of real ones. This enables us to deal with the complex baseband representation of modulated signals. Furthermore, and unlike [120], we consider the problem of estimating the channel state information (CSI). The new equalization algorithm is compared to the whitening method [114] and found to provide less symbol error probability. It is also applied to frequency-flat slow fading channels and found to provide a more accurate estimate of the channel response than that provided by the blind de-convolution exploiting channel coding (BDCC) method and at a higher information rate.
1.3
Thesis organization
The thesis consists of seven chapters, the first of which is the introduction. We conclude this chapter with a description of the mathematical notations used throughout the thesis. In chapter 2, a brief review of the text-independent speaker identification systems is given. Basically, we give a qualitative formulation for the problem, describe a generic structure of a speaker identification system, and review the most common and prominent feature extraction and classification techniques. We conclude the chapter by a brief survey of mismatch reduction techniques. Chapter 3 covers the basic theory of GMMs: definition and parameter estimation using the expectation maximization (EM) algorithm [29]. It also describes in details two prominent classification frameworks employing GMMs as the core statistical classifiers: the standard ML framework and the Gaussian mixture model/universal background model (GMM/UBM) framework. 6
In Chapter 4, we present the theory of the proposed VARGM classifier. We start by briefly reviewing the simple VAR model and how to extend it to our proposed VARGM model. We then consider the parameter estimation problem and the model order selection problem for the VARGM model. In the last section of this chapter, the two classification frameworks addressed in chapter 2 are reconsidered again but with the VARGM model as the core statistical classifier. In chapter 5, the GML-based adaptation framework is described. Basically, we illustrate the adaptation architecture and discuss the parameter estimation and the model order selection problems. We also address the proposed application of blind equalization of MIMO channels in this chapter. In particular, we mathematically formulate the equalization problem and describe in details our proposed equalization procedure. The simulation results of all the above-mentioned techniques and suggested applications are combined in chapter 6. We also include our experiments with the speech emotion classification problem in this chapter. Finally, important conclusions and possible extensions to this work are stated in Chapter 7.
1.4
Notations
In this thesis, italic letters are used to represent scalars or sets while lower case bold letters represent vectors. For matrices, upper case bold letters are used. There is no distinction in notation between deterministic and random variables as this will be understood from the context. For iterative algorithms, a superscript with parenthesis indicates the iteration number. For example, A(s) denotes the sth -iterated value of A. Sequences may be represented in one of three ways: using braces with . . . inside, e.g. {x[1], . . . , x[N ]}, using braces with a lower limit and an upper limits on the
7
closing braces, e.g. {x[n]}N n=1 , or using a colon between the starting index and the ending index, x[1 : N ]. The probability of a certain event will be denoted by P (.) while the symbol p() is used with probability density functions. That is, if x is a random variable, then p(x) denotes its probability function. If y is another random variable, then p(x|y) denotes the conditional probability density function of x given y. The notation p(x|λ), where λ is a deterministic variable, means that the probability density function of x depends on parameter λ. The symbol E {} means expectation. The multivariate normal probability density function with mean vector µ and covariance matrix Σ is denoted by N(; µ, Σ), i.e., N(x; µ, Σ) =
1 (2π)D/2 |Σ|1/2
� � 1 T −1 exp − (x − µ) Σ (x − µ) , 2
where D is the dimensionality of the vector x. It is always assumed that all time series are causal, i.e., their values are equal P to zero at non-positive time instants. Therefore, summations like N n=1 x[n − i], i > 0 should cause no ambiguity because the first i terms of this series are zeros. Finally, all over the thesis, the following variables are used with fixed interpretation 1. n denotes an index of a time sample of feature vectors, 2. d denotes a specific dimension, 3. m denotes an index of Gaussian components, 4. p denotes an index of autoregression matrices.
8
Chapter 2 Text-independent speaker identification: a brief review Speaker recognition refers to the process of extracting information about the speaker from his/her voice. Figure 2.1 illustrates a typical architecture of a speaker identification system. The analog speech signal is filtered and then converted into a digital signal. Since the task is to identify the person talking rather than what the person is saying, the speech signal must be processed to extract measures of speaker variability instead of segmental features. Although there are no exclusively speaker distinguishing features, features based on the spectral analysis of the speech signal are known to be powerful in speaker recognition [96]. In particular, the mel-frequency cpestrum coefficients (MFCC) have been a typical choice for speaker recognition tasks because of their inherent robustness to noise and their ability to reflect the human perception of sounds [92]. Therefore, we primarily consider MFCC in this review. The last step in the speaker identification system is to match the extracted feature vectors with the stored speaker models, obtained in the training phase. The identified speaker is the one whose model gives the best match with the extracted testing feature vectors. As mentioned in the introduction, in real life applications, there are some factors that cause a significant deterioration to the classification performance such 9
Figure 2.1: Functional block diagram of a speaker identification system. as the surrounding noise and the spectral distortion caused by the communication channels. In this chapter, we present a brief survey on the classification methods as well as the compensation techniques used for closed-set text-independent speaker identification. This chapter contains four sections. In section 2.1, we present a qualitative description of the closed-set text-independent speaker identification problem. In section 2.2, we discuss in some details the process of extracting the MFCC features from the speech signal. A quick review on popular classification techniques used in the context of speaker identification is given in section 2.3. Common compensation techniques are covered in section 2.4.
2.1
Problem formulation
Based on the above definition of the speaker identification problem, the closed-set speaker identification is merely a multi-class pattern recognition problem: the class labels correspond to the speakers’ identities and the training and testing examples are the feature vectors extracted from the training and the testing utterances, respectively. Similar to all pattern classification problems, the speaker identification problem consists of two phases: learning (training) and classification (testing). In the learning phase, we have one or more speech utterances for each speaker to be enrolled in the system. The main objective in this phase is the construction of
10
a classifier that models the relevant characteristics of all speakers in the system. The available training speech together with their labels are used to estimate the classifier parameters. In the classification phase, we have a sequence of feature vectors {x[1], . . . , x[N ]}, extracted from a testing speech utterance with unknown speaker identity. The main objective in this phase is the determination of the speaker that most likely uttered the given testing speech. The closed-set speaker identification problem is thus formulated as the following multi-hypotheses problem: Hi : The sequence {x[1], . . . , x[N ]} is produced by speaker i.
i = 1, . . . , S,
where S is the number of speakers. If Ωi is the decision region for the ith speaker, the sets Ω1 , . . . , ΩS are disjoint and exhaustive for the closed-set speaker identification problem, i.e., the union of the decision regions comprise the entire feature space. Thus, the classification system is forced to make one and only one decision for each incoming test utterances. It should be mentioned that there are other decision systems that allow the speaker identification system to reject the incoming testing signal or output more than one hypothesis such as the erasure decoding and the list decoding [50]. For more details about such decision strategies, the reader is referred to [102].
2.2
Feature extraction
The underlying assumption in most speech processing schemes is that the properties of a speech signal vary relatively slowly with time [93]. This leads us to the basic principle of speech analysis in which the speech signal is divided into short segments called frames. The time samples of each frame may be filtered and multiplied by a shaping window in order to enhance the spectral properties of the speech signal. Nonetheless, the speech time samples are rarely used as a representation in speaker recognition applications because they carry little information about the conveyed speaker [96]. Usually, spectral features are calculated from the speech samples of 11
each frame and combined into one vector. This vector is called the feature vector and is used to represent the corresponding speech frame. The feature extraction process is illustrated in figure 2.2. The samples of each frame can be considered as the output of a linear time invariant system excited properly. The problem of speech analysis is to estimate the parameters of the linear time system producing each frame. Since the excitation and the impulse response of a linear time invariant system are related in a convolutional manner, the problem of speech analysis can be viewed as a problem in separating the component of a convolution. For that purpose, a complex cepstrum of a signal is defined as the inverse Fourier Transform of the logarithm of the signal spectrum. Formally, the cepstrum of a signal ,st , is given by Z π � 1 ct = log |S ejω |ejωt dω, 2π −π
(2.1)
where |S (ejω ) | is the Fourier transform of the speech signal, i.e., S e
jω
�
=
∞ X
st e−jωt ,
(2.2)
t=−∞
An interesting property for the cepstrum is that the cepstrum of the discrete time convolution of two signals equals to the summation of the cepstra of the individual signals. Thus, the cepstrum of each speech frame can be viewed as a superposition of the cepstra of the excitation and the impulse response of the speech model. However, the ordinary cepstrum has two disadvantages. The first one is that the cepstrum is of infinite extent even when the original signal is of a finite duration. Although the cepstrum is a rapidly decaying function, a relatively large number of cepstral samples has to be extracted from each frame for an accurate representation of the cepstrum. This increases the computational requirements of the training and the testing algorithms. Another disadvantage is that the ordinary cepstrum does not adequately model the human perception to the frequency content of sounds. Psychological studies show that the human perception to either pure tones or speech signals does not follow a linear scale [92]. This research has led to the idea 12
Figure 2.2: The speech feature extraction process. of defining a subjective pitch of pure tones. Thus for each tone with an actual frequency, f , measured in Hz, a subjective pitch is measured on a scale called the
13
mel scale. As a reference point, the pitch of a 1 KHz tone, 40 dB above perceptual hearing threshold, is defined as 1000 mels. An empirical relation between the linear frequency (measured in Hz) and the mel frequency (measured in mels) is given by [28] mel(f ) = 1000
log(1 + f /700) . log(1 + 1000/700)
(2.3)
It can be noticed from the above formula that the relation between the mel frequency and the linear frequency is almost linear for low frequencies (below 700 Hz) and logarithmic for high linear frequencies (beyond 1KHz). Another important subjective criterion of the frequency contents of a signal is the critical band that refers to the bandwidth at which subjective responses, such as loudness, become significantly different. The loudness of a band of noise at a constant sound pressure remains constant as the noise bandwidth increases up to the bandwidth of the critical band. After that, an increased loudness is perceived. Similarly, a subcritical bandwidth complex sound (multi-tone) of constant intensity is about as loud as equally intense pure tone of a frequency lying at the center of the band, regardless of the overall frequency separation of the multiple tones. When the separation exceeds the critical bandwidth, the complex sound is perceived as becoming louder. One approach to simulating the above two subjective criteria is through the use of a bank of filters spaced uniformly on the warped mel frequency scale [25]. The modified cepstrum of S(ejω ) thus consists of the output power of these filters when S(ejω ) is input. Denoting these power coefficient by , S˜k , k = 1, . . . , K, we can calculate what is called the mel-frequency cepstrum, xd , as K X
�
1 π xd = log(S˜k ) cos d(k − ) 2 K k=1
� d = 1, . . . , D,
(2.4)
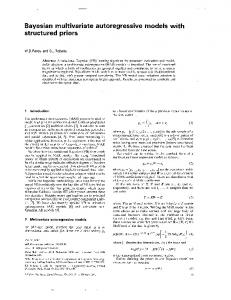
where D is the desired length of the cepstrum. Fig. 2.3 shows the frequency response magnitude of the filter bank used in our experimental study. Cepstral analysis is performed only over the telephone passband (300-3300 Hz). Each filter has a triangular bandpass frequency response, and the spacing as well as the 14
Figure 2.3: The filter bank design used in our experimental study. Each filter has a triangular bandpass frequency response, and the spacing as well as the bandwidth is determined by a constant mel frequency interval. (The spacing is approximately 62.5 mels and the width of the triangle is about 125 mels).
Figure 2.4: Functional block diagram of MFCC feature extraction. bandwidth is determined by a constant mel frequency interval. (The spacing is approximately 55 mels and the width of the triangle is about 110 mels). A block diagram illustrating the complete procedure for extracting MFCCs from a speech signal is depicted in Fig. 2.4.
15
2.3
Classification techniques
Classification refers to deciding the class label (the unknown identity) of the testing signal. In closed-set speaker identification systems, classification is performed by assigning a score for each class that attempts to measure how likely the corresponding speaker produced the given testing utterance. A decision is made in favor of the speaker whose model provides the highest matching score. The classifier performance is measured by its ability to predict the true labels of unknown testing utterances as well as the time need for making a decision. In order to have a good classification performance, training examples (utterances) with known labels are used to estimate the classifier parameters. Basically, there are two main approaches for learning. In the first approach, a model is constructed for each speaker. The training examples (feature vectors) of each speaker are used to train his corresponding model only. Thus, at the end of the training phase, we have S trained models; each is trained to exactly one of the speakers in the systems. In the testing phase, each model calculates a likelihood score with respect to the given testing utterances. This approach is sometimes called unsupervised learning [94] because, when each speaker model is trained, the corresponding class label information is not used. Examples of unsupervised modeling approaches include k-NN, vector quantization (VQ), GMM and HMM. On the other hand, the supervised training approach refers to classification schemes that use all the training data of all speakers together with their corresponding labels to train the classifier. In the training phase, the classifier learns how to distinguish between different classes rather than learning each class alone. Examples of supervised classifiers include multi-layer perceptron (MLP) neural networks, radial basis functions (RBF) neural networks, support vector machines (SVM). In these classification techniques, a single classifier model is assigned to all classes and used for both training and classification. Another alternate configuration is to assign a model to each class like the unsupervised learning approach. However, each model is trained to favor its corresponding training data and unfavor the training 16
data of other speakers. The parameter estimation criterion in the latter configuration are said to be discriminative. In the context of speech recognition, popular discriminative estimation criteria include the minimum classification error (MCE) criterion [64] and the maximum mutual information (MMI) criterion [8]. Supervised algorithms often perform better than unsupervised algorithm but at the expense of additional computational, memory, and time requirements. Nonetheless, some unsupervised training algorithms such as the GMM and the HMM are considered the state of the art classification techniques in the context of speaker recognition. In addition, unsupervised learning algorithms have an extra advantage over supervised ones in that new speakers can be added easily to the identification system without the need to retrain other speaker models. In this section, different supervised and unsupervised classification techniques are reviewed. For unsupervised techniques, k-NN, the VQ, the HMM classifiers are briefly reviewed. The GMM is studied in details in the next chapter. For supervised techniques, the MLP, the RBF, and the SVM are studied as representatives for supervised learning algorithms that employ a single model for all classes.
2.3.1
Unsupervised learning techniques
As mentioned earlier, a basic advantage of unsupervised learning algorithms is in the flexibility of adding and removing speakers from the system. Unsupervised learning algorithms are often characterized by the decision function that is used to measure the match between a given testing utterance and a certain speaker model. While distance metrics are utilized with the NN, the dynamic time warping (DTW), and the VO classification methods, a probabilistic likelihood is used with statistical classifiers such as the GMM and the HMM.
Nearest Neighbor The NN classification method is a conceptually simple classification technique that is found to be efficient in many pattern classification problems [33]. The training 17
phase just consists of storing all the training data vectors with their corresponding labels. To classify a testing example, the closest k training examples are found and a decision is made to the class that is most common in those k neighbors. Since a speech utterance is represented by a set of feature vectors, a distance metric between two sets of feature vectors should be defined. Given two sequences of feature vectors U = {u[1], . . . , u[Nu ]} and R = {r[1], . . . , r[Nr ]}, Higgins defined the following metric for the task of speaker identification [58]. d(U, R) =
1 X 1 X min ||u[i] − r[j]||2 + min ||u[i] − r[j]||2 r[j]∈R u[i]∈U Nu Nr u[i]∈U
1 X − Nu
u[i]∈R
r[j]∈R
min
||u[i] − u[j]||2 −
u[j]∈U,j6=i
1 X Nr
r[i]∈R
min
||r[i] − r[j]||2 (2.5)
r[j]∈U,j6=i
The NN classification technique was applied to the KING and the Switchboard databases in [58]. The number of speakers in the KING database was 51 while 24 speakers (12 male and 12 female) were selected from the Switchboard database. For the KING database, the classification accuracy was 79.9% when the recoding equipments used with the training and testing utterances are the same and 68.1% when they are different. For the Switchboard, the recognition accuracy was 95.9%. Since the k-NN classifier requires the storage of all the training data vectors, it is considered very costly in terms of the computational and memory requirements. Therefore, its implementation may be infeasible practical applications.
Vector quantization In order to reduce the huge storage requirements inherent in the k-NN classification techniques, the training data may be divided into homogenous groups of each which is called a cluster. The center of each cluster, also called centroid, is then used to represent all the data vectors in this cluster. This way of compression is usually called vector quantization (VQ) in the context of speech recognition. This collection of centroids is called the codebook, which is a compact representation of the training data. The model of each speaker model just contains the codebook constructed 18
from its corresponding training data. There are many algorithms proposed for the codebook design such as the Linde-Buzo-Gray (LBG-VQ) method [72], the learning vector quantization (LVQ) method [69], and the group vector quantization (GVQ) [53]. The LBG-VQ method was applied in [130] to utterances of 35 speakers in the CSLU (center for spoken language understanding) database. There were mismatches between the speech utterances taken from different speakers and also between different recording sessions of the same speaker. A codebook of size 64 MFCC vectors was designed for each speaker. The obtained classification accuracy was 62.9%. The VQ-methods do not consider the temporal profile of neither the training nor the testing utterances. Though this greatly simplifies the implementation of the identification, the temporal information is useful in speaker identification tasks [17]. This may be the reason for the relatively low accuracies obtained by the VQ methods.
Hidden markov model (HMM) The HMM classifier has been extensively used in speech applications such as isolated word recognition and speech segmentation because it is physically related to the production mechanism of the speech signal [91]. Moreover, the temporal dynamics of the data are captured though state transitions. The HMM is a doubly stochastic process which is compromised of a probabilistic finite state machine (Markov chain) in which each state is associated with another random variables producing the observations. Therefore, the main difference between the Markov chain and the HMM is in that the states are not directly observable and the observations are probabilistic functions in the state sequence. Usually, the observation random variable is either discrete or follow the GMM distribution [91, 88]. In discrete HMMs, the VQ codebook is first obtained from the training data. Each vector in the codebook is assigned a unique label. The set of the codebook labels forms the sample space of the observation random variables. 19
The set of parameters for discrete HMMs contains the initial state probabilities, the state transition probabilities, and the observation probabilities. For the continuous HMMs, the observation probabilities are replaced by the prior probabilities, the means vectors, and the covariance matrices of the observation GMM density. Training a speaker HMM is equivalent to finding the HMM parameters that maximizes the probability of the observations. The Baum-Welch estimation technique is the most widely used method for this task [91, 29]. In the recognition phase, the match function between a sequence of a testing feature vectors and a certain speaker is defined as the probability this sequence is generated by the corresponding speaker model. It should be mentioned that many variants of the HMM have been proposed and applied in voice recognition and other applications. In addition, very efficient algorithms have been developed for training HMMs and for calculating the likelihoods for sequence of data vectors (For a survey on HMMs, see [34] and the references therein). The use of HMM in speaker recognition dates back to the eighties. In [89], an ergodic 5-state HMM (i.e., all possible transitions between states are allowed) was proposed by Poritz for this task. Tishby [111] expanded Poritzs idea by using an 8-state ergodic autoregressive HMM represented by continuous probability density functions with 2 to 8 mixture components per state. Matsui and Furui conducted a conducted a comparison between the VQ method, the discrete HMM, and the continuous HMM in terms of the classification accuracy and the robustness against noise. They found that the continuous HMM is far superior to the discrete HMM and as robust as the VQ-method. They also studied the effect of the number of mixtures and the number of Gaussian components per state on the identification accuracy. Upon their investigation, they concluded that the recognition accuracy is highly dependent on the number of Gaussian components but almost uncorrelated with the number of states. Therefore, they ended up with a conclusion that there is no significant difference in performance between the HMM and the GMM, which is an HMM with only one state. The robust classification performance of the GMM classifier was also reported by Rose et al. [96]. 20
2.3.2
Supervised learning techniques
The main idea of supervised learning approaches is to learn the decision boundaries rather than the distribution of individual classes. Many supervised training algorithms are capable of generating a model that can distinguish one of M classes. Alternatively, a model can be generated for each speaker in the population so that it can distinguish between vectors in that class and vectors in all other classes. It has been found experimentally that the latter approach provides a higher classification performance [94]. Several supervised training algorithms have been investigated for speaker identification such as the MLP [108, 36], RBF [75, 127], and SVM [121, 128]. For the closed-set speaker identification problem, the performance obtained with the supervised training algorithms was typically comparable to the unsupervised techniques. However, the extensive training time necessary for most supervised algorithms is an undesirable feature. For tasks that require rejection capabilities, such as speaker verification and open set speaker identification, it was found that supervised methods consistently outperform the more traditional unsupervised methods [37, 36].
Multi-layer perceptron (MLP) The MLP is a popular form of neural network that has been considered for various speech processing tasks [80, 73]. The structure of a MLP is illustrated in Fig. 2.5. The weights for MLPs are trained with the backpropagation algorithm [13] such that they can associate a high output response with particular input patterns. For speaker recognition, the configuration of one-model-pre-class, described in the introductory paragraph in subsection 2.3.2, is usually employed with the MLP classifier. Ideally, the MLP for each speaker should output a one-response for the test feature vectors of that speaker and a zero-response for test vectors of other speakers. In the recognition phase, all test vectors are applied to each MLP and the outputs of each are accumulated. The speaker is selected as corresponding to the MLP with the maximum accumulated output. The use of the MLP classifier 21
Figure 2.5: Multi-layer perceptron neural network. for speaker identification problems was suggested in [84]. The speech for their simulations is drawn from a 10 speaker database and consists of 500 utterances from the digit set, 100 of which were used for training and 400 for recognition. A MLP with one hidden layer and 128 hidden nodes achieved a 92% identification rate for this experiment, which was just slightly worse than the performance obtained with a VQ classifier with 64 codebook entries per speaker. The performance improved as the number of hidden nodes increased. However, it was observed that increasing the number of hidden layers did not improve generalization. It was also noted that the performance of MLPs degrades rapidly as the speaker population increases.
Radial basis function (RBF) Another major category of neural networks is the RBF networks. Basically, the RBF consists of three layers. The first layer is responsible for coupling the input vector to the network and has a linear neuron function. The last layer has a number of neurons equivalent to the number of speakers and uses an adjustable sigmoid as neuron function. In the hidden layer, a special function, called the RBF, is used 22
as an activation function. The RBF monotonically decreases with the increase of the distance to some specified centers, which are usually obtained by the k-means algorithm. For the proper choice of kernel function and perceptron weights, the RBF network becomes equivalent to the GMM with the exception that supervision is available here [13]. The RBF classifier was implemented in [96] and applied to subset of 16 speakers in the KING database. Using an RBF with 800 Gaussian basis functions, the average classification accuracy was 87.2%.
Support vector machines The SVM is a statistical binary classifier that is based on the structural risk minimization (SRM) induction principle [119], which aims at minimizing a bound on the generalization error, rather than minimizing the training error. The SMV makes its decisions by constructing an optimal hyperplane that separates the two classes with the largest margin. In most classification problems, it is very difficult to find a separating hyper-plane in the original feature space. Therefore, a nonlinear mapping for the features to a higher dimensional space is usually performed before looking for the separating hyper-planes. Recently, the SVM classifier has drawn much interest in many classification problems [33]. In text-independent speaker identification, the GMM has been a popular choice for the nonlinear kernel mapping function [128, 39]. However, other functions such as the linear kernel, polynomial and radial basis kernel are also used [121]. Another important issue is that the theory of the SVM classifier was mainly developed for the binary classification problem [119, 33]. Basically, there are two main approaches for generalization to the multi-class SVM classification system. In the first approach, each possible pair of the classes is used to train a SVM classifier. That is, if the total number of speakers is S, the total number of the binary SVM models is S(S−1)/2. For a test utterance, the pairwise comparison [70] 23
strategy is adopted to identify its speaker. Clearly, when the number of speakers is relatively large, the computational requirements of both the training and the testing algorithms of this approach become excessive. Unfortunately, this is typically the case in most speaker identification problems. Alternatively, one can employ the method described in the first paragraph in 2.3.2. In this case, a bit inferior classification performance should be expected. The SVM was applied in [121] to utterances of twenty speakers (10 males and 10 females) selected from the AURORA-2 database. The radial basis kernel functions were adopted in the experiment. The classification accuracy was 90.1% for clean speech and 48.6% for artificially corrupted speech (after enhancing the speech quality).
2.4
Mismatch reduction techniques
During the last two decades, there has been extensive research on reducing the effect of handset channel mismatch, which significantly hamper the performance of speaker recognition systems. In general, compensation techniques can be grouped into three categories: feature-based, model-based, and score-based compensation techniques. In this section, we give a brief review about methods in each category. It should be mentioned that compensation techniques are not exclusive in general. That is, it is possible to combine techniques that belong to two or more different domains, e.g. feature-based and model-based, so as to achieve an even better compensation [100].
2.4.1
Feature-based compensation techniques
In feature-based compensation, the goal is to derive features that are insensitive as possible to non-speaker related factors such as the handset type, sentence content, and channel effects. At the same time, they should provide good discrimination between different speakers.
24
In this brief review, we shall cover only three of the most standard (and classical) feature-based compensation techniques: the SS method [14], the cpestral mean normalization (CMS) method [41] and the RASTA-PLP method [57]. Other feature-based compensation methods include discriminative feature design [54], feature warping [86], and short-time Gaussianization [123]. The SS technique assumes that the noise is stationary and it affects the energy contour of the noisy signal in an additive way. Hence the additive noise component could be subtracted from the noisy speech energy to estimate the clean speech energy. The additive noise component is generally computed from the silence portion of the speech. In reality, the stationary assumption does not hold. Hence, it is possible that the noise energy in some frequency bins can exceed that of the noisy speech resulting in a negative estimate of the clean speech energy. This necessitates the use of a floor value. The floor value is expressed as a portion of the noise energy. Let |S(ejω )|2 , |N (ejω )|2 , and |X(ejω )|2 be the energies of the clean speech, the noise, and the noisy speech, respectively. According to the SS method, an estimate for the energy of the clean signal is given by � ˆ jω )|2 = max |X(ejω )|2 − |N (ejω )|2 , k|N (ejω )|2 , |S(e
(2.6)
where k is an empirical constant, which is usually less than one [85]. It has been found that performance of the SS method heavily depends on the floor value, k|N (ejω )|2 [31]. Therefore, statistical methods have been proposed for the estimation of the noise floor [32, 125]. The CMN method depends on the fact that the filtering effect of the communication channel is equivalent to an additive vector in the mel-cepstral domain [103]. Thus, the channel effect can be removed by subtracting the mean cepstral vector from all the cepstral feature vectors extracted from each utterance. As a consequence, all feature vectors have the same mean vector and performance is not affected by the channel biases. When additive noise exists, a natural extension to the CMN is the cepstral mean and variance normalization (CMVN) [107], which normalizes the distribution of cepstral features over some specific window length 25
by subtracting the mean and dividing by the standard deviation. RASTA is a modulation spectrum analysis that aims to reduce the effects of convolutional noise in the communication channel. This achieved by 1) attenuating low modulation frequency components and 2) enhancing the dynamic parts of the spectrogram [56]. Similar to the CMN, the low frequency components are filtered out in order to remove the additive channel-dependent vector. It has been claimed that the second property is also beneficial for good recognition performance [56]. The classical RASTA filter has the following transfer function [56]. H(z) = 0.1z 4
2 + z − z −3 − 2z −4 1 − 0.98z −1
(2.7)
This transfer function introduces phase distortion, which causes time masking for the auditory human perception. Therefore, a phase-correction step was suggested in [26] after the RASTA calculation. The use of both the CMN and the RASTA processing methods has been much recommended in many speaker recognition systems [96, 100].
2.4.2
Model-based compensation techniques
Model-based compensation techniques attempt to reduce the effect of channel variations by learning channel characteristics or enhancing the speaker probability distribution models. The most two well known examples in this category are speaker model synthesis (SMS) [110] and PMC [43]. The SMS technique learns how the speaker model parameters change among different channels, and uses this information to synthesize speaker models for channels where no enrollment data is available. It utilizes channel-dependent UBMs as a priori knowledge of channels for speaker model synthesis. This algorithm assumes that all the speakers are subject to the same model transformation between two different channels; however in reality different speakers may be subject to different model transformations.
26
The PMC approach attempts to estimate the corrupted speech model by combining the clean speech model with a background noise model. The PMC is much related to the extraction process of the MFCC features. Therefore, the following domains are defined: the linear-spectral domain, the log-spectral domain, and the cepstral domain (see figure 2.4). A diagram showing the basic process of the PMC is shown in figure 2.6. The inputs to the scheme are the clean speech models and the noise model. Usually, the combination of speech and noise is expressed in either the linear-spectral domain or the log-spectral domain. Hence, the combination of the noise and clean parameters are made in one of these two domains. After combination of parameters, the estimates of the corrupted speech parameters are transformed back to the cepstral domain if required. The PMC has been shown to achieve good performance in speech recognition and speaker recognition applications [83, 44]. However, a drawback of the PMC is that it assumes the availability of an accurate statistical model for the noise in the training phase. This assumption is not valid for many practical applications since the training and the testing utterances of the same speaker may well be recorded in different environments.
2.4.3
Score-based compensation techniques
While feature-based compensation techniques address linear channel effects, the handset transducer effects are nonlinear in nature and are thus difficult to remove from features before training and recognition [90]. As a result, the speaker’s model represents the speaker’s acoustic characteristics coupled with the distortions caused by the handset from which the training speech was collected. This coupling introduces handset-dependent biases and scales to the likelihood scores of the speaker acoustics models. Therefore, score-domain compensation aims to remove handsetdependent biases from the likelihood scores. The most prevalent methods in this category include the H-norm method [100], the Z-norm method [9], and the T-norm method [5]. The H-norm score normalization technique works as follows. All the speakers are 27
Figure 2.6: The basic parallel model combination process. grouped according to the handset they used for producing the training utterances. For each handset type, the scores of all speakers in the corresponding group are calculated and then normalized according to the following relation sH-Norm (X) =
log P (X|λ) − µh , σh
(2.8)
where µh and σh are the average and the standard deviation of the scores in this group. The Z-norm and T-norm are given by relations similar to (2.8). The only difference is in the definition of the normalizing factors. Both the Z-norm and the T-norm techniques use a set of cohort speakers who are close to the target speaker. The selection of the cohort can be done during training when the speaker model is compared to cohort models using a similarity measure [5]. In the Z-norm technique, the scores are defined as the log-likelihood of the target speaker model with respect to the utterances of the cohort speakers. Meanwhile, in the T-norm technique, the 28
scores are defined as the log-likelihood of the cohort speakers’ models with respect to the testing utterance.
2.5
Summary and conclusions
In this chapter, we presented a brief review about closed-set text-independent speaker identification. We explained the MFCC feature extraction process because it is one of the most popular features used for speaker recognition. In addition, we surveyed the common classification techniques used in the context of speaker identification as well as the different types of mismatch reduction techniques. From this survey, we conclude that the classification performance of real world speaker identification systems still needs much improvement. Moreover, despite the relative improvement in mismatch reduction achieved by feature-based and channel-based methods, it seems that they do not provide much space for further progress. Therefore, we main attention in this thesis was toward model-based compensation.
29
Chapter 3 Gaussian Mixture models Gaussian Mixture Model (GMM) has become a dominant approach for speaker recognition problems [103].
Several reasons are attributed to this dominance.
Among them are the achieved robustness and the possibility to model the underlying acoustic classes. Moreover, a well-established mathematical basis has been developed for GMMs. In general, two main frameworks have been proposed for GMM-based speaker identification: the standard ML decision framework and the Gaussian mixture model/universal background model (GMM/UBM) framework. This chapter gives an overview of both classification frameworks. Section 3.1 defines analytically the GMM. The standard ML and the GMM/UBM frameworks are described in details in section 3.2 and section 3.3, respectively.
3.1
Mathematical definition of the GMM
A mixture model of order M is a convex combination of M probability density functions in the form: p(x|λ) =
M X
wm p(x|m, λ)
(3.1)
m=1
where x is a D-dimensional vector, λ is a string representing the model parameters, p(x|λ) is the model density function, p(x|m, λ) is the density function of the mth 30
component, and wm is the a priori probability of the mth Gaussian component density, or simply, the weight of the ith component. The prior probabilities must be nonnegative and sum to one so that (3.1) is a valid probability density function. For the case of GMM, p(x|m, λ) is the multivariate Gaussian distribution with mean vector µm and covariance matrix Σm , p(x|m, λ) ≡ N(x; µm , Σm ) =
1 (2π)D/2 |Σm |1/2
� exp (x − µm )T Σ−1 m (x − µm ) .
(3.2)
Thus, a GMM with M mixtures is parameterized by a set of M positive weights that sum to unity, M mean vectors, and M covariance matrices. These parameters are collectively represented by the string λ = {w1 , . . . , wM , µ1 , . . . , µM , Σ1 , . . . , ΣM }.
(3.3)
There are three types of GMMs depending on the choice of covariance matrices. The model can have one covariance matrix per Gaussian component (nodal covariance), one covariance matrix for all Gaussian components in a speaker model (grand covariance), or one covariance matrix shared by all speaker models (global covariance). The covariance matrix can also be full or diagonal. GMMs with nodal covariance matrices are primarily used in our study.
3.2
Standard maximum likelihood framework
As mentioned in the introduction, the speaker identification problem can be formulated as a multi-hypothesis classification problem. In the standard ML framework, each speaker (hypothesis) is modeled by a GMM. In the training phase, the feature vectors of each speaker are used to estimate his/her model parameters based on the ML estimation principle. In the testing phase, the ML decision rule is used to identify the speaker of the testing utterance. In this section, we address the parameter estimation problem and classification using the ML-decision rule. 31
3.2.1
Parameter estimation
Let X = {x[1 : N ]} denote the set of the training feature vectors of a certain speaker1 . In GMM-based speaker identification systems, it is assumed that all the feature vectors are statistically independent, i.e., p(x[1 : N ]|λ) =
=
N Y
p(x[n]|λ)
n=1 N Y
M X
n=1
m=1
! wm N (x[n]; µm , Σm ) .
(3.4)
Obviously, the above likelihood function is a highly nonlinear function in the model parameters. Hence, maximization of the likelihood function is only possible through iterative procedures such as gradient-based methods and the EM algorithm. The EM algorithm, proposed by Dempster et al. [29], basically depends on the existence of ’complete’ data set Z from which the given data X can be derived. For the problem in hand, the complete data specification is Z = {Φ, X}, where Φ = {φ[1 : N ]}, and φ[n] is the index of the Gaussian component selected at time n. The basic idea of the EM algorithm is to start with some initial model λ(0) and look for another model λ(1) with a higher likelihood value. Dempster et al. proved that for any model λ(s) , the model λ(s+1) obtained by maximizing the following auxiliary function must have an equal or larger likelihood function. � Q(λ; X, λ(s) ) = E log P (X, Φ|λ) |X, λ(s) .
(3.5)
This is one iteration of the algorithm. Starting from an initial model λ(0) , the auxiliary function Q(λ; X, λ(0) ) is constructed and then optimized with respect to λ. The obtained model λ(1) will be the initial model for the next iteration in which another auxiliary function Q(λ; X, λ(1) ) is constructed and optimized again with respect to λ and so on. Since this iterative procedure always guarantees an increase in the incomplete likelihood function thanks to Dempster theory, the EM should stop when a maximum number of iterations is exceeded or the increase in the likelihood function is less than a small threshold. 1
For convenience, we dropped the speaker index in this section.
32
The EM update equations are derived as follows. The complete likelihood function is given by P (X, Φ|λ) =
=
=
N Y n=1 N Y n=1 N Y
P (x[n], φ[n]|λ)
P (φ[n]|λ)P (x[n]|φ[n], λ)
wφ[n] N(x[n]; µφ[n] , Σφ[n] ).
(3.6)
n=1
Substituting (3.6) into (3.5), and simplifying, the auxiliary function is given by Q(λ; X, λ(s) ) = � � X 1 1 (s) T −1 Pm,n (λ ) log wm − log |Σm | − (x[n] − µm ) Σm (x[n] − µm ) , (3.7) c+ 2 2 m,n where
P
m,n
is a shorthand for
PM
m=1
PN
n=1 ,
c is an irrelevant constant, Pm,n (λ(s) )
is the a posteriori probability of the mth Gaussian component given the observation x[n], i.e., Pn,m (λ) ≡ P (φ[n] = m |X; λ) = PM
wm N(x[n]; µm , Σm )
m0 =1
wm0 N(x[n]; µm0 , Σm0 )
.
(3.8)
The EM update equations are obtained by maximizing the auxiliary function in (3.7) with respect to λ. Fortunately, the auxiliary function is uni-modal in λ, and hence λ(s+1) is obtained simply by differentiating Q(λ; X, λ(s) ) with respect to λ and equating to zero. Regarding the model priors, however, there is an additional constraint, which is, M X
(s+1) wm = 1.
m=1
Hence, the update equations for the priors are obtained by maximizing the following Lagrangian function Q0 (λ; X, λ(s) ) = Q(λ; X, λ(s) ) + β
M X m=1
33
! wm − 1 .
It is straightforward to show that, upon differentiating Q0 (λ; X, λ(s) ) with respect to wm , m = 1, . . . , M , the update equations for the model priors are given by (s+1) wm =
1 X Pn,m (λ(s) ), N m,n
m = 1, 2, ..., M.
(3.9)
Similarly, the update equations for the model centers and covariance matrices are given by µ(s+1) m
PN =
n=1 P N
Pn,m (λ(s) )x[n]
n=1
Σ(s+1) m
(s+1)
PN =
(3.10)
Pn,m (λ(s) )
n=1
(s+1) T
Pn,m (λ(s) )(x[n] − µm )(x[n] − µm PN (s) n=1 Pn,m (λ )
)
.
(3.11)
In (3.11), no assumption is made regarding the structure of the covariance matrices, Σm , m = 1, . . . , M . However, in order to reduce the computational requirement for both the training and the testing algorithms, the covariance matrices are usually assumed to be diagonal [96, 103]. It is also argued that the classification performance of GMM-based system with diagonal covariance matrices is superior to those with full covariance matrices [100]. Note that the diagonal assumption does not imply the statistical independence between the feature components (dimensions) since, at any time instant n, the index of the selected Gaussian component is the same for all dimensions. However, in order to represent the same distribution, the number of Gaussian components with diagonal covariance is much more than the number of Gaussian components with full covariance. Let the diagonal covariance matrix of the mth Gaussian component be 2 2 ). Σm = diag(σm,1 , . . . , σm,D
In this case, the normal distribution N(x; µm , Σm ) simplifies to N(x; µm , Σm ) =
D Y
2 N(xd ; µm,d ; σm,d )=
d=1
D Y
1
d=1
q 2 2πσm,d
(xd − µm,d )2 exp − 2 σm,d
! . (3.12)
2 Following the same steps used to derive (3.11), the update equations for σm,d is
given by PN 2 (σm,d )(s+1)
=
n=1
(s+1)
Pn,m (λ(s) )(xd [n] − µm,d )2 . PN (s) n=1 Pn,m (λ ) 34
(3.13)
It should be mentioned that the EM algorithm is a local optimization algorithm. That is, the ML estimate of the model parameters is sensitive to the initial model estimate λ(0) . One method to alleviate this problem is to use the k-means algorithm [72] to divide the training data into M clusters. The initial estimates of the parameters of each Gaussian component are estimated from the corresponding cluster as follows [13] (0) = Nm /N. wm 1 X µ(0) = x[n], m Nm n∈C m X 1 (0) T Σ(0) x[n]xT [n] − µ(0) m = m (µm ) , Nm n∈C
(3.14) (3.15) (3.16)
m
where Cm is the set of the indices of the data points in the mth cluster and Nm is the number of data points in this cluster. For diagonal covariance matrices, the initial estimate of the diagonal entries is given by � �2 1 X 2 (0) 2 (0) (σm,d ) = x [n] − µm,d . Nm n∈C d
(3.17)
m
3.2.2
Classification framework
In the standard ML classification framework, the index of the decided speaker is determined according to the ML decision rule. Given a sequence of testing vectors, X = {x[1 : N ]}, extracted from an unknown speech utterance the required speaker model should attain the largest a posteriori probability. Using Bayes’ theorem, the index of the selected speaker is: sˆ = arg max P (Hs |X) = arg max s=1,...,S
s=1,...,S
p(X|Hs ) P (Hs ) . p(X)
(3.18)
The denominator in the above equation is irrelevant to the maximization argument, s, and hence it can be dropped. In addition, in most applications there is no reason to favor a speaker over another a priori, and hence, the prior probability of all hypotheses should be the same. Thus, equation (3.18) reduces to sˆ = arg max p(X|Hs ) = arg max s=1,...,S
s=1,...,S
35
N Y n=1
p(x[n]|Hs ) .
(3.19)
In the above equation, a product of a large number of small values should be evaluated for each speaker. Therefore, direct implementation of the above decision rule on a digital computer results in an underflow. Alternatively, maximization may be made with respect to log p(X|Hs ) yielding sˆ = arg max
s=1,...,S
= arg max
s=1,...,S
N X
log p(x[n]|Hs )
n=1 N X n=1
log
M X
! P (φ[n] = m|Hs )p(x[n]|φ[n] = m, Hs ) ,
m=1
where P (φ[n] = m|Hs ) is the prior probability (weight) of the mth Gaussian component in λs and p(x[n]|φ[n] = m, Hs ) is given by (3.2) for full covariance matrices and (3.12) for diagonal covariance matrices. Hence, we need to evaluate a summaP −am for large am . This can be done without encountering tion in the form M m=1 e computer underflows by using the Jacobian log [35]. The basic idea is to add logs one at a time, as follows a12 = log(ea1 + ea2 ) = max(a1 , a2 ) + log(1 + e−|a1 −a2 | ) Then, the new exponential a3 is added to a12 the same way and so on. A diagram of the ML classification framework is illustrated in figure 3.1.
3.3
The Gaussian mixture model/universal background model framework
In the standard ML framework, it is implicitly assumed that no prior information about the model parameters is available. In some applications such as the considered speaker identification problem, incorporating prior information about the model parameters improves the classification performance. The maximum a posteriori (MAP) estimation principle is a direct generalization to the ML estimation
36
Figure 3.1: The standard ML framework for speaker identification. (a) Training subsystem. (b) Testing sub-system.
principle in which the model parameters are considered as random quantities with some given prior distribution. In the context of speaker identification (and verification), the prior distribution of the parameters of all speaker models are assumed the same and derived from a speaker-independent distribution called the universal background model (UBM) [103]. There are many ways to construct the UBM. The simplest method is to pool the training data of all speakers together and use them to train a single 37
GMM. However, we should be careful of the distribution of the sub-populations in the training database. For example, if number of utterances of female speakers is much more than that of male speakers, the UBM constructed by the above method will be biased towards the female distribution. A similar issue applies to utterances with different microphones and different recording environments (if known). Some other approaches model each subpopulation separately. The UBM parameters are estimates as a convex combination of the parameters of the subpopulations models. The mixing weights should be carefully selected to reflect the proportion of each sub-population. In this thesis, we considered only utterances recorded using electret microphones. In addition, we performed our experiments using male-only database, female-only database, or mixed-gender database with almost equal proportions of males and females. Therefore, UBM is trained using the training data of all speakers. Thus, the training phase in the GMM/UBM framework consists of two steps. In the first step, all the training data are combined together and used to train a GMM/UBM model, ˜ 1, . . . , Σ ˜ M} ˜ 1, . . . , w ˜ M, Σ λUBM = {w˜1 , . . . , w˜M , µ
(3.20)
using the ordinary EM algorithm, where the tilde in (3.20) refers to the parameters of the UBM. It should be mentioned that, for large databases such as the 2000 NIST speaker evaluation used in our first experiment, direct implementation of the update equations in section 3.1 may require excessive space requirements. Hence, special memory conservative algorithms should be developed. This is internally implemented in our simulations but we prefer to omit these details for convenience. Based on the obtained GMM/UBM, prior distributions of the model parameters are derived as follows. The distribution of the model priors is usually assumed in the Dirichlet form [63]. P (w1 , . . . , wM |ν1 , . . . , νM ) ∝
M Y m=1
38
νm −1 wm ,
(3.21)
where νm > 0 are the parameters of the Dirichlet density. Meanwhile, the prior distribution of the centers and the covariance matrices of the speaker model is assumed to follow a Wishart distribution [27, 47]. ˜ m) ∝ ˜ m, Σ P (µm , Σm |τm , αm , µ � τ � m ˜ m )−1 (µm − µ ˜ m )T (Σ ˜ m) |Σm |(αm −d−1)/2 exp − (µm − µ 2� � 1 ˜ (3.22) exp − trace(Σ−1 m Σm ) . 2 Assuming statistical independence between the model priors and the model centers and covariance matrices, the joint density of all the GMM parameters is the product of (3.21) and (3.22), i.e., P (λ|θ) = P (w1 , . . . , wM |ν1 , . . . , νM )
M Y
˜ m ), ˜ m , αm , Σ P (µm , Σm |τm , αm , µ
(3.23)
m=1
where θ = {ν1 , . . . , νM , α1 , . . . , αM , τ1 , . . . , τM }. In the second step of the training phase, the parameters of each speaker model are obtained by adapting the UBM using the speaker training data. Given a sequence of training feature vectors of a certain speaker, X = {x[1 : N ]}, a generalized version of the EM algorithm is used to adapt the UBM. In particular, the distribution of the model parameters is included in the EM auxiliary function. The generalized auxiliary function in this case is given by [47] � Q(λ; X, λ(s) , θ) = E log P (X, Φ|λ, θ) + log P (λ|θ) X, λ(s) , θ .
(3.24)
Substituting (3.23) into (3.24), it is not hard to show that Q(λ; X, λ(s) , θ) = � � X 1 1 (s) T −1 c+ Pm,n (λ ) log wm − log |Σm | − (x[n] − µm ) Σm (x[n] − µm ) 2 2 m,n M � X αm − d − 1 τm ˜ m )T Σ−1 ˜ m) + (νm − 1) log wm + log |Σm | − (µm − µ m (µm − µ 2 2 m=1 � �� 1 −1 ˜ − trace Σm Σm (3.25) 2 39
Similar to the standard ML estimation, the GMM parameters are obtained by simply differentiating the above auxiliary function with respect to the different parameters and equating to zero. The constraint that the all the priors are positive and sum to unity still applies. The following update equations are easily obtained. PN Pm,n (λ(s) ) + νm − 1 (s+1) = n=1 wm (3.26) P N −M + M ν m m=1 PN (s) ˜m Pm,n (λ )x[n] + τm µ = n=1 µ(s+1) (3.27) PN m (s) n=1 Pm,n (λ ) + τm PN ˜ m) ˜ mµ ˜ Tm + Σ Pm,n (λ(s) )x[n]xT [n] + τm (µ (s+1) Σm = n=1 PN (s) n=1 Pm,n (λ ) + αm − d − 1 � �P (s+1) (s+1) N (s) (µm )T n=1 Pm,n (λ ) + τm µm − . (3.28) PN (s) n=1 Pm,n (λ ) + αm − d − 1 In the last equation, full covariance matrices are considered. For diagonal covariance matrices, the update equation is � �P (s+1) 2 N (s) (s) 2 2 2 P (λ ) + τ P (λ )x [n] + τ (µ + σ ˜ ) − m (µm,d ) m d m,d m,d n=1 m,n n=1 m,n . PN (s) ) + α − d − 1 P (λ m,n m n=1 (3.29)
PN 2(s+1)
σd
=
The classification phase in the GMM/UBM framework is identical to that of the ML framework. A diagram showing the architecture of the GMM/UBM framework is shown in figure 3.2.
40
Figure 3.2: The GMM/UBM framework for speaker identification. (a) Training subsystem. (b) Testing sub-system.
41
Chapter 4 Vector autoregressive Gaussian Mixture model In this chapter, we give a thorough analysis of the proposed vector autoregressive Gaussian mixture (VARGM) model and generalize the classification frameworks described in chapter 2 to handle VARGM models instead of GMM. The proposed VARGM model is a generalization to the VAR model in that the distribution of the innovation sequence, also called residual vectors, is a GMM instead of the multivariate normal distribution. VAR model is a classical and simple tool, successfully used in characterizing and analyzing stationary multivariate time series data. It has been utilized in many applications such as signal processing [106], digital communication [114], and time series prediction [30]. The main reasons for their popularity are their simple structure and the availability of well established parameter estimation algorithms such as the maximum likelihood estimation (MLE) procedure and the Yule-Walker algorithm. The basic idea of the VAR model is to model the time series as the output of an all-pole linear time invariant filter whose input is a white Gaussian noise. This input is usually called the innovation sequence. That is, it is assumed that the individual samples of the innovation sequence are statistically independent and follow the multivariate Gaussian distribution. 42
In many speech applications, VAR models have been extensively employed to characterize the correlation between successive speech feature vectors. In fact, autoregressive Markov modeling of speech was originally proposed by Poritz [89]. His model consists of a sequence of states of each which is modelled by a VAR model rather than a GMM. Various modifications have been proposed to this model such as non-stationary autoregressive hidden Markov model (NAR-HMM) [71] and autoregressive hidden Markov model with duration [35]. However, the assumption of a white-Gaussian innovation sequence seems to be restrictive for speaker identification. Therefore, in this chapter, we relax this assumption by allowing the distribution of the innovation sequence to be in the form of a mixture of multivariate Gaussian densities. In fact, this model is also a vector generalization for the model proposed in [120]. Another advantage of the VARGM model is its ability to resemble a wide range of non-Gaussian VAR models. This is based on the fact that many distributions can be well approximated by a convex combination of Gaussian densities under some mild conditions [96]. The chapter is organized as follows. Section 4.1 briefly reviews VAR models and the estimation of model parameters based on the MSE criterion. In section 4.2, parameter estimation of the VARGM model parameters using the EM algorithm is explained. In section 4.3, we present a novel procedure for model order selection. Classification using the proposed VARGM classifier is discussed in section 4.4.
4.1
Vector autoregressive models
A vector time series x[1 : N ], x[n] ∈ RD , i.e. D is the dimensionality of the vector x[n], can be modelled by a VAR model of order P of the following form [95]. x[n] =
P X
Ap x[n − p] + e[n] + δ,
n = 1, . . . , N,
(4.1)
p=1
where the vector δ is called the intercept vector and P is the regression order. The vectors e[1 : N ] are called the residual vectors. Usually, the residual vectors are 43
assumed to be drawn from a white Gaussian process, i.e., they satisfy the following relations E {e[n]} = 0, � E e[n1 ]eT [n2 ] = 0, � E e[n]eT [n] = Σ,
∀n
(4.2)
∀ n1 6= n2 .
(4.3)
∀n
(4.4)
where Σ is a strictly positive definite matrix. Defining h i ˜ A ≡ δ A1 A2 ... AP , h iT y[n] ≡ 1 xT [n − 1] xT [n − 2] ... xT [n − P ] , where x[n] = 0 whenever n < 0, equation (4.1) reduces to ˜ x[n] = Ay[n] + e[n],
n = 1, 2, ..., N.
(4.5)
˜ and Thus, a VAR model is parameterized by the regression coefficient matrix A the innovation covariance matrix Σ. The sum of squared error is given by E=
=
N X n=1 N X
eT [n]e[n] T ˜ ˜ (x[n] − Ay[n]) (x[n] − Ay[n]),
(4.6)
n=1
˜ is obtained by differentiating the The ordinary least squares (OLS) estimate of A ˜ and equating the result to zero, yielding above equation with respect to A ! N !−1 N X X ˜ OLS = A x[n]yT [n] y[n]yT [n] , n=1
(4.7)
n=1
ˆ OLS , is given The OLS estimate of the covariance matrix of the residual vectors, Σ by [51] N
ˆ OLS = Σ
X 1 ˆ[n]ˆ e eT [n] N − DP − 1 n=1 N
X 1 ˜ OLS y[n])(x[n] − A ˜ OLS y[n])T . = (x[n] − A N − DP − 1 n=1 44
(4.8)
˜ are equal when the distribution The OLS and the ML parameter estimates of A of the innovation sequence is Gaussian [51]. This is proven by noting that the likelihood function is given by p {x[n]}N n=1 |λ =
1
�
(2π)N D/2 |Σ|N/2
exp −
N 1X
2
! T −1 ˜ ˜ (x[n] − Ay[n]) Σ (x[n] − Ay[n]) .
n=1
(4.9) ˜ and equating the result to Differentiating the above equation with respect to A zero, expression (4.7) will follow. However, the ML estimate of Σ is a bit different from its OLS estimate viz N N X 1 X ˆ˜ ˆ˜ T ˆ ML = 1 ˆ[n]ˆ e eT [n] = (x[n] − A Σ OLS y[n])(x[n] − AOLS y[n]) . N n=1 N n=1
4.2
(4.10)
Parameter estimation of the VARGM model
As noted from the above subsection, the ML and the OLS parameter estimates of the autoregression matrix are equivalent only when the distribution of the innovation is Gaussian. However, this assumption may be restrictive in many applications. Alternatively, we may assume that the residual vectors follow the GMM distribution, i.e., p(e[n]) =
M X
wm N(e[n]; µm , Σm ).
(4.11)
m=1
In this case, the intercept vector δ can be dropped since the mean of the GMM distribution may well be different from zero. ˜ will be different In this case, the ML-estimate of the autoregression matrices, A, from the corresponding OLS-estimate. While the latter is still given by (4.7), the former is obtained through iterative procedures such as the gradient-based methods or the EM algorithm. The problem of estimating the model parameters of a scalar autoregressive Gaussian mixture model via the EM algorithm was first investigated by Verbout et. al [120]. Basically, they proposed the EMAX algorithm as an iterative procedure for 45
estimating the model parameters. In this chapter, we generalize their procedure to deal with multivariate time series. In addition, more than one time series sequence may be used for parameter estimation. Having established such a generalization, the VARGM model will be more suitable for classification. In this section, we first consider the general case without any assumptions about the structures of the autoregression matrices or the covariance matrices. The special case of diagonal autoregression matrices and diagonal noise covariance matrices is addressed later.
4.2.1
The general case
th k Formally, there are K time series realizations, {xk [n]}N n=1 , k = 1, 2, ..., K, the k
of which contains Nk samples. All realizations are to be modeled by the following relation ˜ k [n − i] + ek [n], xk [n] = Ay
n = 1, 2, ..., Nk ,
k = 1, 2, ..., K
(4.12)
where ek [n] follows the GMM distribution defined in (4.11) and h i ˜ ≡ A A ... A , A 1 2 P h iT yk [n] ≡ xTk [n − 1] xTk [n − 2] ... xTk [n − P ] . For convenience, the set of all time series sequences will be denoted by X. Assuming that each sequence is generated independently from other series, the likelihood of all sequences is equal to the product of the likelihood of the individual realizations, i.e., Nk � K Y � Y p(X|λ) = p xk [n] xk [1 : n − 1], λ
=
=
k=1 n=1 Nk K Y Y
� � p xk [n] xk [n − P : n − 1], λ
k=1 n=1 Nk K Y Y
M X
k=1 n=1
m=1
! ˜ k [n] + µm , Σm ) . wm N(xk [n]; Ay
46
(4.13)
Similar to the case of GMM, the new expression of the likelihood function in this case is so complex that direct differentiation leads to a set of highly nonlinear equations in the model parameters, which is extremely difficult to solve. Therefore, the EM algorithm is used again to estimate the model parameters. The complete K k data specification is Z = {X, Φ}, where Φ = {{φk [n]}N n=1 }k=1 and φk [n] is the index
of the Gaussian component selected at instant n for time series realization k. The complete likelihood function is given by p(X, Φ|λ) =
=
=
Nk K Y Y k=1 n=1 Nk K Y Y k=1 n=1 Nk K Y Y
p(xk [n], φk [n]|xk [1 : n − 1], φk [1 : n − 1], λ) P (φk [n]|λ)p(xk [n]|xk [n − P : n − 1], φk [n], λ) ˜ k [n] + µφ[n] , Σφ[n] ). wφk [n] N(xk [n]; Ay
(4.14)
k=1 n=1
Similar to the GMM case, the VARGM model parameters are iteratively updated by maximizing the following auxiliary function. � Q(λ; X, λ(s) ) = E log P (X, Φ|λ) |X, λ(s) ,
(4.15)
where λ(s) is the set of model parameters obtained after the sth iteration. Substituting (4.14) into (4.15), and simplifying, the auxiliary function is given by � X 1 (s) (s) Q(λ; X, λ ) = c + Pk,n,m (λ ) log wm − log |Σm | 2 k,n,m � 1 −1 T ˜ k [n] − µm ) Σ (xk [n] − Ay ˜ k [n] − µm ) , (4.16) − (xk [n] − Ay m 2 P where c does not depend on the model parameters, k,n,m is a shorthand for PK PNk PM (s) th Gaussian k=1 n=1 m=1 , Pk,n,m (λ ) is the a posteriori probability of the m component given the observation xk [n], i.e., � Pk,n,m (λ(s) ) ≡ P (φk [n] = m X; λ(s) (s) (s) ˜ (s) yk [n]; µ(s) wm N(xk [n] − A m , Σm ) = PM . (s) ˜ (s) yk [n]; µ(s)0 , Σ(s)0 ) w 0 N(x[n] − A 0 m =1
m
m
47
m
(4.17)
The following update equation for the prior probabilities can be obtained in a similar way to that followed in Chapter 3. (s+1) wm
= PK
(s+1)
The update equations of µm
Nk K X X
1
k=1 Nk
Pk,n,m (λ(s) )
(4.18)
k=1 n=1
˜ (s+1) are obtained by equating the , Σ(s+1) , and A m
˜ to zero. Similar to the scalar derivative of (4.16) with respect to µm , Σm , and A case in [120], this results in a set of nonlinear equations that are difficult to solve simultaneously. Instead, at each iteration, only one variable is maximized while others are kept fixed. This approach guarantees coordinate ascent convergence to a local maximum [74]. Therefore, we start by finding optimum µm while keeping ˜ After some other variables constant, then finding optimum Σm then optimum A. simple manipulation, the following update equations are obtained. PK PNk ˜ (s) yk [n]) Pk,n,m (λ(s) )(xk [n] − A (s+1) µm = k=1 n=1 PK PNk (s) k=1 n=1 Pk,n,m (λ ) Σ(s+1) m
PK PNk
n=1
k=1
=
(4.19)
˜ (s) yk [n])(xk [n] − A ˜ (s) yk [n])T Pk,n,m (λ(s) )(xk [n] − A PK PNk (s) k=1 n=1 Pk,n,m (λ )
− µ(s+1) (µ(s+1) )T m m
(4.20)
˜ deserves some investigation. Equating the derivative The update equation of A ˜ is obtained of Q(λ; X, λ(s) )) to zero, the following equation in A X
(s+1) ˜ (s+1) Pk,n,m (λ(s) )(Σ−1 A yk [n]ykT [n] m )
k,n,m
=
X
(s+1) Pk,n,m (λ(s) )(Σ−1 (xk [n] − µ(s+1) )ykT [n], m ) m
(4.21)
k,n,m
Applying the vec () operator to both sides of the above equation, the following � � ˜ (s+1) could be obtained after some simple manipulations. expression for vec A �
�
#−1 � (s+1) × Pk,n,m (λ(s) ) (yk [n]ykT [n]) ⊗ (Σ−1 m )
"
˜ (s+1) = vec A
X k,n,m
! vec
X
(s+1) Pk,n,m (λ(s) )(Σ−1 (xk [n] − µ(s+1) )ykT [n] , m ) m
k,n,m
48
(4.22)
where ⊗ denotes the Kronecker product of two matrices. However, the space required to store the matrix to be inverted in (4.22) is of order O(D4 P 2 ). For some applications, this may require excessive storage. An ˜ (s+1) is through iterative methods. Fortunately, the alternative way for obtaining A ˜ Hence, it has a unique maximizer, auxiliary function in (4.16) is quadratic in A. which is also the unique solution of (4.21). Thus, fast and efficient techniques such as the steepest ascent method and the conjugate gradient method may be used to estimate this unique maximizer. In this thesis, general VARGM were applied only to the speech emotion classification problem and the memory requirement of the EM algorithm was reasonable. Therefore, we did not apply any approximation to (4.22). For the speaker identification problem, we prefer to use VARGM models with diagonal autoregression matrices and diagonal covariance matrices.
4.2.2
Diagonal autoregression matrices
Another method to reduce the computational complexity of the training and the testing algorithms is to assume that the autoregression matrices, A1 , . . . , AP as well as the covariance matrices, Σ1 , . . . , ΣM , are diagonal. Though it is also mathematically tractable to consider other cases, e.g. general covariance matrices and diagonal autoregression matrices, no significant advantage was experimentally observed with this assumption. Therefore, only the case of diagonal autoregression matrices and diagonal covariance matrices will be covered in this thesis. In order to simplify our derivations, it is convenient to define the following two vectors: h iT ˜d = a • a ˜dp is the dth on the diagonal of Ap . ˜d1 . . . a ˜dP , where a h iT ˜ k,d [n] = yd [n − 1] . . . yd [n − P ] • y For the case of diagonal covariance matrices and diagonal autoregression matrices,
49
it is straightforward to show that the auxiliary function in (4.16) simplifies to Q(λ; X, λ(s) ) = D
˜Td y ˜ k,d [n] − µm,d )2 (xk,d [n] − a 1X 2 + log σm,d c+ Pk,n,m (λ(s) ) log wm − 2 2 d=1 σm,d k,n,m
!!
X
,
(4.23) where d in the subscript refers to the dth components of the vector. Similar to the general case, we have the same constraint on the prior probabilities. Thus, the parameter update equations are obtained by following the same steps used in the general case. The only difference is that (4.16) is replaced by (4.23). It is not hard to show that the update equations for the prior probabilities and the mean vectors 2 are still given by (4.18) and (4.19), respectively. The update equations for σm,d and
˜d are given by a (s+1) (σm,d )2
˜(s+1) a = d
X k,n,m
P =
(s)
k,n
(s)
˜ k,d [n] − µm,d )2 Pk,n,m (λ(s) )(xk,d [n] − (˜ ad )T y P (s) k,n Pk,n,m (λ )
Pk,n,m (λ(s) )
T ˜ k,d [n]˜ y yk,d [n]
!−1
(s+1) (σm,d )2
(4.24) (s)
X
Pk,n,m (λ(s) )
xk,d [n] − (µm,d )2
k,n,m
!
(s+1)
(σm,d )2 (4.25)
˜d , The above update equations require a space of order O(P 2 ) for each vector a which is significantly less than that required for the general case.
4.3
Model order selection
Similar to other classifiers, the VARGM model contains two types of parameters: numeric parameters that are estimated using the ML or the MAP estimation criteria and structural design parameters that control the classifier complexity. In our proposed VARGM classifier, the structural design parameters are the regression order, P , and the number of Gaussian components, M , in the distribution of the residual vectors. In this context, a model order refers to a specific combination (M, P ). Unfortunately, there is no straightforward way to determine the optimum 50
model order that provide a VARGM classifier with the optimal generalization ability. In general, structural design parameters are estimated either by trial and error methods or according to a certain model order selection criterion. In the latter approach, the model order selection criterion is calculated for different orders. The selected order is the one corresponding to the minimum value. There are two basic types of model order selection criteria: the cross validation error [13] and the information-theoretic criteria. In the cross validation method, the training data is divided into two sets: one for estimating the classifier parameters and the other for validating its performance. The model selection criterion is taken as the classification error with respect to the validation set. The k-fold cross validation can be incorporated easily into this method in order to get more reliable estimates of the validation error. This method is useful when the amount of the training and the testing data is not sufficient for a reliable estimate of the model parameters. Information-theoretic criteria, on the other hand, attempt to find the best possible compromise between the classifier ability to adequately model the distribution of the training data and the complexity of the classifier. Usually, information theoretic criteria are given in the following form IC(M, P ) = −α log p(X|λ(M, P )) + β|λ(M, P )|,
(4.26)
where α and β are some positive constants and λ(M, P ) denotes a VARGM model with M Gaussian components and regression order P . |λ(M, P )| is the number of parameters in λ(M, P ). The first term in (4.26) measures the fitness of the data to the distribution specified by the classifier model and the second term measures the complexity of the classifier. In this thesis, the following information-theoretic criteria are considered 1. Akaike information criterion (AIC) [1] AIC(M, P ) = −2 log p(X|λ(M, P )) + 2|λ(M, P )| 51
(4.27)
2. Kullback information criterion (KIC)[19] KIC(P ) = −2 log p(X|λ(M, P )) + 3|λ(M, P )|
(4.28)
3. Bayesian information criterion (BIC)[101] BIC(P ) = −2 log p(X|λ(M, P )) + |λ(M, P )| log(N )
(4.29)
For our VARGM model, the likelihood function is given by (4.13) and the number of model parameters is given by |λ(M, P )| = P D2 + M (1 + D + D(D + 1)/2)
(4.30)
for VARGM models with full covariance matrices and full auto-regression matrices, and |λ(M, P )| = P D + M (1 + 2D)
(4.31)
for VARGM models with diagonal covariance matrices and diagonal auto-regression matrices. The standard information theoretic model order selection technique may be time consuming since the first term in (4.26) requires training models with different orders. Moreover, for each model order, initialization should be done properly in order to ensure that the likelihood function increases with the increase of the M or P. First, let us consider the search of the optimal regression order assuming that M is known. The set of all VARGM models with regression order P − 1 is a subset of all VARGM models with regression order P . This statement is established easily by setting AP = 0D×D in any model with regression order P . Thus, for a given M , Algorithm 4.1 can be used to calculate the likelihood function for different regression orders. It should be mentioned that only few iterations are required for the EM algorithm in the above algorithm since the increase in the likelihood function is 52
Algorithm 4.1 Selection of the regression order. 1: Inputs: X, M , Pmax , and λ(M, 0). 2:
Output: λ(M, P ), P = 1, . . . , Pmax .
3:
Fit the data into a GMM with M Gaussian components.
4:
Calculate p(X|λ(M, 0)).
5:
Calculate IC(M, 0) using (4.26).
6:
for P = 1 to Pmax do
7:
Set λ0 = λ(M, P − 1) (Copy all the parameters of λ(M, P − 1) to λ0 ).
8:
Increment the regression order of λ0 by 1.
9:
In λ0 , put AP = 0D×D .
10:
Train λ(M, P ) using the EM algorithm. Take λ0 as the initial model for the EM algorithm.
11:
Calculate p(X|λ(M, P )) using (4.13).
12:
Calculate IC(M, P ) using (4.26).
13:
end for
guaranteed. In addition, it is unlikely that having a small number of iterations will affect the choice of the optimum model order. The question now is how to determine the optimum number of Gaussian components. For speaker identification and verification problems, it is a common practice to select M as a power of 2 [103]. In this work, we prefer to follow this practice for two reasons. First, it is useful to apply mixture splitting to speed up model order selection, as we shall see shortly. Second, significant difference in the classification accuracy is only observed when the change in the number of Gaussian components is relatively large. A possible binary split procedure is shown in Algorithm 4.2. Thus, our two dimensional search for the optimal combination (M, P ) proceeds as follows. First, we consider GMMs (P = 0). We calculate the model selection criterion for different values of M . The binary split algorithm, shown in Algorithm 4.2, is used to speed up the estimation process of the incomplete likelihood function. For each value of M , we calculate the model selection criterion for different 53
Algorithm 4.2 The binary split algorithm. 1: Inputs: X, M , and λ(M, 0). 2:
Output: λ(2M, 0).
3:
Generate M uniformly distributed random numbers in the range from 0 to 1.
4:
Normalize the generated numbers so that they sum to one. These numbers are the initial priors of new M components, w ˆ1 , . . . , wˆM .
5:
ˆ 1, . . . , µ ˆ M . These are the initial centers of the new Generate random vectors µ M components.
6:
Initialize λ(2M, 0) with the following parameters. 1. w˜m =
(1 − �)wm
m = 1, . . . , M.
�wˆm
m = M + 1, . . . , 2M,
where � is a small quantity. 2. ˜m = µ
µm
m = 1, . . . , M.
µ ˜
m = M + 1, . . . , 2M.
Γ m
m = 1, . . . , M.
ID
m = M + 1, . . . , 2M.
m
3. ˜m = Γ
7:
Update the model parameters using the k-means algorithm then the EM algorithm.
54
regression orders as shown in Algorithm 4.1. The overall model order selection procedure is shown in Algorithm 4.3. Algorithm 4.3 The proposed model order selection algorithm 1: Inputs: X. 2:
Output: Optimal M and P .
3:
Fit the data to λ(M0 , 0), where M0 = 2m0 is an initial estimate for the model order and m0 is an integer.
4:
Calculate p(X|λ(M0 , 0)) using (4.13).
5:
Calculate IC(M0 , 0) using (4.26).
6:
for m = m0 + 1 to mmax do
7:
M = 2m .
8:
Use Algorithm 4.2 to split the components in λ(M/2, 0). The resultant model is λ(M, 0).
9: 10:
Calculate p(X|λ(M, 0)) using (4.13). Calculate IC(M, 0) using (4.26).
11:
end for
12:
for m = m0 to mmax do
13:
M = 2m .
14:
for P = 1 to Pmax do
15:
Use Algorithm 4.1 to derive λ(M, P ) from λ(M, P − 1).
16:
Calculate p(X|λ(M, P )) using (4.13).
17:
Calculate IC(M, P ) using (4.26).
18:
end for
19:
end for
20:
The selected order (M, P ) is given by {M ∗ , P ∗ } = arg min IC(M, P ). M,P
55
4.4
Classification using the VARGM model
In principle, the classification methodology using the VARGM model is very similar to that of the GMM. Therefore, in this section, we just point out the main differences between the GMM-based and the corresponding VARGM-based frameworks.
4.4.1
Standard VARGM/ML framework
The training procedure in the standard VARGM/ML-based framework is similar to that illustrated in figure 3.1. In the training phase, the only difference is that both the model order selection procedure and the parameter estimation procedure can be integrated together as described in Algorithm 4.3 in section 4.3. Hence, this algorithm should replace the parameter estimation module in figure 3.1. In the classification phase, speakers’ scores are calculated using equation (4.13) instead of (3.1).
4.4.2
VARGM/UBM
In the VARGM/UBM framework, all the training data vectors are used to estimate the UBM parameters as done with the GMM case. For adapting individual speaker model parameters, we follow the same methodology employed in section 3.3. For simplicity, we shall consider only the case of a single sequence for adaptation, i.e. K = 1. Nonetheless, the general case is rather straightforward. For ˜ is assumed in the following general autoregression matrices, the prior density of A form. � � � �� β T ˜ ˜ ˜ ˜ ˜ ˜ p A|β, AUBM ∝ exp − trace (A − AUBM ) (A − AUBM ) , 2 �
(4.32)
˜ UBM is the auwhere β is an update factor for the autoregression matrix and A toregression matrix of the UBM. For diagonal autoregression matrices, the prior density of the autoregression matrices are assumed to be in the form � � β T ˜d,UBM ) (˜ ˜d,UBM ) , p(˜ ad |˜ ad,UBM ) ∝ exp − (˜ ad − a ad − a 2 56
(4.33)
˜d is as defined in subsection 4.2.2. where a The update equations are derived in a very similar way to that followed in section 3.3. Hence, we state them without derivations. For general covariance and autoregression matrices, we have the following update equations. PN (s) (s+1) n=1 Pm,n (λ ) + νm − 1 wm = P N −M + M m=1 νm PN (s) (s) ˜m n=1 Pm,n (λ )e [n] + τm µ µ(s+1) = P m N (s) n=1 Pm,n (λ ) + τm PN (s) (s) (s) T ˜ m) ˜ mµ ˜ Tm + Σ n=1 Pm,n (λ )e [n](e [n]) + τm (µ Σ(s+1) = P m N (s) n=1 Pm,n (λ ) + αm − d − 1 � �P (s+1) (s+1) N (s) (µm )T n=1 Pm,n (λ ) + τm µm − PN (s) n=1 Pm,n (λ ) + αm − d − 1 �
�
(4.34) (4.35)
(4.36)
#−1
"
˜ (s+1) = βI + vec A
X
� (s+1) Pk,n,m (λ(s) ) (yk [n]ykT [n])(Σ−1 m )
×
k,n,m
! ˜ UBM + vec β A
X
(s+1) Pk,n,m (λ(s) )(Σ−1 (xk [n] − µ(s+1) )ykT [n] , m ) m
k,n,m
(4.37) where ˜ (s) y[n]. e(s) [n] = x[n] − A For the case of diagonal covariance matrices and diagonal autoregression matrices, equations (4.36) and (4.37) simplify to PN (s) 2 Pm,n (λ(s) )(ed )2 [n] + τm (˜ µ2m,d + σ ˜m,d ) 2 (s+1) (σd ) = n=1 PN (s) n=1 Pm,n (λ ) + αm − d − 1 �P � (s+1) 2 N (s) P (λ ) + τ m (µm,d ) n=1 m,n − . λ(s) ) + αm − d − 1
(4.38)
and ˜(s+1) a d
=
βI +
X
(s)
Pk,n,m (λ )
k,n,m
T ˜ k,d [n]˜ y yk,d [n]
!−1 ×
(s+1)
(σm,d )2 (s)
βad,UBM +
X
Pk,n,m (λ(s) )
k,n,m
57
xk,d [n] − (µm,d )2 (s+1)
(σm,d )2
! (4.39)
Rather than the differences in the update equations, the training and the classification methodologies are the same.
58
Chapter 5 Generalized maximum likelihood adaptation In this chapter, we basically describe our proposed GML adaptation technique. We consider a particular scenario where the training environment is distortion free but the testing environment is corrupted by band limitation and additive noise with a partially unknown distribution. Similar to the PCM method, we assume a general model for the testing feature vectors, which contains both clean speech parameters and noise parameters. While the clean speech parameters are estimated in the training phase, the distortion parameters are estimated from the feature vectors extracted from corrupted speech in the testing phase. After estimation of the distortion parameters, the ML decision rule is applied in order to determine the most likely speaker of the testing utterance. In Chapter 6, we shall show that such a compensation technique results in an increased robustness of the speaker identification systems against additive and convolutive noise. This chapter is divided into four sections. The main statistical model for distorted speech is described in section 5.1. In section 5.2, we explain how to estimate the distortion related parameters from the given speech. In section 5.3, we modify the model order selection technique, proposed in section 4.3, so that it fits into our GML adaptation framework. Moreover, we propose another approximate but 59
faster version of this model order selection algorithm. A global picture of the GML adaptation technique is illustrated in section 5.4. Finally, in section 5.5, we present a potential application to this GML compensation technique, namely blind equalization of MIMO channels [7].
5.1
Main statistical model
Generally a variety of distortion models may be assumed. Typically, the most two important factors that hamper the classification performance are the spectral distortion caused by the communication channel and the additive noise contaminating the speech signal. The former factor is equivalent to bandpass filtering effect. Modeling the band-limitation as infinite impulse response (IIR) filter, we have the following distortion model for the extracted testing feature vectors, x[1 : N ]. x[n] =
P X
Ap,s x[n − p] + s[n] + e[n],
(5.1)
p=1
where s[n] refers to a hypothetical feature vector extracted from the clean part of the speech signal and e[n] corresponds to the noisy part of the speech. The second subscript s in Ap,s refers to the speaker index. The distribution of s[n] is assumed to be a GMM whose parameters are estimated clean training speech; i.e., p(s[n]|Hs ) =
M X
wm,s N(s[n]; µm,s , Σm,s ).
(5.2)
m=1
The noise vector e[n] follows a speaker-independent Gaussian distribution, N(e[n]; 0, Γ), where Γ is assumed to be unknown. Hence, in the testing phase, the speakerdependent parameters λs = {wm,s , µm,s , Σm,s }M m=1 , s = 1, . . . , S are considered known while the auto-regression matrices and the noise covariance matrices in (5.1) are estimated from the testing feature vectors. In the following sections, we shall denote the distortion parameters by θ.
60
5.2
Model parameter estimation
In this section, we first consider the parameter estimation problem for general autoregressive and covariance matrices given that one of the hypotheses H1 , . . . , HS is true. In order to simplify the notation, we shall drop the speaker index s. It should be stated that the following parameter estimation procedure is repeated for each speaker model as will be illustrated in section 5.2. Other special structures of the autoregressive and the noise covariance matrices are addressed shortly. The likelihood function of the observed data sequence, x[1 : N ], is given by N N � Y � � Y � � � p x[n] x[n − P : n − 1], θ p x[n] x[1 : n − 1], θ = p x[1 : N ] θ =
=
n=1 N X M Y
n=1
˜ wm N(x[n]; Ay[n] + µm , Σm + Γ),
(5.3)
n=1 m=1
i h iT ˜ = A . . . A and y[n] = x[n − 1]T . . . x[n − P ]T . It is clear that where A 1 P ˜ and Σ. Similar to the estimation the likelihood function is highly nonlinear in A h
approaches in chapters 3 and 4, the iterative EM procedure is used to maximize ˜ and Σ. the likelihood function with respect to A Initial guess for the model parameters can be found by fitting the data to the following autoregressive model ˜ x[n] = Ay[n] + e[n],
(5.4)
˜ and Σ given the above where p(e[n]) = N(e[n]; z, Σ). The ML estimates for A ˜ (0) and model are the initial values for the EM algorithm and are denoted by A Σ(0) , respectively. It is straightforward to show that ! N !−1 N X X ˜ (0) = y[n]y[n]T A x[n]y[n]T Σ(0) =
1 T
n=1 N X
(5.5)
n=1
˜ (0) y[n])(x[n] − A ˜ (0) y[n])T (x[n] − A
(5.6)
n=1
For deriving the update equations, the complete data specification in this problem will include the clean data vectors s[n] as well as the index function φ[n], 61
defined before in subsection 3.2.1 will significantly simplify our derivations. Define X = {x[1 : N ]}, Φ = {φ[1 : N ]}, and S = {s[1 : N ]}. The complete log-likelihood function is given by � log p X, Φ, S θ �
=
N X
� � log p x[n], φ[n], s[n] x[1 : n − 1], φ[1 : n − 1], s[1 : n − 1], θ
n=1
=
N � X
� � � � � �� log p φ[n] θ + log p s[n] φ[n], θ + log p x[n] s[n], x[n − P : n − 1], φ[n], θ
n=1
=
N � X
˜ log wφ[n] + log N(s[n]; µφ[n] , Σφ[n] ) + log N(x[n]; Ay[n] + s[n], Γ)
�
(5.7)
n=1
Obviously, the first two terms in the above expression do not contain the parameters ˜ and Γ. Therefore, they can be ignored. Substituting (5.7) into to be estimated: A (3.5), the following expression for the auxiliary function is obtained Q(θ; X, θ(s) ) N n o� 1 X� T −1 (s) ˜ ˜ =c− log |Γ| + E (x[n] − Ay[n] − s[n]) Γ (x[n] − Ay[n] − s[n]) x[1 : N ], θ , 2 n=1
(5.8) where c does not depend on the estimated parameters. Hence, in order to evaluate and optimize the auxiliary function Q(θ; X, θ(s) ), it is necessary to derive smoothed estimates of the first and the second order statistics of s[n] given all the noisy data x[1 : N ]. In order to simplify the notations, define the following smoothed statistics n o ˆs[n] ≡ E s[n] x[1 : N ], θ(s) . n o T (s) R[n] ≡ E s[n]s [n] x[1 : N ], θ . n o ˆs[n|m] ≡ E s[n] φ[n] = m, x[1 : N ], θ(s) n o R[n|m] ≡ E s[n]sT [n] φ[n] = m, x[1 : N ], θ(s) .
62
(5.9) (5.10) (5.11) (5.12)
In appendix A, we prove the following expressions for ˆs[n] and R[n]. ˆs[n] =
R[n] =
M X m=1 M X
Pm,n (θ(s) )ˆs[n|m]
(5.13)
� Pm,n (θ(s) ) R[n|m] + ˆs[n|m]ˆsT [n|m] − ˆs[n]ˆsT [n],
(5.14)
m=1
where (s) ˜ (s) ˆs[n|m] = µ(s) m + Km (x[n] − A y[n] − µm )
R[n|m] = (I − Km )Σ(s) m
(5.15) (5.16)
(s) −1 Km = Σ(s) m (Γ + Σm ) . (s)
(s)
˜ (s) y[n] + µm , Σ(s) + Γ(s) ) wm N(x[n]; A m Pm,n (θ(s) ) = PM (s) (s) (s) (s) (s) ˜ m0 =1 wm0 N(x[n]; A y[n] + µm0 , Σm0 + Γ ) ˜ and Γ are obtained by differentiating the auxiliary The update equations for A ˜ and Γ, performing the expectation in (5.8), and equating function with respect to A the results to zero. These steps are made in appendix A and the following update equations are derived. ˜ (s+1) = A Σ(s+1) =
N X
! (x[n] − ˆs[n])yT [n]
n=1 T � X
1 N
N X
!−1 y[n]yT [n]
(5.17)
n=1
� ˜ (s+1) )(x[n] − ˆs[n])T + R[n] . (x[n] − ˆs[n] − A
(5.18)
t=1
Thus, the model parameters can be initialized using (5.5) and (5.6) and then updated using (5.17) and (5.18). The new model parameters will be the old ones for the next iteration. The iterations stop when the increase in the incomplete loglikelihood function is less than some threshold or a maximum number of iterations is exceeded. Practically, it is desirable to assume special structures for the distortion parameters in order to avoid the curse of dimensionality problem. In addition, the estimation in the testing phase should be done as fast as possible. Therefore, two special structures of the autoregressive and noise covariance matrices are considered: 63
the diagonal structure and the spherical structure, i.e., diagonal and all elements on the diagonal are the same. One more advantage of these assumptions is its consistency with the practical observation that the noise components are statistically uncorrelated. The update equations for both the diagonal and the spherical structures are obtained in a similar way to that followed in the general case. For diagonal autoregression matrices and diagonal noise covariance matrices, the update equations are given by (s+1)
ad
=
N X
!−1 yd [n]yd [n]T
n=1
2(s+1) σd
N X
! (xd [n] − sˆd [n])yd [n]T
(5.19)
n=1
N � 1 X� (s+1) T = Rd [n] + (xd [n] − sˆd [n])(xd [n] − sˆd [n]−(ad ) yd [n]) , (5.20) N n=1
where xd [n], sd [n] are the dth component of x[n] and s[n], respectively, ad is a vector containing the dth elements on the diagonal of A1 , . . . AP , and yd [n] is vector containing the dth elements of x[n − 1], . . . , x[n − P ], in order. The smoothed � estimates sˆd [n] and Rd [n] are defined as sˆd [n] ≡ E sd [n]|x[1 : N ], θ(s) and Rd [n] = � E s2d [n]|x[1 : N ], θ(s) − sˆ2d [n] and calculated using (5.15) and (5.16). For spherical autoregression matrices and spherical noise covariance matrices, h i define a = a1 . . . aP , where Ap = ap I. The update equations are (s+1)
a
=
N X
!−1 T
Y[n] Y[n]
n=1
N X
! T
Y[n] (x[n] − ˆs[n])
(5.21)
n=1
N � 1 X σ = tr(R[n] + (x[n] − ˆs[n])T (x[n] − ˆs[n] − Y[n]a(s+1) ) N D n=1 h i where Y[n] = x[n − 1] . . . x[n − P ] . 2(s+1)
(5.22)
When additive white noise is present, it is evident that the distortion alters the centers of the distribution of the clean signal as well. In this case, the centers µm , m = 1, . . . , M , have to be updated. For deriving the update equation of µm , the expectation of the second term in (5.7) should be evaluated since it is a function
64
in µm . Regardless of the type of the noise covariance matrix, it is straightforward to show that the update equation for the centers µm takes the form. µ(s+1) m
5.3
PN =
(s) sm [n] n=1 Pm,n (θ )ˆ , PN (s) n=1 Pm,n (θ )
(5.23)
Selection of the optimum regression order
In the above section, we outlined a procedure for estimating the proposed adaptation model parameters given that the regression order, P , is known. However, this is not the case in practical applications. Therefore, a fast and an accurate model order selection criterion is necessary. Basically, the model order selection algorithm, proposed in section 4.3, is applied to our GML adaptation as shown in Algorithm 5.1 (the number of the Gaussian components is not estimated). In this context, the information criteria are functions in the regression order only. The AIC, the KIC, and the BIC are given by AIC(P ) = −2 log p(X|θ(P )) + 2|θ(P )|
(5.24)
KIC(P ) = −2 log p(X|θ(P )) + 3|θ(P )|
(5.25)
BIC(P ) = −2 log p(X|θ(P )) + |θ(P )| log N
(5.26)
For convolutive noise, the number of parameters is given by D2 (P + 1) general structure |θ(P )| = D(P + 1) diagonal structure . P + 1 spherical structure
(5.27)
For additive noise, a constant term M D should be added to |θ(P )|. Of course, this method results in a great saving in time but it heavily depends on the proper estimation of the VARGM model with the least order. Alternatively, we may replace the incomplete likelihood function with that obtained by ordinary VAR modeling, i.e., assuming there is only one component when 65
Algorithm 5.1 Selection of the optimal regression order of the GML adaptation algorithm. 1: Inputs: X, M , p(s[n]). 2:
Output: Optimal P and θ(P ).
3:
Estimate the distortion model parameters, θ(0), from the data using the EM algorithm.
4:
Calculate P (X|θ(0)) using (5.7).
5:
Calculate IC(0) using (5.24), (5.25), or (5.26).
6:
for P = 1 to Pmax do
7:
Set θ0 = θ(P − 1) (Copy all the parameters of θ(P − 1) to θ0 ).
8:
Increment the regression order of θ0 by 1.
9:
In θ0 , put AP = 0D×D .
10:
Train θ(P ) using the EM algorithm. Take θ0 as the initial model for the EM algorithm.
11:
Calculate p(X|θ(P )) using (5.7).
12:
Calculate IC(P ) using (5.24), (5.25), or (5.26).
13:
end for
14:
The selected regression order P is given by P ∗ = arg
15:
min
P =1,...,Pmax
IC(P ).
Return θ(P ). This model will be used for adaptation and decision.
66
calculating the likelihood function. Thus, the model selection criteria can be calculated for different orders in a reasonably small time. Let L0 (λ) be the likelihood function corresponding to ordinary VAR modeling. It can be easily proved that log p(X|θ0 ) = − where
N ND ˆ (log(2π) + 1) − log |Σ|, 2 2
N 1 X ˆ ˜ 0 y[n] − µ)(x[n] ˜ 0 y[n] − µ) ˆ ˆ T, Σ= (x[n] − A −A N n=1 ! N !−1 N X X ˜ = A x[n]yT [n] y[n]yT [n] n=1
(5.28)
(5.29)
n=1
N 1 X ˜ 0 y[n]) ˆ= µ (x[n] − A N n=1
The first term in (5.28) is irrelevant to our model selection and hence it can be dropped. Similarly, only the first term in (5.27) is a function in P . Hence, we have the following approximate expressions for the AIC, KIC, and BIC, respectively. ˆ + 2P D2 AIC(P ) ≈ N log |Σ|
(5.30)
ˆ + 3P D2 KIC ≈ N log |Σ|
(5.31)
ˆ + P D2 log(N ). BIC ≈ N log |Σ|
(5.32)
The method is summarized in algorithm 5.2.
5.4
Adaptation using the GML rule
In sections 5.2 and (5.3), we proposed algorithms for estimating the distortion parameters and selecting the optimal regression order assuming that the speaker of the testing utterance is known. In this section, we integrate these algorithms with speaker classification. The GML rule is a multi-class generalization of the binary-class GLRT, successfully applied in adaptive signal detection [12, 3] and
67
Algorithm 5.2 Approximate model order selection for the GML adaptation algorithm. 1: Inputs: X, M , p(s[n]). 2:
Output: Optimal P and θ(P ).
3:
for P = 1 to Pmax do
4:
ˆ using (5.29). Calculate Σ
5:
Use (5.30), (5.31), or (5.32) to calculate the approximate model order selection criterion for order P .
6:
end for
7:
The selected regression order P is given by P ∗ = arg
8:
min
P =1,...,Pmax
IC(P ).
Return θ(P ). This model will be used for adaptation and decision.
voiced-unvoiced speech classification [40]. For binary decision problems, the GLRT decision rule takes the form [66], � � maxθ p x[1 : N ] H0 , θ 0 � � ≷H GLRT = H1 η, maxθ p x[1 : N ] H1 , θ
(5.33)
where θ refers to the unknown distortion parameters and Hi refers to one of the two hypotheses. For multiple-hypotheses classification such as the problems in hand, we replace the GLRT by the GML decision, which takes the form � � ˆi = arg max max p x[1 : N ] Hi , θ . i=1,2,...,S
θ
(5.34)
While the maximization with respect to θ reflects the compensation of the distortion effects, the outer maximization corresponds to the ordinary ML decision rule. Thus, our GML-based speaker identification works as follows. Ordinary processing and feature extraction are applied to the testing utterance and a sequence of the feature vectors is obtained. For each candidate speaker, the clean speech model is substituted by his/her model. The distortion parameters are estimated from the testing feature vectors, as discussed in sections 5.2 and 5.3, and the correspond68
Figure 5.1: The architecture of a GML-based classification system. ing likelihood value is reported. The decided speaker is the one with the highest likelihood value. An equivalent but more intuitive form of the above rule is � � (5.35) θi = arg max p x[1 : N ] Hi , θ , i = 1, ..., S. θ � � ˆi = arg max p x[1 : N ] Hi , θi (5.36) i=1,2,...,S
An architecture for the proposed compensation technique is depicted in figure 5.1.
5.5
Blind equalization of MIMO channels
In this section, we consider another potential application for the proposed GML decision rule: blind equalization of multiple input multiple output MIMO communication systems. Equalization is defined as the process of restoring a set of source signals distorted by an unknown linear (or nonlinear) filter and possibly an additive noise. Since the 1970’s, this problem has been an intensive research topic because it arises in a variety of applications such as speech processing, underwater acoustic, image processing, seismic exploration, and biomedical signal processing. This problem also arises in many digital communication systems such as mobile, wireless communication, sonar, and radar systems. Depending on the available amount of training data used to estimate the channel impulse response, equalization algorithms can be classified into: non-blind, blind, 69
and semi-blind equalization algorithms. While non-blind equalization algorithms fully exploit the channel prior information and the available training data to estimate the channel response, blind equalization algorithms attempt to perform the same task without using any training data in order to increase the bandwidth efficiency [112, 109, 46], i.e., to increase the data throughput while preserving low bandwidth consumption. The need for blind equalization is even more critical for channels with frequency selective fading [52]. Blind equalization techniques can be classified into deterministic [118] and statistical. The deterministic techniques are solely based on the subspace decomposition of the received data matrices and, in the absence of noise, they are able to obtain exact estimates within a finite number of observations. Therefore, it is believed that deterministic techniques perform better than statistically-based method when only few observations are available at the receiver. However, when there is a sufficient number of observations, statisticallybased methods are superior since they account for the existing noise to some extent by exploiting the statistical properties of the given observations. Statistically-based blind equalization algorithms are generally divided into two main categories: those based on second-order statistics (SOS) and those based on higher-order (≥ 3) (HOS) statistics. The main motivation behind using HOS has been that, unlike SOS-based methods, HOS are not blind to the phase of the unknown system [23]. HOS-based methods include the inverse filter criteria (IFC) [16, 10, 21, 22], the super exponential (SE) algorithm [77, 124, 61, 68], the polyspectra-based algorithms [78, 20], and the constant modulus algorithm [117, 116, 11], and many others. On the other hand, many researchers were motivated to use SOS in order to reduce the system complexity. Tong, Xu, and Kailath proposed blind equalization of single input multiple output (SIMO) channels using only SOS of systems output [113]. However, the extension to the MIMO channels is not straightforward as long as the system inputs are temporally white. Hua and Tungait proved the identifiability of an MIMO FIR system using SOS when the system inputs are temporally colored. Meanwhile, SOS-based blind equalization algorithms have been reported for the case of temporally white inputs [2]. 70
In [120], the scalar autoregressive model was proposed to equalize ASK modulated signals when transmitted through a SISO channels. In this section, we generalize their approach to deal with MIMO channels. We extend their method in two ways. First, complex time series are considered instead of real ones. This enables us to deal the baseband representation of modulated signals. In addition, and unlike [120], we consider the estimation of the CSI matrix. Moreover, it will be shown that the proposed method can be used in both equalizing the channel effects and estimating the frequency response of the communication channel. In particular, we prove that under some reasonable conditions, the MIMO channel can be modeled by our proposed VARGM model. The parameters of the VARGM model are estimated from the received symbols using the EM algorithm [29]. The estimated VARGM filter is then used to equalize the communication channel. A Bayesian decision rule is applied to the filter output in order to decide about the transmitted symbols. The proposed technique depends only on SOS and hence, it is easy to implement. Moreover, the proposed algorithm requires no prior knowledge of neither the channel response nor the SNR at the receiver. It should be mentioned that the EM algorithm was used before with nonlinearly modulated signals [81, 65, 24] and recently for linearly modulated SISO channels [82]. In all these papers, the received symbols were modeled by an HMM. Typically, the expectation step is performed using either the forward-backward algorithm [65, 24] or the Viterbi-decoding algorithm [81, 82]. That is, in each iteration of the EM algorithm, the expectation step requires a search among many state sequences. This may be time consuming for many practical applications. On the other hand, the parameter estimation of the VARGM model is much faster since, in each iteration, the parameters are just some statistics of the observed symbols. Moreover, the likelihood function calculation is much simpler and hence fast model selection criteria are implemented in our proposed system. This section is organized as follows. In subsection 5.5.1, the blind equalization problem is formulated. Sufficient conditions for the validity of modeling channels
71
by a VARGM model are also given in this subsection. In addition, we clarify the similarity between the MIMO equalization problem and the proposed GML adaptation technique. In subsection 5.5.2, we shall show how to estimate the VARGM model parameters using the EM. The model order selection algorithm is very similar in principle to that explained in section 5.3, and hence, we omit it. Finally, the proposed equalization algorithm is explained in details in subsection 5.5.3.
5.5.1
Problem formulation
Consider a MIMO communication channel with NT transmitters and NR receivers. In this thesis, we consider only channels that suffer from slow fading. Therefore, it is reasonable to assume that the channel response does not change significantly during the transmission of a single block of symbols. The complex baseband representation of a MIMO channel is usually modeled by the following relation [114]. x[n] =
Q X
Hi s[n − i] + �[n],
(5.37)
i=0
where s[n] is an NT × 1 complex baseband vector representation of the transmitted signals at time n, x[n] is an NR × 1 complex baseband vector representation of the received signals at time n, and �[n] is an NR × 1 baseband vector representation of the additive white Gaussian noise (AWGN) at time n. The matrices Hi , i = 1, 2, .., Q represent the CSI. Each noise vector follows the complex Gaussian ˜ which distribution with a zero mean vector and an arbitrary covariance matrix Σ, is sometimes assumed to be diagonal. The noise random vectors are assumed to be independent and identically distributed. The equalization of the above MIMO channel is defined as estimating the transmitted sequence s[n], n = 1, 2, ..., N given some noisy sequence x[n], n = 1, 2, ..., N observed at the receivers. The image of (5.37) in the z−domain is X(z) =
Q X
! Hi z −i
S(z) + ε(z)
i=0
= H(z)S(z) + ε(z), 72
(5.38)
where X(z), S(z), and ε(z) are the z−transforms of x[n], s[n] and �[n], respectively. The matrix H(z) can be interpreted as the transfer function of the MIMO channel filter. Equation (5.37) takes the form of a vector moving average (VMA) model. In this thesis, we propose inverting this model to an appropriate VAR model because it is easier to identify and equalize a MIMO channel when it is characterized by a VAR model. In the following theorem we shall show sufficient conditions under which this inversion is possible. Theorem 1 If the channel transfer matrix H(z) can be expressed as the product P c Ci z −i is of size NR × NR of a full rank square matrix C −1 (z), where C(z) = ni=1 with |C(z)| = 6 0∀|z| > 1and an irreducible full column rank rectangular matrix Pnb B(z) = i=1 Bi z −i of size NR × NT and if NR > NT , then there exists at least one P finite-degree transfer matrix A(z) = INR − Pi=1 Ai z −i , where INR is the identity matrix of size NR × NR such that A(z)H(z) = H0 = H(∞), ∀z
(5.39)
2nc + (NT + 1)nb ≤ P < ∞
(5.40)
and
The proof of this theorem is given in appendix B. The matrix A(z) can be regraded as the MIMO channel equalizer. The above conditions are satisfied for most practical systems [122, 46]. Thus, if the channel transfer matrix, H(z), satisfies the conditions in Theorem 1, the given system in (5.37) can be inverted by simply multiplying A(z) from the left for both sides of (5.38), yielding A(z)X(z) = A(z)H(z)A(z) + A(z)ε(z), or x[n] =
P X
Ai x[n − 1] + H0 s[n] + e[n],
i=1
73
(5.41)
where e[n] = �[n] −
P X
Ai �[n − 1].
i=1
Note that the vectors e[n], n = 1, 2, ..., N are identically distributed (but possibly dependent); each follows the complex Gaussian distribution with zero mean vector ˜ and Ai , i = 1, 2, ..., P . and arbitrary covariance matrix Σ, which is a function of Σ Denoting the possible transmitted symbols by s1 , s2 , ..., sM , the distribution of the sequence H0 s[n] + e[n] is a complex Gaussian mixture model. The number of Gaussian components is the size of the symbol set, M and the covariance matrices of all components are the same. Moreover, the centers of the Gaussian components are µm = H0 sm , m = 1, 2, ..., M .1 The transmitted symbols depend on the modulation scheme used but always known to the receiver in advance, and hence, they are treated as constants. The VARGM model parameters can be collectively represented by the string λ = {w1 , . . . , wM , Σ, A1 , . . . , AP , H0 }. Thus, upon the conditions mentioned above, the equalization problem can be reformulated as follows. Given some received symbols that are modeled by the relation x[n] =
P X
Ai x[n − i] + H0 s[n] + e[n],
(5.42)
i=1
where e[n] is a zero-mean complex Gaussian random vector, find the ML-estimate of the transmitted symbols s[n]. Comparing the equalization model (5.42) to the adaptation model (5.1) in section 5.1, we notice the analogy between the two models. The transmitted symbol vector, s[n], corresponds to the feature vector of the clean speech while the received symbol vector, x[n], corresponds to the feature vector of the corrupted speech. To equalize the MIMO channel, we need to determine the best regression order, P , and estimate the equalizer filter, A(z), and the noise covariance matrix, Σ as we 1
Actually, in most practical applications all symbols are equally likely to be transmitted.
However, in this thesis, we prefer to consider a more general framework.
74
did before in the GML adaptation problem. Furthermore, the distribution of s[n] is completely known prior to adaptation in (5.1) or equalization in (5.42). However, there are some differences between the estimation problems. First, the equalization system is not square, i.e., the number of outputs (receivers) in (5.42) is not equal to the number of inputs (transmitters). Second, there is a channel matrix, H0 , which has to be estimated for equalization. Furthermore, the transmitted vector, s[n], follows a discrete distribution rather the GMM distribution in the GML adaptation case2 . In addition, we have to consider complex random variables rather than real ones. Nonetheless, and despite these differences, the estimation algorithm of the equalizer filter parameters is conceptually analogous to that followed in section 5.2 as we shall see shortly. In this thesis, we propose a four-step procedure for solving this problem. First, the received signal, x[n], is fitted into (5.42) using the EM algorithm. Second, the channel equalizer A(z) is constructed and used to filter the received signal, x[n]. The Bayesian decision rule is then applied to the filter output in order to determine the most-likely transmitted symbols. Finally, a simple algorithm is proposed and applied to resolve possible permutation and phase ambiguities in the final equalizer output.
5.5.2
Parameter estimation of the equalizer filter
Given some observed sequence x[1 : N ], it is required to find the maximum likelihood estimates of the model parameters. The likelihood function of the observed sequence is given by p(x[1 : N ]|λ) =
= 2
N Y
p(x[n]|x[1 : n − 1], λ)
n=1 N Y
M X
n=1
m=1
! ˜ wm CN (x[n]− Ay[n]; H0 sm , Σ) ,
(5.43)
In fact, the distribution of s[n] can be also considered as a GMM with zero covariance matrices.
75
where h i ˜ ≡ A A ... A , A 1 2 P h iT y[n] ≡ xT [n − 1] xT [n − 2] ... xT [n − P ] , and CN (x; µ, Σ) refers to the complex Gaussian distribution with (complex) mean vector µ and covariance matrix Σ, given by CN (x; µ, Σ) = where
†
1 π D |Σ|
� exp −(x − µ)† Σ−1 (x − µ) ,
(5.44)
denotes conjugate transpose. In (5.43), it is assumed that x[n] = 0 when-
ever n < 0. Since the likelihood is nonlinear in the model parameters, the EM algorithm is used for estimating the VARGM model parameters in the ML sense. For the problem in hand, the complete data specification is similar to that used with the VARGM model, i.e., Z = {Φ, X}, where X is the set of received vectors, Φ = {φ[1 : N ]} and φ[n] is the index of the symbol selected at time n. It is straightforward to show that the auxiliary function for our proposed VARGM model is given by X � Q(λ; λ(s) , X) = −NR N log(π)−N log |Σ|+ Pn,m (λ(s) ) log wm − em [n]† Σ−1 em [n] , m,n
(5.45) where
P
m,n
is a short hand for
PM
m=1
em [n] = x[n] −
PN
n=1 ,
P X
Ai x[n − i] − H0 sm ,
i=1 (s)
(s)
˜ (s) y[n]; H sm , Σ) wm CN (x[n]− A 0 Pn,m (λ(s) ) = PM . (s) (s) (s) ˜ 0 w CN (x[n]− A y[n]; H s ) 0 0 m 0 m =1 m
(5.46)
˜ it is more Since Q(λ; λ(s) , X) is a real function in complex variables H0 and A, convenient to employ the Wirtinger calculus [81, 55] for optimizing Q(λ; λ(s) , X). For a complex vector z, the differential operators stant) and
∂ ∂z∗
∂ ∂z
(where z∗ are treated as con-
(where z are treated as constant) yield the same result obtained
by separate differentiation with respect to the real and the imaginary part of the function. Wirtinger proved that the complex differential operators are given by � � ∂ 1 ∂ ∂ ≡ − , ∂z 2 ∂