Zhang et al. BMC Genomics (2015) 16:685 DOI 10.1186/s12864-015-1825-5
RESEARCH ARTICLE
Open Access
Whole transcriptomic analysis of the plant-beneficial rhizobacterium Bacillus amyloliquefaciens SQR9 during enhanced biofilm formation regulated by maize root exudates Nan Zhang1†, Dongqing Yang1†, Dandan Wang1, Youzhi Miao1, Jiahui Shao1, Xuan Zhou1, Zhihui Xu1, Qing Li1, Haichao Feng1, Shuqing Li1, Qirong Shen1,3* and Ruifu Zhang1,2,3*
Abstract Background: Bacillus amyloliquefaciens SQR9 is a plant growth-promoting rhizobacteria (PGPR) with outstanding abilities to enhance plant growth and to control soil-borne diseases. Root exudates is known to play important roles in plant-microbe interactions. To explore the rhizosphere interactions and plant-beneficial characteristics of SQR9, the complete genome sequence as well as the transcriptome in response to maize root exudates under biofilm-forming conditions were elucidated. Results: Maize root exudates stimulated SQR9 biofilm formation in liquid culture, which is known to be positively correlated with enhanced root colonization. Transcriptional profiling via RNA-sequencing of SQR9 under static conditions indicated that, at 24 h post-inoculation, root exudates stimulated the expression of metabolism-relevant genes, while at 48 h post-inoculation, genes related to extracellular matrix production (tapA-sipW-tasA operon) were activated by root exudates. The individual components in maize root exudates that stimulated biofilm formation included glucose, citric acid, and fumaric acid, which either promoted the growth of SQR9 cells or activated extracellular matrix production. In addition, numerous groups of genes involved in rhizosphere adaptation and in plant-beneficial traits, including plant polysaccharide utilization, cell motility and chemotaxis, secondary antibiotics synthesis clusters, and plant growth promotion-relevant, were identified in the SQR9 genome. These genes also appeared to be induced by the maize root exudates. Conclusions: Enhanced biofilm formation of B. amyloliquefaciens SQR9 by maize root exudates could mainly be attributed to promoting cell growth and to inducing extracellular matrix production. The genomic analysis also highlighted the elements involved in the strain’s potential as a PGPR. This study provides useful information for understanding plant-rhizobacteria interactions and hence for promoting the agricultural applications of this strain. Keywords: Plant growth-promoting rhizobacteria, Genome, Root exudates, Biofilm, Transcriptome
* Correspondence:
[email protected];
[email protected] † Equal contributors 1 Jiangsu Key Lab for Organic Solid Waste Utilization, National Engineering Research Center for Organic-based Fertilizers, Jiangsu Collaborative Innovation Center for Solid Organic Waste Resource Utilization, Nanjing Agricultural University, 210095 Nanjing, China Full list of author information is available at the end of the article © 2015 Zhang et al. Open Access This article is distributed under the terms of the Creative Commons Attribution 4.0 International License (http://creativecommons.org/licenses/by/4.0/), which permits unrestricted use, distribution, and reproduction in any medium, provided you give appropriate credit to the original author(s) and the source, provide a link to the Creative Commons license, and indicate if changes were made. The Creative Commons Public Domain Dedication waiver (http://creativecommons.org/publicdomain/zero/1.0/) applies to the data made available in this article, unless otherwise stated.
Zhang et al. BMC Genomics (2015) 16:685
Background Plant growth-promoting rhizobacteria (PGPR) are a group of rhizosphere-colonizing bacteria that can promote plant growth and control soil-borne diseases, which are of great importance in both basic and applied microbiology [1, 2]. Bacillus spp. are important members of the PGPR, and have been commercially exploited as biofertilizers and biocontrol agents [3, 4]. Complete genome sequencing of several plant-associated Bacillus amyloliquefaciens strains, including FZB42, CAU B946, and YAU B9601-Y2, have revealed functional genes involved in growth promotion (genes related to the synthesis of plant hormones) and disease control (gene clusters involved in nonribosomal synthesis of lipopeptides and polyketides with antibiotic activity) [4–7]. Detailed investigations of the interactions between plants and root-associated PGPR have been performed to determine the requirements for the bacteria to adapt and colonize roots, providing useful information regarding the potential applications of the PGPR strains in agriculture [8, 9]. Increasing evidence supports the notion that plantbacteria interactions mainly occur in the rhizosphere and are regulated by root exudates [10–14]. For instance, flavonoids secreted by roots of leguminous plants are known to play an important role in the early signaling events of legume-rhizobia interactions [12]; while organic acids, such as malic acid and citric acid, in root exudates recruit Bacillus strains in the rhizosphere [15, 16]. High-throughput strategies, including microarray analyses [8, 9, 17, 18], cDNA-based suppression-subtractive hybridization [19], and promoter trapping [20], have been applied to investigate bacterial interactions with root exudates (in vitro) and with the root surface (in vivo). The groups of genes involved in plant-microbe interactions consist mainly of (families of) genes involved in metabolism, bacterial motility and chemotaxis, transport, secretion, and antibiotics production [8, 9, 17, 18, 21]. Next-generation sequencing (NGS) technologies have provided new opportunities to perform whole-genome sequencing and to investigate dynamic transcriptomes [22]. In addition, NGS methods for RNA analysis (including RNA-Seq) have been used in studies of small regulatory RNAs [23] and genome annotation [24]. These technologies have been especially useful in measuring the transcript expression levels under different conditions [25, 26], both for eukaryotes [27, 28] and prokaryotes [24]. Such high-throughput techniques are time-saving and useful in investigating the uncharacterized genes. Compared with conventional strategies, such as microarray analysis, RNA-Seq offers a better way to study root exudates-bacterium interactions. B. amyloliquefaciens SQR9 was isolated from the plant rhizosphere and is able to reduce attack by the phytopathogenic fungus Fusarium oxysporum f. sp. cucumerinum J. H. Owen (FOC) through efficient root colonization followed
Page 2 of 20
by production of antifungal metabolites [29–32]. SQR9 colonizes roots more efficiently and promotes plant growth better than other root-associated Bacillus strains [33]. Products derived from SQR9 are also widely used in agriculture in China under the BIO™ trademark. Therefore, B. amyloqiquefaciens SQR9 could be regarded as an ideal PGPR strain for exploring rhizoshphere plant-microbe interactions. Biofilm formation has been found to be crucial to colonization and expression of beneficial traits by PGPR strains [34, 35]. Importantly, it was found that the in vitro addition of maize root exudates could stimulate biofilm formation of SQR9. Although several studies have explored the plant-microbe interactions through different highthroughput approaches, few investigations have been performed under biofilm-formation condition. In this study, to further explore the mechanisms involved in enhanced biofilm formation of SQR9 as regulated by maize root exudates, as well as its regulatory roles on other PGP-relevant functional genes, the complete genome sequence of SQR9 was determined by Roche 454 pyrosequencing to provide a the reference map for transcriptomic analysis. Then, the transcriptional profiling was investigated by Illumina RNA-Seq. The results of this study reveal the genetic basis of rhizosphere adaption and plant beneficial effects of SQR9, which are crucial for understanding plant-rhizobacteria interactions and improving the application of this strain in agriculture.
Results Plant-beneficial activities of Bacillus amyloliquefaciens SQR9
Greenhouse experiments were performed to evaluate the effects of B. amyloliquefaciens SQR9 on the growth of maize, one of the most important and widely-planted grain crops in the world. To avoid the confounding influence of mycoprotein on seedlings, equal amounts of inactivated SQR9 cells were used as a control. The results revealed that SQR9 significantly promoted the growth of maize plants. When live bacterial suspensions were applied, maize biomass, shoot height, root length, and root surface area were significantly greater than the control by 42–60 %, 32–46 %, 33–49 %, and 29–59 %, respectively (Table 1). This outstanding plant-promoting performance indicates that SQR9 can be regarded as an ideal PGPR agent. Interaction of maize and B. amyloliquefaciens SQR9: root colonization and stimulation of biofilm formation by root exudates
Understanding of the interaction mechanisms between host plants and PGPRs is important for practical application of these agents. Root colonization of inoculated PGPR agents is considered as a prerequisite for successful growth promotion and biocontrol activities [36]. Confocal laser scanning microcopy (CLSM) indicated that, after 5 days of incubation in a gnotobiotic soil system, the green
Zhang et al. BMC Genomics (2015) 16:685
Page 3 of 20
Table 1 Effect of Bacillus amyloliquefaciens SQR9 on the growth of maize seedlings Dry weight (g)
Height (cm)
Root length (cm)
Root surface area (cm2)
CK1
3.59 ± 0.45c
50.81 ± 5.61c
1335.87 ± 26.65c
354.74 ± 14.58c
CK2
3.86 ± 0.23c
51.84 ± 3.64c
1351.42 ± 26.89c
355.55 ± 11.57c
T1
5.08 ± 0.62b
67.08 ± 2.67b
1775.04 ± 20.79b
458.47 ± 13.76b
T2
6.16 ± 0.45a
75.81 ± 3.43a
2016.47 ± 54.66a
564.27 ± 15.63a
Treatment
Different letters indicate significant differences at P < 0.05 using Duncan’s multiple range tests. CK1: seedlings inoculated with suspensions of 5 mL inactivated bacteria (108 CFU · mL-1); CK2: seedlings inoculated with suspensions of 10 mL inactivated bacteria (108 CFU · mL-1); T1: seedlings inoculated with suspensions of 5 mL bacteria (108 CFU · mL-1); T2: seedlings inoculated with suspensions of 10 mL bacteria (108 CFU · mL-1). Plants were grown in a greenhouse for 55 days (n = 10)
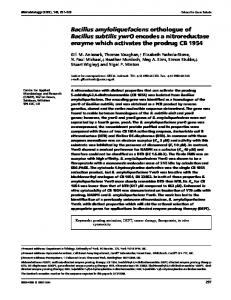
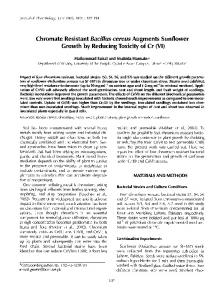
fluorescence protein (GFP)-tagged SQR9 cells colonized the maize root very well and formed biofilms on the roots with a density of approximately 1.8 × 10⁶ CFU · g-1 root (Fig. 1). Root colonization of Bacillus strains was indicated to be positively correlated with their ability to form biofilms under laboratory condition [31, 35, 37]. Since root exudates are important in rhizosphere dialogues and in biofilm formation on plant roots by PGPR strains [1], static culture assays were performed to evaluate the effects of maize root exudates of various concentrations on SQR9 biofilm formation. The addition of 1 × and 2 × maize root exudates in 1/2 MSgg medium significantly enhanced the biofilm formation of SQR9 compared with the control, as revealed by both increased biomass and more complex architecture observed using CLSM (Fig. 2; Additional file 1: Figure S1); these two treatments did not differ significantly from one another. The 0.5 × root exudates also stimulated biofilm formation not significantly so (Additional file 1: Figure S1). Experiments design for investigating the transcriptional profiling of SQR9 in response to maize root exudates during biofilm formation
To investigate the regulatory roles of maize root exudates on the rhizosphere behavior of SQR9, especially the
a
mechanisms involved in the induced biofilm formation, a high-throughput Illumina RNA-Seq was performed to study the transcriptomic response of SQR9 to maize root exudates. Based on the results obtained above, a 1 × concentration of maize root exudates was used in this experiment. Considering the dynamics curves of biofilm formation, cells were collected and RNA extracted 24 and 48 h post-inoculation, which represented the midexponential phase (biomass quickly increasing) and stationary phase (biomass peaked and remained stable) during the biofilm formation, respectively (Additional file 1: Figure S1). Thus, two treatments (addition of 1× maize root exudates or the negative control) and two sampling points (24 and 48 h post-inoculation) for cell harvesting were used in the transcriptomic analysis (see Methods). Genomic analysis of Bacillus amyloliquefaciens SQR9
To provide a mapping background for the transcriptomic analysis, whole-genome sequencing of SQR9 was performed using Roche 454 high-throughput pyrosequencing technology. The general features of the SQR9 genome and other relevant Bacillus strains are summarized in Table 2. The single circular chromosome (4,117,023-bp) with a GC content of 46.1 % encodes 4,078 predicted proteins, 72 tRNA genes, 7 rRNA operons, 218 prophages-associated genes, and 358
b
50 µm
50 µm
Fig. 1 Colonization of maize roots by SQR9-gfp cells. Uninoculated control roots of maize seedlings (a) and roots inoculated with SQR9-gfp cells (b) were imaged by confocal laser scanning microscopy (CLSM) at 5-days post-inoculation
Zhang et al. BMC Genomics (2015) 16:685
Page 4 of 20
a Biofilm formation (OD570)
4.50
**
4.00 3.50 3.00
**
2.50
2.00 1.50 24-h
48-h Control
b a
Root exudates
c
b
d
c a b
c
d
0 50 0
100 200
300
400 500
600
0
100
200
300
400
500
600
700
0 40
600
700
500
80
300
400
200 0
100 200
300
400 500
600
0
100
Fig. 2 Effects of concentrated maize root exudates on biofilm formation of SQR9. a Effects of maize root exudates on the biomass of biofilm formed by SQR9. Data with asterisks were significantly different from the control at each time point (*, P < 0.05; **, P < 0.01; t test). b Effects of root exudates on the appearance of biofilm formed by SQR9: a, Control, 24 h post-inoculation; b, Treatment with maize exudates, 24 h post-inoculation; c, Control, 48 h post-inoculation; d, Treatment with maize exudates, 48 h post-inoculation). c Effects of root exudates on the three-dimensional structure of a biofilm formed by SQR9 visualized by confocal laser scanning microscopy (CLSM) 24 h post-inoculation. a, c. Control; b, d. Treatment with maize root exudates
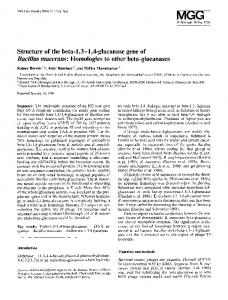
non-coding RNAs (Fig. 3; Additional file 2: Table S1). The core genomes of SQR9 and four other closely related Bacillus strains (B. subtilis strain 168 and B. amyloliquefaciens strains FZB42, DSM7T, and B9601-Y2) consists of 3,014
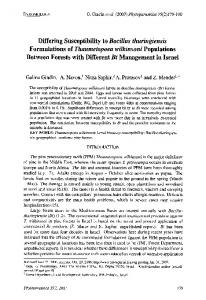
orthologous genes and a pan genome size of 5,643 orthologous genes, among which 309 genes were unique to SQR9 (Fig. 4; Additional file 3: Table S2). Pairwise genome and gene order comparisons suggested that the majority of the
Zhang et al. BMC Genomics (2015) 16:685
Page 5 of 20
Table 2 Genomic features of the Bacillus amyloliquefaciens SQR9 genome. The SQR9 genome was compared with those of Bacillus subtilis 168 and three other B. amyloliquefaciens strains Features
B. amyloliquefaciens SQR9
FZB42
DSM7T
B9601-Y2
B. subtilis 168
Genome size (bp)
4,117,023
3,918,589
3,980,199
4,242,774
4,214,630
G + C content (mol %)
46.1
46.4
46.1
45.85
43.5
Protein-coding sequences
4078
3693
3921
3989
4106
Average CDS size (bp)
916
933
888
927
895
Percent of coding region
89 %
88 %
87 %
87 %
87.2 %
Ribosomal RNA operons
7
10
10
10
10
Number of tRNAs
72
89
94
91
86
Phage-associated genes
218
44
n.r.
n.r.
268
Transposase genes of IS elements
28
9
n.r.
24
0
n.r., not reported
SQR9 protein-encoding sequences were conserved in 168 and FZB42 (Additional file 4: Figure S2). An ortholog analysis within the three strains revealed that 304 genes were shared by SQR9 and FZB42, while only 156 genes were shared by SQR9 and 168 (Fig. 4; Additional file 5: Table S3). A phylogenetic tree constructed from the core genomes of SQR9 and 17 additional Bacillus strains indicated that SQR9 belonged to the B. amyloliquefaciens group (Additional file 6: Figure S3). Genomic islands (GI) prediction by IslandViewer and MGCAT identified 11 large regions of genomic plasticity (Additional file 7: Table S4). Importantly, GI3 was a unique mobile genomic fragment that is not found in the genomes of other Bacillus strains. It consists of genes related to the biosynthesis of an unknown polyketide (Additional file 8: Figure S4).
cassette (ABC) transporters (Table 4). The remaining 200 genes were annotated to encode putative enzymes, hypothetical proteins, and proteins with unknown function. Once the biofilm had matured, at 48 h post-treatment, most of the differentially expressed genes were down-regulated. Of the 1,024 differentially regulated genes, 758 with known functions were mainly assigned to functions related to metabolism, transporters, transcription regulation, cell motility, and chemotaxis (Table 4). Though there were some differences in the fold changes of several significantly regulated genes between real-time PCR and RNA-Seq, the general trends were consistent between each other, suggesting that the RNA-Seq data were convincible (Additional file 11: Table S5). These differences were probably caused by use of different methods, which could be also observed in previous studies [9, 38].
Overall transcriptional profiling of SQR9 in response to maize root exudates during the biofilm formation process
Genome and transcriptional analyses indicate that maize root exudates enhances SQR9 biofilm formation by both growth promotion and extracellular matrix induction
The RNA-Seq generated approximately 10 million reads for each sample, of which 60–70 % were confirmed to be valid after filtering reads with Phred quality scores of < 20 using FASTX-Toolkit version 0.0.13.2 (http://hannonlab.cshl.edu/ fastx_toolkit/index.html). The rarefaction curves revealed that the sequence throughput was sufficient to cover the whole SQR9 genome (Additional file 9: Figure S5), suggesting that the data were adequate for transcriptomic profiling studies. Based on the standards for identifying genes with significantly different expression levels between different treatments [expression fold-change ≥ 1.5, q-value ≤ 0.001 (false discovery rate, FDR), and a RPM (reads per million) consistently above 10 in at least one treatment], genes representing roughly 15.8–25.1 % of the SQR9 transcriptome were significantly regulated by the addition of root exudates as compared with control (Table 3; Additional file 10: Figure S6). Of the 643 significantly affected genes after the 24-h incubation, 443 were annotated with known functions; most belonged to the categories of metabolism and ATP-binding
Bacterial biofilms are ubiquitous communities of tightly associated cells encased in an extracellular matrix [39]. Biofilm formation might be affected by both the cell population and extracellular matrix production within the communities. Here, whole transcriptomic information revealed the regulatory roles of maize root exudates on biofilm formation of SQR9. Root exudates stimulates the metabolism of SQR9 in the exponential phase
After 24 h of incubation in maize root exudate, 98 genes relevant to carbohydrates/amino acids metabolism were significantly differentially regulated; of these, 75 were activated. In detail, three genes encoding enzymes involved in the Embden-Meyerhof-Parnas (EMP) pathway (gapB and fbaB) and the tricarboxylic acid (TCA) cycle (sucC) were upregulated (Figs. 5 and 6c; Additional file 12: Table S6). Other up-regulated genes related to carbohydrate metabolism included those involved in use of inositol (iol cluster), mannitol
Zhang et al. BMC Genomics (2015) 16:685
Page 6 of 20
Fig. 3 Circular map of the Bacillus amyloliquefaciens SQR9 genome. The gene expression profiles in response to maize root exudates are also shown. 1st circle: all genes in color code according to function: orange, information storage and processing; green, cellular processes and signaling; purple, metabolism; red, poorly characterized, red; gray, unknown; 2nd and 3rd circle: gene expression responses to root exudates after inoculation for 24 h and 48 h, respectively; 4th circle: the numbered 11 DNA islands (green); 5th circle: rRNAs (orange) and tRNAs (blue); 6th circle: prophages (green) and IS elements (red); 7th circle: GC content; 8th circle: GC skew. The highlighted area of gray is a conserved genomic island of SQR9, and the green area is a shared prophage with Bacillus subtilis 168
(mtlD), hexulose (hxlA), and other carbon sources. Also genes involved in the metabolism of amino acids, including alanine (dat, alaT), glutamate (gltD, gltA), lysine (kamA), and aspartate (dapG), were induced by root exudates (Figs. 5 and 6c; Additional file 12: Table S6). In addition, numerous genes annotated as phosphotransferase system (PTS) or sugar transporters, as well as citH encoding for citrate
transporter, were activated by root exudates (Figs. 5 and 6b; Additional file 12: Table S6). These data, together with the observation that adding maize root exudates significantly enhanced the growth of SQR9 cells under aeration (data not shown), indicate that root exudates can stimulate the metabolism and cell growth of SQR9, thereby leading to a higher cell population.
Zhang et al. BMC Genomics (2015) 16:685
Page 7 of 20
T
Fig. 4 Venn diagram showing the genes encoded by four Bacillus amyloliquefaciens strains and Bacillus subtilis 168. The core genes are those located at the intersection of the five circles
In contrast, most of the differentially regulated genes involved in metabolism of carbohydrates (53 out of 56 genes), including seven in the EMP pathway and eight in the TCA-cycle, and amino acid/related molecules (27 of 41), were inhibited by root exudates at 48 h post-treatment (Figs. 5 and 6c; Additional file 12: Table S6). As expected, down-regulation of numerous genes related to PTS or sugar transporters was observed. In contrast, several genes involved in amino acid/peptide (glnQHM, yveA, appC, etc.), ferrichrome (yclN, yclO), Mg2+ (sapB), and phosphate (pst cluster) uptake were activated (Figs. 5 and 6b; Additional file 12: Table S6). Root exudates induces extracellular matrix production by SQR9 in the stationary phase
The genetic regulation pathways of biofilm formation of B. subtilis (including B. amyloliquefaciens) have recently been summarized [39]. The SQR9 genome contains the complete set of relevant genes, including extracellular matrix production genes (epsA-O for exopolysaccharide synthesis, tapAsipW-tasA for extracellular protein production, and bslA for self-assembling the bacterial hydrophobin that coats the biofilm) and regulatory genes (Spo0A ~ P-AbrB/SinI-SinR Table 3 Numbers of significantly differentially expressed genes in the presence and absence of root exudates Items
Up-regulated
Down-regulated
RE/Control_24h
382 (9.4 %)
261 (6.4 %)
RE/Control_48h
260 (6.4 %)
764 (18.7 %)
The percentages in parentheses represent the ratios of differentially expressed gene numbers to those of the whole genome (4,078 coding sequences)
pathway, YwcC-SlrA-SlrR pathway, and DegQ pathway) (Fig. 5; Additional file 13: Table S7). At 24 h post-inoculation, the expressions of the genes related to biofilm formation and involved in extracellular matrix production were not significantly altered, whereas at 48 h post-inoculation the abrB gene, a negative regulator of extracellular matrix production and root colonization [31, 39], was down-regulated by root exudates. As a result, the tapA-sipW-tasA operon responsible for extracellular matrix production was activated in the presence of root exudates (Figs. 5 and 6f; Additional file 12: Table S6). In addition, a small regulatory protein (degQ) that stimulates phosphotransfer from DegS ~ P to DegU [40], was activated. Increasing the phosphorylation level of DegU enhanced the biofilm formation and root colonization of SQR9 [37]. In summary, the RNA-Seq data suggests that maize root exudates stimulates the metabolism and growth of SQR9 in the exponential phase, whereas it induces extracellular matrix production in the stationary phrase. Specific components in maize root exudates stimulate biofilm formation of SQR9 through different mechanisms
For a better understanding of the chemical composition of and the presence of potential signal compounds in maize root exudates, the exudates was collected as described in the Methods and analyzed by gas chromatography–mass spectrometry (GC-MS) as described by Badri et al. [41]. The results indicated that the maize root exudates was mainly composed of carbohydrates, sugar alcohols, glycosylamines, carboxylic acids, phenolic acids, and amino acids. Glucose and xylose were found to be the most
Zhang et al. BMC Genomics (2015) 16:685
Page 8 of 20
Table 4 Functional categories of SQR9 genes that were significantly regulated by the maize root exudates Functional class
Table 4 Functional categories of SQR9 genes that were significantly regulated by the maize root exudates (Continued)
24-h
48-h
1.1 Cell wall
14
39
1.2 Transport/binding proteins and lipoproteins
80
75
1.3 Sensors (signal transduction)
4
14
13
23
1.5 Mobility and chemotaxis
18
49
1.6 Protein secretion
1
9
1.7 Cell division
2
19
1.8 Sporulation
47
44
1.9 Germination
6
2
1 Cell envelope and cellular processes
1.4 Membrane bioenergetics (electron transport chain and ATP synthase)
1.10 Transformation/competence
1
2 Intermediary metabolism 2.1 Metabolism of carbohydrates and related molecules 2.1.1 Specific pathway
52
41
2.1.2 Main glycolytic pathways
2
7
2.1.3 TCA cycle
1
8
43
41
2.2 Metabolism of amino acids and related molecules 2.3 Metabolism of nucleotides and nucleic acids
17
30
2.4 Metabolism of lipids
20
28
2.5 Metabolism of coenzymes and prosthetic groups
24
51
2.6 Metabolism of phosphate
2
1
2.7 Metabolism of sulfur
2
2
3.1 DNA replication
1
12
3.2 DNA restriction/modification and repair
2
19
3 Information pathways
3.3 DNA recombination
8
3.4 DNA packaging and segregation
4
3.5 RNA synthesis
25
3.6 RNA modification
66 18
3.7 Protein synthesis
2
51
3.8 Protein modification
2
15
3.9 Protein folding
2
1
4 Other functions 4.1 Adaptation to atypical conditions
18
25
4.2 Detoxification
18
25
4.3 Antibiotic production
6
10
4.4 Phage-related functions
15
15
4.6 Miscellaneous
4
5
443
758
5.1 From Bacillus
119
154
5.2 From other organisms
32
53
Total (with known function) 5 Proteins of unknown function that are similar to other proteins
6 No similarity
49
59
Total
643
1024
Functional categories were according to SubtiList (http://genolist.pasteur.fr/SubtiList/help/function-codes.html)
prominent carbohydrates. Also detected were amino acids (e.g., alanine, glycine), carboxylic acids (e.g., citric acid, malic acid, fumaric acid), glycerol, inositol, ethanolamine, and some other components (Additional file 14: Table S8). To further understand which maize root exudates components contributed to the SQR9 biofilm enhancement, several compounds in concentrations of 0.1–1 mM were selected for investigation based on the chemical analysis of maize root exudates. These root exudates components included glucose and xylose (the most abundant carbohydrates in the exudates); alanine, glycine, leucine, isoleucine, gamma-amino butyric acid, and valine (the most dominant amino acids); and citric acid, malic acid, and fumaric acid (important organic acids reported to be involved in plantmicrobe interactions) (Additional file 14: Table S8). Only glucose at 500 μM and 1 mM significantly promoted SQR9 biofilm formation at 24 h post-inoculation, resulting in a biomass increase by 23–32 % relative to the control (Fig. 7a). No other compounds revealed significant effects, nor did glucose at 48 h post-inoculation (data not shown). Our previous study also suggested that low concentrations (~ 50 μM) of citric acid and fumaric acid enhanced the biofilm formation of SQR9 [16]. To further investigate the mechanisms by which these compounds enhanced biofilm formation, the influences of glucose, citric acid, and fumaric acid on the growth of SQR9 were assessed under aeration. Glucose (500 μM and 1 mM) and citric acid, but not fumaric acid, could significantly stimulate SQR9 cell growth (Fig. 7b). In addition, the transcriptional levels of epsD and tapA, which are responsible for extracellular matrix production during biofilm formation, in response to glucose, citric acid, and fumaric acid, were determined by real-time PCR. Results indicated that fumaric acid induced the expression of both genes after incubation for 24 h, and citric acid stimulated tapA expression at 48 h post inoculation, by more than 2-fold; whereas glucose repressed the expression of tapA at 24 h and did not significantly affect the two operons at 48 h post-inoculation (Table 5). These findings suggested that glucose enhances the biofilm formation by growth promotion and fumaric acid stimulates biofilm formation by inducing the expressions of epsD and tapA, genes which are involved in matrix production. Citric acid seemed to use both mechanisms.
Zhang et al. BMC Genomics (2015) 16:685
Page 9 of 20
Fig. 5 Schematic of genes involved in metabolism (EMP pathway, TCA cycle, and inositol metabolism), rhizosphere adaptation, biocontrol, and plant growth promotion in SQR9 and their expression patterns in response to root exudates. Each significantly differentially expressed gene is marked with a triangle, for which the left and right directions represent 24 h and 48 h post-inoculation, respectively. Red indicates up-regulation and blue down-regulation
Whole transcriptomic analyses reveals the rhizosphere adaptation and plant-beneficial effects of SQR9 Genes involved in degradation of plant polysaccharides
Cellulose and hemicellulose are major components of root debris and are widespread in the rhizosphere [42]. Several genes involved in cellulose degradation (bglC, bglS, bglA, licH, etc.) as well as genes related to xylan transport and utilization (xynA, xynB, xylR, and xylAB), were all identified in the SQR9 genome. They are likely to improve the ability of SQR9 to exploit various plant-derived polysaccharides in the rhizosphere (Fig. 5; Additional file 13: Table S7). Interestingly, bglS and bglA were significantly induced by root exudates at 24 h post-inoculation. The same was the case for xynA at 48 h post-inoculation (Figs. 5 and 6c; Additional file 12: Table S6).
Genes involved in cell motility and chemotaxis
Bacteria in the rhizosphere sense signals released from roots [43] and swim to the root surface for attachment, which is a prerequisite for biofilm formation and root colonization [9]. In the SQR9 genome, a variety of genes governing flagellar synthesis, chemotaxis and cell motility (e.g., fla-che operon, motAB, mcp, hag, swrA, and
sfp), were identified and found to be highly conserved across Bacillus strains (Additional file 13: Table S7) [44]. At 24 h post-inoculation, several genes involved in chemotaxis (cheA, cheB, cheW, mcpB, and mcpC) and flagella synthesis (fliF-L, flgD, flgG, flhA, flhF, and hag) were found to be up-regulated in response to root exudates (Fig. 6d; Additional file 12: Table S6 and Additional file 15: Figure S7), suggesting that the presence of specific compounds in maize root exudates can attract SQR9 cells. At 48 h post-inoculation, 25 of the 31 genes in the flache cluster and several other cell motility/chemotaxis genes were all down-regulated in response to the root exudates (Fig. 6d; Additional file 12: Table S6 and Additional file 15: Figure S7).
NRPS (nonribosomal peptide synthetase) and PKS (polyketide synthetase) gene clusters for suppressing soil-borne pathogens in the rhizosphere
A considerable proportion of the genomes of B. amyloliquefaciens strains are dedicated to the nonribosomal synthesis of lipopeptides and polyketides, which play important roles in suppressing of different soil-borne pathogens [5, 45]. SQR9 possesses eight gene clusters that are also present in
Zhang et al. BMC Genomics (2015) 16:685
Page 10 of 20
b
a
d 0.0
0.0 1.115 2.03 24-h
24-h
48-h glcU mtlA levD nagP glvC ptsG manP msmE licA licC licB ydhM yabM ybgF yxeM yxeO yveA opuE appA appC glnQ glnH glnM feuC feuB feuA yclN yclO yclP yclQ sapB yqeW mMT1 fhuC fhuG pstBB pstBA pstA pstC pstS citH
PTS & sugar transporters
Amino acids transporters
Cation transporters
Pi transporters
c
EMP pathway
TCA cycle
Metabolism of other carbohydrates
Cellulose/xylose metabolism
Inositol metabolism
Amino acids metabolism
f
Spo0A pathway
YwcC pathway DegSU pathway
Extracellular matrix
Fig. 6 (See legend on next page.)
48-h motB motA mcpC tlpB mcpA tlpA mcpB cheV flgB flgC fliE fliF fliG fliH fliI fliJ ylxF fliK flgD flgE fliL fliM fliY fliZ fliP fliR flhB flhA flhF ylxH cheA cheW cheC cheD swrB ytxE swrA fliT fliS fliD hag yviF flgL flgK yvyG flgM yvyF flhP flhO
Motor protein 1 MCP
2
3 4
Flagellar hook/ basal body
5
5
6 7 Chemotaxis protein
8
9
Flagellar protein
11
e
12 13
Surfactin
14
BacillomycinD Fengycin
15
Bacillibactin
16
Bacilysin
17 18
Macrolactin 19 20 21
20
Bacillaene
0.0
48-h
1.07 1.59
24-h kinA kinB kinC kinD spo0A sinI sinR abrB ywcC slrA slrR degS degU degQ epsD tapA sipW tasA bslA ywtB ywtA ywsC
0.0
1.01 1.17
24-h
g
0.92 1.21
24-h
0.78 1.53
48-h glxK gapB eno pgm2 tpiA pgk ywlF fbaB fbp sucC sucD sucA sdhB sdhA fumC ywkA ycdF hxlA gdh mtlD glvA glpD acsA bglC bglA licH bglS xylA xylB xynA iolI iolH iolG iolE iolD iolC iolB dat yncD alaT gltD gltA kamA yodQ asnO dapG lysC
0.0
0.0
24-h
48-h
10
0.0 1.055 1.78 24-h
0.86 1.52
IAA synthesis 2, 3-butandiol
48-h yhcX dhaS ysnE alsD alsS alsR phy
Difficidin
48-h srfAA srfAB srfAC srfAD sfp bmyC bmyB bmyA bmyD fenE fenD fenC fenB fenA dhbF dhbB dhbE dhbC dhbA bacE bacD bacC bacB bacA mlnA mlnB mlnC mlnD mlnE mlnF mlnG mlnH mlnI baeB baeC baeD baeE acpK baeG baeH baeI baeJ baeL baeM baeN baeR baeS dfnM dfnL dfnK dfnJ dfnI dfnH dfnG dfnF dfnE dfnD dfnC dfnB dfnX dfnY dfnA
Zhang et al. BMC Genomics (2015) 16:685
Page 11 of 20
(See figure on previous page.) Fig. 6 Gene expression profiles for all significant genes a and several representative categories. b Transporters. c Metabolism. d Cell motility and chemotaxis. e NRPS&PKS. f Biofilm-formation related. g Plant growth-promotion related. For e-g, all important genes (both significantly and insignificantly differentially expressed) are included. The color bar in the heatmap figures indicates the ratio of expression level of each gene between the presence of root exudates and its absence. Each number represents the category of the significantly affected genes: 1, cell wall; 2, transporters; 3, sensors; 4, membrane bioenergetics; 5, motility and chemotaxis; 6, protein secretion; 7, cell division; 8, sporulation and germination; 9, metabolism of carbohydrates and related molecules; 10, metabolism of amino acids and related molecules; 11, metabolism of nucleotides and nucleic acids; 12, metabolism of lipids; 13, metabolism of coenzymes and prosthetic groups, phosphate, and sulfur; 14, DNA replication, restriction/modification, repair, recombination, packaging and segregation; 15, RNA synthesis; 16, RNA modification; 17, protein synthesis, modification and folding; 18, adaptation to atypical conditions; 19, detoxification; 20, antibiotic production; and 21, phage-related functions
the model PGPR B. amyloliquefaciens strain FZB42 [5, 45] and that are responsible for the synthesis of surfactin, bacillomycin D, fengycin, bacillibactin (siderophore), bacilysin, macrolactin, difficidin, and bacillaene, respectively (Fig. 5; Additional file 13: Table S7 and Additional file 16: Table S9). The presence of all of the antibiotic products of these clusters in SQR9 has been confirmed by high performance liquid chromatography and mass spectrometry (data not shown), and can be directly linked to the
a
3.50 a ab
Biofilm formation (OD570)
3.00 2.50
bc
c
c
Control
100 µM
2.00 1.50 1.00 0.50 250 µM
500 µM
1 mM
Glucose concentration
b
2.00 a a
OD600
1.60
1.20
a
b
b
0.80
0.40
0.00 Control
Glucose 1
Glucose 2
Citric acid Fumaric acid
Treatment
Fig. 7 Effects of specific components in maize root exudates on biofilm formation and growth of SQR9. a Effects of different concentrations of glucose on the biomass of biofilm formed by SQR9 after incubation for 24 h. b Effects of glucose (Glucose 1, 500 μM; Glucose 2, 1 mM), citric acid (50 μM) and fumaric acid (50 μM) on the growth of SQR9 under aeration at 8 h post-inoculation. Columns with different letters are statistically different according to the Duncan’s multiple range tests (P < 0.05)
biological control activity of SQR9. Our previous results showed that bacillomycin D is the major antibiotic against the soil-borne wilt fungal pathogen F. oxysporum [32]. The unique genomic island GI3 (also designated as pks4 cluster because it likely encodes the fourth polyketide antibiotic of SQR9) is composed of 30 open reading frames (ORFs) (V529_06400-06690, Additional file 17: Figure S8). BLASTP indicated that this cluster includes the genes encoding polyketide synthase modules and related proteins, as well as ABC transporters and histidine kinase, which might have been obtained from Ornithinibacillus scapharcae by horizontal gene transfer (Additional file 18: Table S10). An SQR9 mutant with a deletion of the whole GI3 lost its antagonistic ability against the phylogenetically closely related strain B. amyloliquefaciens FZB42, but not against B. subtilis 168, implying that this cluster might be involved in the biosynthesis of a novel polyketide antibiotic that inhibits closely-related Bacillus strains (data not shown). In summary, SQR9 uses approximately 9.9 % of its genome to encode a variety of antibiotics. At 24 h post-inoculation, up-regulation of the surfactin genes srfAA and srfAB in response to the root exudates was observed. The dhb cluster responsible for synthesis of bacillibactin, which is a type of siderophore that operates under iron-limited conditions [5], was found to be downregulated in the presence of root exudates. Interestingly, several genes involved in the pks4 clusters were also down-regulated by root exudates (Figs. 5 and 6e; Additional file 12: Table S6). At 48 h post-inoculation, dhbC, dhbE were up-regulated, as well as bacA, which is involved in the biosynthesis of bacilysin, a dipeptide with antibacterial activity [45]. The fen cluster, which is responsible for the biosynthesis of fengycin, a lipodecapeptide antibiotic with an internal lactone ring and a β-hydroxy fatty acid chain that is mainly active against fungi [46], was down-regulated by the presence of the root exudates (Figs. 5 and 6e; Additional file 12: Table S6). Genes involved in plant growth promotion
Several genes reported to be involved in tryptophandependent indole-3-acetic acid (IAA) synthesis in B. amyloliquefaciens FZB42, including ysnE, yhcX, and dhaS [5, 47], as well as the alsRSD operon which is responsible for 2,
Zhang et al. BMC Genomics (2015) 16:685
Page 12 of 20
Table 5 Effects of glucose, citric acid, and fumaric acid on the expressions of matrix production relevant genes (epsD and tapA) of SQR9 under biofilm formation conditions Incubation time
Treatment
epsD
tapA
24-h
Glucose (500 μM)
-1.82 ± 0.22
-3.62 ± 0.63*
Citric acid (50 μM)
-1.20 ± 0.14
1.03 ± 0.08
48-h
Fold change in expression
Fumaric acid (50 μM)
2.97 ± 0.55*
5.15 ± 0.42*
Glucose (500 μM)
-1.13 ± 0.13
-1.18 ± 0.10
Citric acid (50 μM)
1.48 ± 0.21
2.27 ± 0.17*
Fumaric acid (50 μM)
1.58 ± 0.30
1.31 ± 0.10
The fold changes revealed by real-time PCR of the selected genes were determined based on the threshold cycle (Ct) values and 2-△△Ct method (94). Three replicates were performed for each gene. The asterisks represent a gene expression levels with fold changes > 2
3-butanediol biosynthesis, were found to be present the SQR9 genome (Fig. 5; Additional file 13: Table S7). In the transcriptomic analysis, both alsS and alsD were activated at 24 h post-inoculation, which could be attributed to presence of the precursor (tryptophane) for IAA synthesis in the maize root exudates (Figs. 5 and 6g; Additional file 12: Table S6; unpublished data). The phy gene, which encodes the phytase precursor, was also detected in the SQR9 genome (Fig. 5; Additional file 13: Table S7). Phytase degrades phytate into lower phosphate esters of myo-inositol and phosphate, thus promoting plant growth under phosphate-limited condition [47].
Discussion Previous high-throughput studies of plant-microbe interactions under aerobic conditions in vivo or in the rhizosphere [8, 9, 17, 18] have indicated that biofilm formation is closely related to root colonization and is necessary for beneficial effects [34]. Although B. amyloliquefaciens SQR9 is a PGPR derived from the cucumber rhizosphere, it appears to have outstanding growth promotion and enhanced root colonization abilities on maize roots (Fig. 1). Considering that SQR9-derived agents are widely applied in maize production, and biofilm formation of SQR9 was significantly stimulated by maize root exudates (Fig. 2), an Illumina RNA-Seq was performed for the whole transcriptional investigation. Phylogenetic analysis of the B. amyloliquefaciens SQR9 genome
Whole-genome sequencing of SQR9 indicated that its core genome is very similar to the core genomes of other B. amyloliquefaciens strains, such as FZB42 and CAU B946 [5, 6]. Based on gene phylogenies, including for gyrA (encoding the DNA gyrase subunit A) and cheA (encoding the twocomponent sensor histidine kinase CheA), and on plantassociated characteristics, such as root colonization, nonribosomal synthesis of secondary metabolites, and
the occurrence of polysaccharide-degrading enzymes, B. amyloliquefaciens strains can be divided into two subspecies clades, the amyloliquefaciens and plantarum groups [4]. These groups might have evolved in different environments long ago, since the patterns of molecular clock mutation and gain/loss of functional genes were quite consistent. Phylogenies of gyrA and cheA indicated that SQR9 belongs to the plantarum group, which consists of several plant-associated B. amyloliquefaciens strains, including FZB42, CAU B946, and YAU B9601-Y2 (Additional file 19: Figure S9). Several other distinguishing characteristics of these two subgroups mentioned above all supports the notion that SQR9 is more closely related to the plant-associated B. amyloliquefaciens strains, which are clearly distinct from the nonplant-associated strains, such as DSM7T, S23, and ATCC15841 [45]. Further investigation revealed that the functional elements contributing to the potential of SQR9 as a plant-associated beneficial bacterium were mainly due to genes involved in rhizosphere adaptation, biocontrol, and plant growth promotion. Mechanisms involved in stimulating biofilm formation by maize root exudates as revealed by RNA-Seq
Activation of the metabolism-related genes in SQR9 by root exudates at 24 h post-inoculation is consistent with previous findings that monosaccharides, amino acids, and organic acids are major components of plant root exudates and serve as growth substrates for rhizosphere microbes [9, 12, 17, 48]. Another significant group at this time-point includes genes involved in cell motility and chemotaxis, suggesting that some specific components of maize root exudates can be recognized by SQR9 to establish rhizosphere cross talking [49]. This observation is consistent with other reports showing that expression of motilityrelated genes is required for progression of pellicle formation [50]. Because the expressions of genes related to biofilm formation did not differ significantly from the control, the biofilm induced by root exudates at 24 h postinoculation could be attributed to the activation of genes involved in metabolism (leading to a growth promotion and a larger cell population) and cell motility/chemotaxis. This assumption is supported by the finding that additional glucose and citric acid promoted both biofilm formation and growth of SQR9 (Fig. 7), which is also in accordance with reports in which it is reported that glucose and other carbon source can influence biofilm development in Gram-positive bacteria [51, 52]. However, glucose suppressed the expressions of epsD and tapA, genes responsible for the matrix production at 24 h postinoculation, which could counteract the induction of these two operons by fumaric acid (Table 5). The stimulation of biofilm formation by root exudates at 48 h post-inoculation may be mainly attributed to the
Zhang et al. BMC Genomics (2015) 16:685
suppression of abrB, a negative regulator of biofilm formation, which activates the tapA-sipW-tasA operon encoding the TasA extracellular matrix protein [39, 53]. Additional real-time PCR results also suggest that the citric acid and fumaric acid in maize root exudates enhances the expression of the tapA operon. Other probable reasons for this notion are: (i) repression of genes involved in cell motility and chemotaxis at 48 h, which could help to maintain the mature aggregation phase [54, 55]; (ii) down-regulation of genes related to the metabolism of carbohydrates and/or amino acids at 48-h represses microbial metabolism, which has been found to be depressed in mature biofilms relative to that of proliferating biofilms [56]; and (iii) activation of a series of genes involved in iron transport, including dhbE/C (encoding the siderophore biosynthesis protein) and yclN/O (encoding the ferrichrome ABC transporter). Iron has been reported to play important roles in bacterial biofilm formation, although its detailed function in the pellicle formation of B. subtilis strains has not been well explored to date [57–59]. The observation that deletion of iron transporter genes (feuBC, ycgT) in SQR9 disabled its ability to form biofilms (unpublished data), further confirms the importance of iron in SQR9 biofilm formation. In summary, maize root exudates mediates the biofilm formation of SQR9 by both promoting cell growth and inducing matrix production. Components, including glucose and citric acid, that are directly involved in the EMP pathway and the TCA cycle stimulate cell growth during the early biofilm formation stage, whereas in the stationary stage, citric acid and other unidentified compounds activate the matrix production genes. Although the transcriptomic data generally explain the stimulatory effects of root exudates on biofilm formation of SQR9, the detailed pathways between the signal molecules in the exudates and the target genes (e.g., abrB, eps, and tapA operon) remain unclear. L-Malic acid in tomato root exudates could be sensed by the extracellular calcium channels and chemotaxis receptors domain in the KinD of B. subtilis 3610 and could consequently stimulate the phosphorylation of Spo0A and pellicle formation [60]. Another recent study indicated that certain plant polysaccharides can trigger B. subtilis biofilm formation by serving as both a signal of the kinases controlling the phosphorylation state of the master regulator Spo0A as well as a source of sugars for the synthesis of the matrix exopolysaccharide [61]. These studies provide perfect models for investigating the molecular interactions between environmental signals and bacterial biofilm formation in the rhizosphere. NRPS/PKS clusters identified in the SQR9 genome
The eight confirmed NRPS/PKS clusters in the SQR9 genome together with another candidate encode powerful
Page 13 of 20
weapons to suppress various plant pathogens [45]. In addition to their antibiotic activities, these secondary metabolites were also found to have other roles in rhizosphere adaptation and indirect pathogen suppression. As a versatile lipopeptide, surfactin could affect motility by reducing surface tension [62], stimulating biofilm formation by inducing potassium leakage and the subsequent activation of downstream genes [63], and serving as a signal to induce plant resistance [64]. Bacillomycin D produced by SQR9 is involved in the early stages of biofilm formation [32]. Noticeably, GI3 encodes a potential polyketide antibiotic that inhibits closely-related Bacillus strains. Domain analysis and prediction of the 30 ORFs performed by Antibiotics & Secondary Metabolite Analysis Shell (antiSMASH, http://antismash.secondarymetabolites.org/) suggested that 13 modules with PKS-related domains may be involved in synthesizing a polyketide antibiotic with a 33-membered ring lactone skeleton. However, the elucidation of the molecular structure and the detailed synthesis pathway of this antibiotic will require further exploration. Modeling of the rhizosphere interaction of SQR9 with plants and pathogens
Whole genome sequencing and transcriptomic data of SQR9 identified several elements relevant to its potential as a plant-associated PGPR strain. Bacteria in the rhizosphere sense root exudates components released by plants [43] through methyl-accepting proteins, activate their motility related genes (e.g., fla-che operon), and then swim to the root surface for attachment. At the same time, the genes involved in metabolism (e.g., fbaB, sucC) and transport (e.g., glcU) of various substrates are also induced. Activation of several NRPS/PKS genes related to antibiotic production (e.g., srf) also takes place to outcompete other microbes in the struggle for access to the root surface and to form biofilms. Thereafter, regulation of genes related to biofilm formation in cells attached to the root surface stimulates bacterial aggregation, thus allowing effective colonization and establishing a rhizospheric competition with soil pathogens. Finally, stimulation of the NRPS/PKS and plant growth-promotion (e.g., alsS, alsD) genes contributes to pathogen biocontrol and growth stimulation, respectively (Fig. 8). Thus, root exudates can activate the rhizosphere adaptation and survival elements of SQR9, which in turn exerts beneficial biocontrol and growthpromotion effects, resulting in a mutually-beneficial relationship between plant and PGPR strain.
Conclusion The transcriptional profiling of B. amyloliquefaciens SQR9 responding to maize root exudates, and its complete genome sequence, obtained by Illumina sequencing and Roche 454 pyrosequencing, respectively, suggest that the biofilm
Zhang et al. BMC Genomics (2015) 16:685
Page 14 of 20
Root Root exudates (e.g., organic acids, such as citric acid)
Metabolism and transporters (fbaB, sucC, glcU, etc.)
PGPR (SQR9)
Chemotaxis and cell motility (fla-che operon, mcp, etc.) Biofilm formation and antibiotic production (abrB, tapA, srf, etc.)
Colonization Antibiotic production (srf, bac, etc.) Plant growth promotion (alsS, alsD, etc.)
Rhizosphere competition Pathogen
Fig. 8 Proposed model of rhizospheric interactions of the PGPR strain, plant, and pathogens. The model is based on the results of the transcriptional profiling in this study
formation-stimulation effects are mainly attributed to growth promotion and extracellular matrix induction. Future disruptions of potential rhizosphere-associated genes identified by transcriptional profiling will be performed to better understand their roles in plant-microbe interactions. In addition, an in vivo test will be performed in further work, and the strategy for collection of root-attached bacteria and for the elimination of plant associated cDNA reads will be carefully considered prior to any additional research.
Methods Bacterial strains and culture conditions
B. amyloliquefaciens SQR9 (CGMCC accession No. 5808, China General Microbiology Culture Collection Center) was isolated from rhizosphere soil) [29]. SQR9 was routinely grown at 37 °C in Luria-Bertani (LB) medium, except that it was cultivated in 1/2 MSgg medium for biofilm formation experiments [2.5 mM potassium phosphate (pH 7), 50 mM MOPS (pH 7), 1 mM MgCl2, 350 μM CaCl2, 25 μM MnCl2, 50 μM FeCl3, 0.5 μM ZnCl2, 1 μM thiamine, 0.25 % glycerol, 0.25 % glutamate, 25 μg · mL-1 tryptophan, and 25 μg · mL-1 phenylalanine [67]. The green fluorescent protein (GFP) -labeled B. amyloliquefaciens SQR9 (SQR9-gfp) was routinely maintained in LB medium complemented with 20 μg∙mL-1 kanamycin. Plant material and growth conditions
Maize seeds (Hua’nuo Jiangnan) were surface-disinfected in 2 % NaClO solution for 10 min and rinsed four times
in sterilized distilled water. Surface-sterilized seeds were pre-germinated on filter paper in a Petri dish in an incubator at 28 °C. The germinated seeds were then transferred into a box containing quartz sand and incubated in a growth chamber at 28 °C with a 16-h light/8-h dark photoperiod. After 20 day of growth, seedlings with four to five leaves were uprooted from the substrate, and their roots were gently washed to remove any adhered sands. Some of the seedlings were transplanted to pots filled with 400 g soil-less growth medium (KlasmannDeilmann Base Substrate, Recipe-No. 422, 1:1 blended with sterile vermiculite) for growth-promotion assays. The remaining individual seedlings were transplanted into 50-mL flasks, each containing 50 mL of sterile liquid 1/2 sucrose-free Hoagland medium at 28 °C [65]. The hydroponic system was placed on a shaker (50 rpm) for 2 h each day. Greenhouse growth promotion assays
Roots of maize plants were dipped in one of four different suspensions: CK1 (5 mL inactivated SQR9 suspension), CK2 (10 mL inactivated SQR9), T1 (5 mL SQR9) or T2 (10 mL SQR9). Suspensions of SQR9 (108 cell · mL-1) were prepared by shaking cells for 6 h in liquid LB medium followed by centrifugation for 10 min at 8000 × g. The pellet was suspended in sterile distilled water and washed twice with sterile distilled water. Plants were irrigated regularly during the growing period. Soil in pots was fertilized with 1 % (w/w) commercial fertilizer (alkali-hydrolyzed nitrogen, 6.27 %; available
Zhang et al. BMC Genomics (2015) 16:685
phosphorus, 4.71 %; available potassium, 10.01 %). All treatments were carried out in a greenhouse at 70 % humidity under natural light at 27 ± 2 °C (day) and 22 ± 2 °C (night). Ten randomly selected plants of each treatment were harvested 55 days after transplanting, and plant height, root length and surface area, and shoot dry weight were measured. Data were analyzed using JMP software (SAS Institute, Cary, NC, USA). Collection of root exudates
The maize seedlings prepared above were used to collect root exudates. After incubation for 3 days, the plant roots were washed four times with sterile double-distilled water to avoid the influence of nutrient solutions. Each plant was then placed into a 50-mL flask, and the roots were submerged in 50 mL sterile double-distilled water. All plants were placed in a plant growth chamber for 24 h (16 h light/ 8 h dark) at 28 °C with gentle shaking at 80 rpm. The combined solutions (4000 mL from the 80 individual maize seedlings) were filtered through a 0.45 μm membrane filter (Millipore, Billerica, MA, USA), and the sterility of the exudates was judged by plating 100 μL exudates on LB medium and incubating at 30 °C for 24 h. The filter-sterilized root exudates was lyophilized and divided into two parts. One part was dissolved in sterile distilled water (50× concentrations), and the other part was kept as a powder. Both fractions were stored at -80 °C until further study. Colonization of maize roots by SQR9-gfp cells
Maize seedlings with four to five leaves, prepared as described above, were soaked in a bacterial suspension of SQR9-gfp (108 CFU∙mL-1) for 30 min at 30 °C and transferred to containers with 200 g sterilized natural soil. After 5 days, the roots were collected and put on microscope slides for visualization using a confocal laser scanning microscopy (CLSM; Zeiss, Jena, Germany) to compare the thickness and the architecture of the bacterial biofilms. GFP was excited at 488 nm, and fluorescence was recorded in the range of 500–600 nm. Images were obtained using ZEN 2012 (blue edition). The density of SQR9-gfp on roots was also determined as described previously [66]. To this end, 0.2 g of the maize roots were homogenized in 1.8 mL of phosphate buffered saline using a mortar and pestle. The homogenates were serially diluted and plated onto LB medium containing 20 μg∙mL-1 kanamycin. After growth at 37 °C for 2 days, the bacterial colonies were examined using fluorescence microscopy (Olympus MVX10, Tokyo, Japan), and those emitting green fluorescence were counted. Effects of maize root exudates and some of its individual components on biofilm formation of SQR9
To investigate the effects of the maize root exudates on the biofilm formation of SQR9, assay was performed as
Page 15 of 20
described by Hamon and Lazazzera [67] in 48-well microtiter plates. An overnight culture of SQR9 was grown in LB medium at 37 °C until the OD600 reached 1.0. Then, the cells were centrifuged, washed twice with 1/2 MSgg, and finally resuspended in the same volume of 1/2 MSgg. Each well was filled with 1 mL 1/2 MSgg medium containing 10 μL of the suspension prepared as described above. Either 10, 20, or 40 μL of the 50× concentrated root exudates was added to the medium in the well, resulting in a final concentrations of 0.5×, 1×, and 2× root exudates relative to the concentrations in the flasks used to collect root exudates. Negative controls contained 20 μL of distilled water in each well. After static incubation at 37 °C, the biomass of the biofilm formed by SQR9 was determined [67] after every 12-h interval until 72 h after inoculation. Growth medium and nonadherent cells were removed from the microtiter wells, which were then rinsed with distilled water. Biofilm cells were stained with 1 mL of 0.1 % crystal violet (in distilled water) for 30 min at room temperature. Excess crystal violet was poured out, and the wells were washed twice with distilled water. The bound crystal violet was solubilized with 1 mL ethanol-acetone (4:1 v/v), and the biofilm formation was quantified by measuring the OD570 for each well using a multi-functional plate reader Spectra Max M5 analysis system (Molecular Devices, Sunnyvale, CA, USA). Each treatment contained four biological replicates. An additional assay was performed to evaluate the effects on SQR9 biofilm formation of several important compounds in maize root exudates, including the carbohydrates glucose and xylose; the amino acids alanine, glycine, leucine, isoleucine, γ-amino butyric acid, and valine; and the organic acids citric acid, malic acid, and fumaric acid. The final concentrations of these compounds in the wells were 100 μM, 250 μM, 500 μM, and 1 mM. Four replicates were used per treatment. After incubation for 24 and 48 h, the biofilm was quantified as described above. Also, the influences of the compounds with biofilmstimulation effects, including glucose (500 μM and 1 mM), citric acid (50 μM), and fumaric acid (50 μM) [16] on the growth of SQR9 were investigated under aeration (37 °C, 170 rpm). To this end, 3 mL of 1/2 MSgg medium was inoculated with a suspension of SQR9 with a final OD600 value of 0.01. The OD600 was determined at 8 h post-inoculation. Each treatment contained four replicates.
Design of the transcriptome experiments, total RNA preparation, and microscopy
Based on the results of the pre-experiments, 1× root exudates was used as the test concentration, and the time points 24 and 48 h after incubation were selected for sampling. The biofilm formation assays were performed as described
Zhang et al. BMC Genomics (2015) 16:685
above, and 20 μL of the concentrated root exudates was added to the medium in each well, with an equal volume of distilled water in the control wells. After static incubation at 37 °C for 24 or 48 h, the SQR9 cells within the biofilms formed in the presence and absence of the root exudates were harvested, thus generating four samples. A volume of 50 mL of the culture (from the 50 wells of the microtiter plate) was mixed with 25 mL of cold “killing buffer” (20 mM Tris–HCl, 5 mM MgCl2, 20 mM NaN3, pH 7.5) and centrifuged at 4500 × g for 3 min at 4 °C. The pellet was then washed once more with 1 mL of “killing buffer” and immediately frozen in liquid nitrogen. The frozen cell pellets were stored at -80 °C prior to RNA isolation. The total RNA samples were extracted using an E.Z.N.A. @ Bacterial RNA Kit (Omega, Bio-tek, Norcross, GA, USA), according to the manufacturer’s protocol. The isolated RNA was digested with DNaseI (Ambion, Carlsbad, CA, USA) to remove possible traces of DNA. The concentration of the total RNA was determined with a spectrophotometer, and its quality was checked on a 1 % agarose gel. Multiple 30-μg quantities of each RNA sample were depleted of rRNA using a Ribo-Zero™ rRNA Removal kit (Epicenter, USA) according to the manufacturer’s instructions. The resulting RNA samples were dissolved in 100 μL RNase-free water and quantified with a NanoDrop 2000 spectrophotometer (Wilmington, DE, USA). The biofilm at 24 h post-inoculation from experiments with or without root exudates was also carefully collected and put on microscope slides for visualization with CLSM to compare the thickness and architecture, as described above.
cDNA synthesis, construction of cDNA library, and DNA sequencing
Ten micrograms of the thermal-fragmented rRNA-depleted mRNA was incubated with biotinylated random hexamers (Illumina, San Diego, CA, USA) with the use of 1,000 units of Superscript II reverse transcriptase (Invitrogen, Carlsbad, CA, USA) for first-strand cDNA synthesis. Dynal M280 streptavidin Dynabeads (Invitrogen) were used to select the biotinylated RNA/cDNA. The first-strand of cDNA was released via alkaline hydrolysis. Subsequently, adaptors were ligated to the 5’-end of the first strand cDNA by DNA ligase (TaKaRa, Otsu, Japan), and the second-strand cDNA was synthesized through primer extension using ExTaq polymerase (TaKaRa, Japan). The synthesized cDNA was fractioned ultrasonically into 300–800 bp and purified with Ampure beads (Agencourt, USA). The prepared cDNAs were transformed into libraries using the Truseq™ DNA Sample Prep Kit-Set A (Illumina) and then clonally amplified with the TruSeq PE Cluster Kit (Illumina). DNA sequencing was performed on a HiSeq 2500 sequencing system
Page 16 of 20
(Illumina) by the Chinese National Human Genome Center (Shanghai, China). Genome sequencing and assembly
To provide the reference mapping background for the transcriptomic analysis, the genome of B. amyloliquefaciens SQR9 was shotgun sequenced using a Roche 454 GS FLX system (Penzberg, Germany) at the Chinese National Human Genome Center. In total, 279,622 reads produced 115.5 Mb of sequence data (28.1× coverage) with an average read length of 413 bp. The reads were assembled into 51 contigs with a total size of 4.07 Mb using Newbler software (v2.3) provided in the Roche 454 suite package [68]. Of the 51 contigs, 42 were more than 2 kb in length, and their N50 was 300.1 kb (that is, 50 % of all bases were contained in contigs of at least 300.1 kb). After linkage of the contigs, sequences obtained by the Sanger method were used to fill in gaps in the assembly and confirm regions of uncertainty. Genome annotation
Protein-coding genes were predicted using both Glimmer 3 [69] and Prodigal [70]. The two sets of gene calls were combined using Prodigal as the preferred start call for genes with the same stop codon. Pseudogenes and anomalous start/ stop codons were identified by the GenePrimp pipeline [71]. Then, all of the genes were manually curated with the genome viewer Artemis [72]. The RNA-Seq data obtained as described below were also used to verify gene calling and identify novel transcripts, including non-coding RNAs, by Rockhopper [73]. The functional annotation was carried out using the BLASTP search tool, with B. amyloliquefaciens FZB42 and B. subtilis 168 as references, and GenBank’s non-redundant protein databases (nr) (parameters: E value: 1e-5, coverage > 60 %, identity > 50 %). Each gene was functionally classified into Cluster of Orthologous Genes (COG) categories using an RPS-BLAST search against the COG database with an E value of 1e-5 [74]. Domain prediction was also carried out with a RPS-BLAST search against the PFAM database with an E value of 1e-5 [75]. Genes for tRNAs were predicted with tRNAscan-SE [76] and for rRNAs with RNAmmer 1.2 Server [77]. Insertion sequences (ISs) were identified using a BLASTN scan against an IS database [78]. Horizontally transferred genomic islands (GIs) were identified with IslandViewer [79] and using SeqWord Sniffer tools [80] to combine the prediction results. Prophage regions were identified using the PHAST web server [81]. Dot plot comparison was implemented in MUMmer nucmer [82], and the global alignment of whole genome sequences was performed with M-GCAT software [83]. The circular map and the graphic representation of genome-compared orthologous genes were generated using Circos [84].
Zhang et al. BMC Genomics (2015) 16:685
Orthologous gene analysis
Orthologous genes present in the four B. amyloliquefaciens strains and B. subtilis 168 were identified using OrthoMCL [85]. The protein-coding genes of all the five bacteria were compared all-against-all using BLASTP with a minimum E value of 1e-05 and a cutoff of 70. Then, all homologous proteins were grouped into orthologous genes by the cluster tool MCL, with an inflation value of 1.5 [86]. Python scripts were developed to process the output group file, and the core genome and dispensable genome were extracted. Gene counts were based on orthology, and a Venn diagram was generated with VennDiagram [87]. Phylogenetic analysis
A total of 18 genomes, that is, 12 B. amyloliquefaciens genomes, two B. subtilis genomes, and another four Bacillus genomes (B. cereus, B. pumilus, B. licheniformis, and B. atrophaeus), were included in the phylogenetic analysis. Python scripts were developed to filter the core genome to 1,044 conserved genes with exactly one member per genome; the lengths of each of these genes were nearly identical. MAFFT [88] was used to align the protein sequences and concatenate each gene alignment into a string for each genome. The interleaved NEXUS file was formatted using PAUP*4.0b10 [89]. Phylogenetic analyses of the core genome were performed using the maximumparsimony method (observed p-distance, no evolutionary modeling required) implemented in PAUP*4.0b10 via a heuristic search (n = 1,000) with the random addition of sequences and the TBR tree-swapping algorithm. The reliability of the obtained clades was tested by 500 bootstrap replications. Bootstrap values > 75 % were considered significant. Mapping and processing of the RNA-Seq data
The clean reads obtained from Illumina sequencing (at least half of the bases with a quality > 5, not including N) were retained and mapped to the B. amyloliquefaciens SQR9 genome. Collected reads from different samples of each gene were transformed into reads per million reads values (RPM) [90]. Transcript abundance (fragments per kilobase unique exon sequence per megabase of library mapped; FPKM) was estimated with Cufflinks v 0.9.3 [91]. Genes exhibiting statistically significant expression differences between the control and treatment conditions were identified using MARS (MA-plot-based method with Random Sampling model) from the DEGseq program package using the false discovery rate (FDR) control method [92, 93]. Only genes that met the following filter conditions were regarded as significantly differently expressed between control and treatment: (i) foldchange ≥ 1.5; (ii) q-value ≤ 0.001 (FDR); and (iii) with a RPM consistently above 10 in at least one sample. The
Page 17 of 20
ratios of the gene expression levels between the treatment and control conditions belonging to different categories were used to generate a heatmap with MeV version 4.8.1 (MultiExperiment Viewer), according to the manufacturer’s instructions. Real-time PCR
Real-time PCR was performed on the original RNA extracts to confirm the transcriptional profiling data obtained from Illumina sequencing as well as to investigate the gene expression responses to the biofilm-stimulating compounds, including glucose (500 μM), citric acid (50 μM), and fumaric acid (50 μM) [16]. First-strand cDNA was obtained as described above. A volume of 1 μL of the cDNA was subjected to real-time PCR using SYBR Green PCR master mix (Applied Biosystems, Foster City, CA, USA). Oligonucleotide primers for the target genes were designed using Primer Premier 5 software (PREMIER Biosoft, Palo Alto, CA, USA), and the recA gene was used as an internal control. The reaction mixtures contained a final concentration of 25 μL SYBR@ Premix Ex Taq™, 1 μL of each primer (10 μM), 1 μL ROX Reference Dye II (50×), 2 μL template DNA and 20 μL sterile water. The reactions were performed using an ABI 7500 system (Applied Biosystems) with the following conditions: an initial cycle at 95 °C for 30 s, followed by 40 cycles of 95 °C for 5 s, 65 °C for 34 s, and 72 °C for 15 s. Three technical replicates were carried out for each target gene. Quantification was analyzed based on the threshold cycle (Ct) values and the 2-△△Ct method [94]. Analysis of the composition of maize root exudates
The collected maize root exudates were analyzed by gas chromatography–mass spectrometry (GC-MS) at the Genome Center Core Services, University of California, Davis, CA, USA, as described by Badri et al. [41]. Statistical analysis
Differences among treatments were determined by analysis of variance with Duncan’s multiple range tests (P < 0.05) and Student’s t test (P < 0.05 or P < 0.01) as appropriate. SPSS (IBM, Chicago, IL, version 19.0) was used for statistical analysis. Accession number
The genome sequence and annotated data of SQR9 are available in the NCBI database (accession No. CP006890).
Additional files Additional file 1: Figure S1. Effects of concentrations and incubation times of maize root exudates on biofilm formation of SQR9. (A) Influence of different concentrations of maize root exudates on SQR9 biofilm formation.
Zhang et al. BMC Genomics (2015) 16:685
Bars indicate the standard errors of the means from four replicates. Columns with different letters are statistically different according to the Duncan’s multiple range tests (P < 0.05, for 24 and 48 h post-inoculation, respectively). 1/2 RE, RE, and 2× RE represent that the 1/2 MSgg medium were supplied with 0.5×, 1×, and 2× concentrated root exudates as described in the Methods. (B) Dynamics of the biomass of biofilm-formed SQR9 in response to 1× maize root exudates. Bars indicate the standard errors of the means from four replicates. The arrows represent the sampling times for transcriptional profiling analysis. (DOCX 44 kb) Additional file 2: Table S1. Novel noncoding RNAs predicted by Rockhopper. The expression level listed in the table was obtained by Rockhopper. Con_24, negative control, 24 h post- inoculation; Ma_24, maize root exudates treatment, 24 h post-inoculation; Con_48, negative control, 48 h post-inoculation; Ma_48, maize root exudates treatment, 48 h post-inoculation. (XLSX 26 kb) Additional file 3: Table S2. Unique genes in Bacillus amyloliquefaciens SQR9 in the pan genome formed by SQR9, Bacillus subtilis 168, and B. amyloliquefaciens FZB42, DSM7T, and B9601-Y2. (XLSX 36 kb) Additional file 4: Figure S2. Comparison of the genomes of Bacillus amyloliquefaciens strains SQR9 and FZB42 and Bacillus subtilis 168. (A and B) Matches of the SQR9 genome with those of B. subtilis 168 (A) and B. amyloliquefaciens FZB42 (B). Synteny plots show the comparison at the nucleotide level of the B. amyloliquefaciens SQR9 genome (a and b, vertical axis) with the genomes of B. subtilis 168 (A, horizontal axis) and B. amyloliquefaciens FZB42 (B, horizontal axis). Forward matches are plotted in red and reverse matches in blue. (C) Global alignment of the three strains built by the M-GCAT program. (DOCX 295 kb) Additional file 5: Table S3. Genes shared by Bacillus amyloliquefaciens SQR9 and B. amyloliquefaciens FZB42 but absent in Bacillus subtilis 168 (Sheet 1), or shared by SQR9 and 168 but absent in FZB42 (Sheet 2). (XLSX 77 kb) Additional file 6: Figure S3. Phylogenetic tree drawn from 1,044 conserved genes of the core genomes of 18 Bacillus genomes. The maximum-parsimony tree was obtained in PAUP*4.0b10 via a heuristic search (n = 1,000) with the random addition of sequences and the TBR tree-swapping algorithm. Bootstrap values of > 75 % were considered significant. Bacillus cereus ATCC 14579 was used as the outgroup. (DOCX 55 kb) Additional file 7: Table S4. Genomic island (GI) prediction of Bacillus amyloliquefaciens SQR9. GIs were predicted by IslandViewer and M-GCAT (Sheet 1). Sheet 2 shows the detailed information for all genes in the 11 predicted GIs. (XLSX 209 kb) Additional file 8: Figure S4. Orthologous genes in Bacillus subtilis 168 and Bacillus amyloliquefaciens SQR9 and FZB42. Lines in blue represent orthologs between SQR9 and FZB42 that were not found in 168, while lines in red represent orthologs between SQR9 and 168 that were not found in FZB42. Highlight-1 is genomic island 3 of SQR9, which was only found in SQR9, and highlight-2 shows the prophage (genomic island 7, 8, and 9) only shared by SQR9 and 168. (DOCX 378 kb) Additional file 9: Figure S5. Saturation curves of the Illumina RNA-Seq data. The X-axis represents the number of reads. The Y-axis represents the number of open reading frames covered by the reads obtained. (DOCX 90 kb) Additional file 10: Figure S6. Comparison of different gene expression patterns regulated by root exudates at 24 h (A) and 48 h (B) post-inoculation. Every point represents a gene with different expression levels (fragments per kilobase unique exon sequence per megabase of library mapped; FPKM) in two transcriptomes. Blue color denotes genes with no significant differences between the two transcriptomes, red means up-regulation and green means down-regulation. (DOCX 228 kb) Additional file 11: Table S5. Comparison of fold-changes of differentially expressed genes obtained by Illumina RNA-Seq and real-time PCR. The fold changes revealed by real-time PCR of the selected genes were determined based on the threshold cycle (Ct) values and 2-△△Ct method. Three replicates were performed for each gene. (DOCX 15 kb) Additional file 12: Table S6. Illumina RNA-Seq data of all significantly differentially expressed genes in different categories (Sheet 1, 24 h post-inoculation; Sheet 2, 48 h post-inoculation). (XLSX 275 kb)
Page 18 of 20
Additional file 13: Table S7. List of genes involved in rhizosphere adaptation (degradation of plant polysaccharides, cell motility and chemotaxis, biofilm formation, transporters, and detoxification), synthesis of secondary metabolisms, and plant growth promotion. (XLSX 59 kb) Additional file 14: Table S8. Composition of maize root exudates analyzed by gas chromatography–mass spectrometry. (XLSX 55 kb) Additional file 15: Figure S7. Diagram of genes involved in cell motility (mainly flagellar synthesis, A and B) and chemotaxis (C and D), and their expression patterns in response to root exudates. The significantly regulated genes (red for up-regulation and green for down-regulation) were mapped in the KEGG pathway (with some modifications for the flagellar synthesis). (A) and (C) show expression patterns at 24 h post-inoculation and (B) and (D) at 48 h post-inoculation. (DOCX 114 kb) Additional file 16: Table S9. NRPS and PKS gene clusters involved in the biosynthesis of secondary metabolites in Bacillus amyloliquefaciens SQR9 and FZB42. (DOCX 15 kb) Additional file 17: Figure S8. Schematic representation of genes in the pks4 cluster in Bacillus amyloliquefaciens SQR9. Non-ribosomal polyketide synthetase/polyketide synthetase is marked in red, transporter genes in blue, accessory genes in green, and hypothetical genes in yellow. (DOCX 27 kb) Additional file 18: Table S10. BLASTP results for each open reading frame in the pks4 cluster (XLSX 13 kb) Additional file 19: Figure S9. Neighbor-joining phylogenetic tree based on partial gyrA (A) and cheA (B) nucleotide sequences. The consensus tree was reconstructed from 1,000 trees according to the extended majority rule (SEQBOOT program). Bootstrap values >50 % (1,000 repetitions) are indicated at branch points. (DOCX 136 kb) Abbreviations ABC: ATP-binding cassette; CLSM: Confocal laser scanning microscopy; EMP: Embden-Meyerhof-Parnas; FDR: False discovery rate; FOC: Fusarium oxysporum f. sp. cucumerinum J. H. Owen; FPKM: Fragments per kilobase unique exon sequence per megabase of library mapped; GFP: Green fluorescence protein; GI: Genomic island; IAA: Indole-3-acetic acid; NGS: Next-generation sequencing; NRPS: Nonribosomal peptide synthetase; ORF: Open reading frame; PGPR: Plant growth-promoting rhizobacteria; PKS: Polyketide synthase; PTS: Phosphotransferase system; RPM: Reads per million; TCA: Tricarboxylic acid. Competing interests The authors declare that they have no competing interests. Authors’ contributions NZ carried out the transcriptome studies, participated in data analysis, and drafted the manuscript. DY participated in genome annotation, comparative genome analysis, and transcriptome data analysis. DW constructed the mutant and performed the antagonistic test. YM finished the gap of the genome. JS carried out the colonization assays and the greenhouse experiments. XZ predicted the genomic islands. ZX participated in the qRT-PCR. QL participated in sRNA predication. HF investigated the effects of specific compounds on biofilm formation. SL participated in data analysis and helped to draft the manuscript. QS participated in the study design and helped to draft the manuscript. RZ conceived the study, participated in its design, and helped to draft the manuscript. All authors read and approved the final manuscript. Acknowledgements This research was financially supported by the Chinese Ministry of Science and Technology (2015CB150505 and 2013AA102802), the National Natural Science Foundation of China (31330069 and 41271271), and the Fundamental Research Funds for the Central Universities (KYZ201408). RZ and QS were also supported by the 111 Project (B12009) and the Priority Academic Program Development (PAPD) of Jiangsu Higher Education Institutions. Author details 1 Jiangsu Key Lab for Organic Solid Waste Utilization, National Engineering Research Center for Organic-based Fertilizers, Jiangsu Collaborative Innovation Center for Solid Organic Waste Resource Utilization, Nanjing
Zhang et al. BMC Genomics (2015) 16:685
Agricultural University, 210095 Nanjing, China. 2Key Laboratory of Microbial Resources Collection and Preservation, Ministry of Agriculture, Institute of Agricultural Resources and Regional Planning, Chinese Academy of Agricultural Sciences, 100081 Beijing, China. 3College of Resources & Environmental Science, Nanjing Agricultural University, 210095 Nanjing, China. Received: 21 December 2014 Accepted: 7 August 2015
References 1. Lugtenberg B, Kamilova F. Plant-growth-promoting rhizobacteria. Annu Rev Microbiol. 2009;63:541–56. 2. Ruckert C, Blom J, Chen XH, Reva O, Borriss R. Genome sequence of B. amyloliquefaciens type strain DSM7(T) reveals differences to plant-associated B. amyloliquefaciens FZB42. J Biotechnol. 2011;155(1):78–85. 3. Perez-Garcia A, Romero D, de Vicente A. Plant protection and growth stimulation by microorganisms: biotechnological applications of Bacilli in agriculture. Curr Opin Biotech. 2011;22(2):187–93. 4. Borriss R, Chen XH, Rueckert C, Blom J, Becker A, Baumgarth B, et al. Relationship of Bacillus amyloliquefaciens clades associated with strains DSM 7T and FZB42T: a proposal for Bacillus amyloliquefaciens subsp. amyloliquefaciens subsp. nov. and Bacillus amyloliquefaciens subsp. plantarum subsp. nov. based on complete genome sequence comparisons. Int J Syst Evol Micr. 2011;61(Pt 8):1786–801. 5. Chen XH, Koumoutsi A, Scholz R, Eisenreich A, Schneider K, Heinemeyer I, et al. Comparative analysis of the complete genome sequence of the plant growth-promoting bacterium Bacillus amyloliquefaciens FZB42. Nat Biotechnol. 2007;25(9):1007–14. 6. Blom J, Rueckert C, Niu B, Wang Q, Borriss R. The complete genome of Bacillus amyloliquefaciens subsp. plantarum CAU B946 contains a gene cluster for nonribosomal synthesis of iturin A. J Bacteriol. 2012;194(7):1845–6. 7. Hao K, He PF, Blom J, Rueckert C, Mao ZC, Wu YX, et al. The genome of plant growth-promoting Bacillus amyloliquefaciens subsp. plantarum strain YAU B9601-Y2 contains a gene cluster for mersacidin synthesis. J Bacteriol. 2012;194(12):3264–5. 8. Matilla MA, Espinosa-Urgel M, Rodriguez-Herva JJ, Ramos JL, RamosGonzalez MI. Genomic analysis reveals the major driving forces of bacterial life in the rhizosphere. Genome Biol. 2007;8(9):R179. 9. Fan B, Carvalhais LC, Becker A, Fedoseyenko D, von Wiren N, Borriss R. Transcriptomic profiling of Bacillus amyloliquefaciens FZB42 in response to maize root exudates. BMC Microbiol. 2012;12:116. 10. Bais HP, Weir TL, Perry LG, Gilroy S, Vivanco JM. The role of root exudates in rhizosphere interactions with plants and other organisms. Annu Rev Plant Biol. 2006;57:233–66. 11. Badri DV, Vivanco JM. Regulation and function of root exudates. Plant Cell Environ. 2009;32(6):666–81. 12. Badri DV, Weir TL, van der Lelie D, Vivanco JM. Rhizosphere chemical dialogues: plant-microbe interactions. Curr Opin Biotech. 2009;20(6):642–50. 13. Kamilova F, Kravchenko LV, Shaposhnikov AI, Makarova N, Lugtenberg B. Effects of the tomato pathogen Fusarium oxysporum f. sp. radicis-lycopersici and of the biocontrol bacterium Pseudomonas fluorescens WCS365. Mol Plant Microbe Int. 2006;19(10):1121–6. 14. Kamilova F, Kravchenko LV, Shaposhnikov AI, Azarova T, Makarova N, Lugtenberg B. Organic acids, sugars, and L-tryptophane in exudates of vegetables growing on stonewool and their effects on activities of rhizosphere bacteria. Mol Plant Microbe Int. 2006;19(3):250–6. 15. Rudrappa T, Czymmek KJ, Pare PW, Bais HP. Root-secreted malic acid recruits beneficial soil bacteria. Plant Physiol. 2008;148(3):1547–56. 16. Zhang N, Wang DD, Liu YP, Li SQ, Shen QR, Zhang RF. Effects of different plant root exudates and their organic acid components on chemotaxis, biofilm formation and colonization by beneficial rhizosphere-associated bacterial strains. Plant Soil. 2014;374(1-2):689–700. 17. Mark GL, Dow JM, Kiely PD, Higgins H, Haynes J, Baysse C, et al. Transcriptome profiling of bacterial responses to root exudates identifies genes involved in microbe-plant interactions. Proc Natl Acad Sci USA. 2005;102(48):17454–9. 18. Ramachandran VK, East AK, Karunakaran R, Downie JA, Poole PS. Adaptation of Rhizobium leguminosarum to pea, alfalfa and sugar beet rhizospheres investigated by comparative transcriptomics. Genome Biol. 2011;12(10):R106.
Page 19 of 20
19. Liu J, He D, Ma X, Wu HJ, Gao XW. Identification of up-regulated genes of Bacillus amyloliquefaciens B55 during the early stage of direct surface contact with rice R109 root. Curr Microbiol. 2011;62(1):267–72. 20. Dunn AK, Klimowicz AK, Handelsman J. Use of a promoter trap to identify Bacillus cereus genes regulated by tomato seed exudate and a rhizosphere resident, Pseudomonas aureofaciens. Appl Environ Microb. 2003;69(2):1197–205. 21. Shidore T, Dinse T, Ohrlein J, Becker A, Reinhold-Hurek B. Transcriptomic analysis of responses to exudates reveal genes required for rhizosphere competence of the endophyte Azoarcus sp. strain BH72. Environ Microbiol. 2012;14(10):2775–87. 22. Metzker ML. Sequencing technologies - the next generation. Nat Rev Genet. 2010;11(1):31–46. 23. Marguerat S, Bahler J. RNA-seq: from technology to biology. Cell Mol Life Sci. 2010;67(4):569–79. 24. Passalacqua KD, Varadarajan A, Ondov BD, Okou DT, Zwick ME, Bergman NH. Structure and complexity of a bacterial transcriptome. J Bacteriol. 2009;191(10):3203–11. 25. Wilhelm BT, Landry JR. RNA-Seq-quantitative measurement of expression through massively parallel RNA-sequencing. Methods. 2009;48(3):249–57. 26. Martin JA, Wang Z. Next-generation transcriptome assembly. Nat Rev Genet. 2011;12:671–82. 27. Znameroski EA, Coradetti ST, Roche CM, Tsai JC, Lavarone AT, Cate JHD, et al. Induction of lignocellulose-degrading enzymes in Neurospora crassa by cellodextrins. Proc Natl Acad Sci USA. 2011;109(16):6012–7. 28. Coradetti ST, Craig JP, Xiong Y, Shock T, Tian CG, Glass NL. Conserved and essential transcription factors for cellulase gene expression in ascomycete fungi. Proc Natl Acad Sci USA. 2012;109(19):7397–402. 29. Cao Y, Zhang ZH, Ling N, Yuan YJ, Zheng XY, Shen B, et al. Bacillus subtilis SQR 9 can control Fusarium wilt in cucumber by colonizing plant roots. Biol Fertil Soils. 2011;47(5):495–506. 30. Qiu MH, Zhang RF, Xue C, Zhang SS, Li SQ, Zhang N, et al. Application of bio-organic fertilizer can control Fusarium wilt of cucumber plants by regulating microbial community of rhizosphere soil. Biol Fertil Soils. 2012;48(7):807–16. 31. Weng J, Wang Y, Li J, Shen QR, Zhang RF. Enhanced root colonization and biocontrol activity of Bacillus amyloliquefaciens SQR9 by abrB gene disruption. Appl Microbiol Biotech. 2013;97(19):8823–30. 32. Xu ZH, Shao JH, Li B, Yan X, Shen QR, Zhang RF. Contribution of bacillomycin D in Bacillus amyloliquefaciens SQR9 to antifungal activity and biofilm formation. Appl Environ Microb. 2013;79(3):808–15. 33. Qiu MH, Li SQ, Zhou X, Cui XS, Vivanco JM, Zhang N, et al. De-coupling of root–microbiome associations followed by antagonist inoculation improves rhizosphere soil suppressiveness. Biol Fertil Soils. 2014;50(2):217–24. 34. Ramey BE, Koutsoudis M, von Bodman SB, Fuqua C. Biofilm formation in plant-microbe associations. Curr Opin Microbiol. 2004;7(6):602–9. 35. Chen Y, Yan F, Chai YR, Liu HX, Kolter R, Losick R, et al. Biocontrol of tomato wilt disease by Bacillus subtilis isolates from natural environments depends on conserved genes mediating biofilm formation. Environ Microbiol. 2013;15(3):848–64. 36. Compant S, Clément C, Sessitsch A. Plant growth-promoting bacteria in the rhizo- and endosphere of plants: Their role, colonization, mechanisms involved and prospects for utilization. Soil Biol Biochem. 2010;42(5):669–78. 37. Xu ZH, Zhang RF, Wang DD, Qiu MH, Feng HC, Zhang N, et al. Enhanced control of cucumber wilt disease by Bacillus amyloliquefaciens SQR9 by altering the regulation of its DegU phosphorylation. Appl Environ Microb. 2014;80(9):2941–50. 38. Weir TL, Stull VJ, Badri D, Trunck LA, Schweizer HP, Vivanco J. Global gene expression profiles suggest an important role for nutrient acquisition in early pathogenesis in a plant model of Pseudomonas aeruginosa infection. Appl Environ Microb. 2008;74(18):5784–91. 39. Vlamakis H, Chai Y, Beauregard P, Losick R, Kolter R. Sticking together: building a biofilm the Bacillus subtilis way. Nat Rev Microbiol. 2013;11(3):157–68. 40. Kobayashi K. Gradual activation of the response regulator DegU controls serial expression of genes for flagellum formation and biofilm formation in Bacillus subtilis. Mol Microbiol. 2007;66(2):395–409. 41. Badri DV, Chaparro JM, Zhang R, Shen Q, Vivanco JM. Application of natural blends of phytochemicals derived from the root exudates of Arabidopsis to the soil reveal that phenolic-related compounds predominantly modulate the soil microbiome. J Biol Chem. 2013;288(7):4502–12. 42. Lynd LR, Weimer PJ, van Zyl WH, Pretorius IS. Microbial cellulose utilization: fundamentals and biotechnology. Microbiol Mol Biol R. 2002;66(3):506–77.
Zhang et al. BMC Genomics (2015) 16:685
43. de Weert S, Vermeiren H, Mulders IHM, Kuiper I, Hendrickx N, Bloemberg GV, et al. Flagella-driven chemotaxis towards exudate components is an important trait for tomato root colonization by Pseudomonas fluorescens. Mol Plant Microbe Int. 2002;15(11):1173–80. 44. Cozy LM, Phillips AM, Calvo RA, Bate AR, Hsueh YH, Bonneau R, et al. SlrA/ SinR/SlrR inhibits motility gene expression upstream of a hypersensitive and hysteretic switch at the level of sigma(D) in Bacillus subtilis. Mol Microbiol. 2012;83(6):1210–28. 45. Chen XH, Koumoutsi A, Scholz R, Schneider K, Vater J, Sussmuth R, et al. Genome analysis of Bacillus amyloliquefaciens FZB42 reveals its potential for biocontrol of plant pathogens. J Biotechnol. 2009;140(1-2):27–37. 46. Koumoutsi A, Chen XH, Henne A, Liesegang H, Hitzeroth G, Franke P, et al. Structural and functional characterization of gene clusters directing nonribosomal synthesis of bioactive cyclic lipopeptides in Bacillus amyloliquefaciens strain FZB42. J Bacteriol. 2004;186(4):1084–96. 47. Idriss EE, Makarewicz OM, Farouk A, Rosner K, Greiner R, Bochow H, et al. Extracellular phytase activity of Bacillus amyloliquefaciens FZB45 contributes to its plant-growth-promoting effect. Microbiology. 2002;148:2097–109. 48. Lugtenberg BJJ, Bloemberg GV. Life in the rhizosphere. In: Ramos JL, editor. Pseudomonas, vol. 1. New York: Kluwer Academic/Plenum; 2004. p. 403–30. 49. Bais HP, Fall R, Vivanco JM. Biocontrol of Bacillus subtilis against infection of Arabidopsis roots by Pseudomonas syringae is facilitated by biofilm formation and surfactin production. Plant Physiol. 2004;134(1):307–19. 50. Kobayashi K. Bacillus subtilis pellicle formation proceeds through genetically defined morphological changes. J Bacteriol. 2007;189(13):4920–31. 51. Stanley NR, Britton RA, Grossman AD, Lazazzera BA. Identification of catabolite repression as a physiological regulator of biofilm formation by Bacillus subtilis by use of DNA microarrays. J Bacteriol. 2003;185(6):1951–7. 52. Mhatre E, Monterrosa RG, Kovacs AT. From environmental signals to regulators: modulation of biofilm development in Gram-positive bacteria. J Basic Microbiol. 2014;54(7):616–32. 53. Chu F, Kearns DB, Branda SS, Kolter R, Losick R. Targets of the master regulator of biofilm formation in Bacillus subtilis. Mol Microbiol. 2006;59(4):1216–28. 54. Vlamakis H, Aguilar C, Losick R, Kolter R. Control of cell fate by the formation of an architecturally complex bacterial community. Genes Dev. 2008;22(7):945–53. 55. Guttenplan SB, Kearns DB. Regulation of flagellar motility during biofilm formation. FEMS Microbiol Rev. 2013;37(6):849–71. 56. Yang L, Liu Y, Wu H, Song ZJ, Hoiby N, Molin S, et al. Combating biofilms. FEMS Immunol Med Mic. 2011;65(2):145–57. 57. Banin E, Vasil ML, Greenberg EP. Iron and Pseudomonas aeruginosa biofilm formation. Proc Natl Acad Sci USA. 2005;102(31):11076–81. 58. Avidan O, Satanower S, Banin E. Iron and bacterial biofilm development. 2010, 14:359-383 59. Trappetti C, Potter AJ, Paton AW, Oggioni MR, Paton JC. LuxS mediates iron-dependent biofilm formation, competence, and fratricide in Streptococcus pneumoniae. Infect Immun. 2011;79(11):4550–8. 60. Chen Y, Cao SG, Chai YR, Clardy J, Kolter R, Guo JH, et al. A Bacillus subtilis sensor kinase involved in triggering biofilm formation on the roots of tomato plants. Mol Microbiol. 2012;85(3):418–30. 61. Beauregard PB, Chai Y, Vlamakis H, Losick R, Kolter R. Bacillus subtilis biofilm induction by plant polysaccharides. Proc Natl Acad Sci USA. 2013;110(17):E1621–1630. 62. Leclere V, Marti R, Bechet M, Fickers P, Jacques P. The lipopeptides mycosubtilin and surfactin enhance spreading of Bacillus subtilis strains by their surface-active properties. Arch Microbiol. 2006;186(6):475–83. 63. Lopez D, Fischbach MA, Chu F, Losick R, Kolter R. Structurally diverse natural products that cause potassium leakage trigger multicellularity in Bacillus subtilis. Proc Natl Acad Sci USA. 2009;106(1):280–5. 64. Ongena M, Jacques P. Bacillus lipopeptides: versatile weapons for plant disease biocontrol. Trends Microbiol. 2008;16(3):115–25. 65. Jakoby M, Wang HY, Reidt W, Weisshaar B, Bauer P. FRU (BHLH029) is required for induction of iron mobilization genes in Arabidopsis thaliana. FEBS Lett. 2004;577(3):528–34. 66. Zhang N, Wu K, He X, Li SQ, Zhang ZH, Shen B, et al. A new bioorganic fertilizer can effectively control banana wilt by strong colonization with Bacillus subtilis N11. Plant Soil. 2011;344(1-2):87–97. 67. Hamon MA, Lazazzera BA. The sporulation transcription factor Spo0A is required for biofilm development in Bacillus subtilis. Mol Microbiol. 2001;42(5):1199–209.
Page 20 of 20
68. Schatz MC, Delcher AL, Salzberg SL. Assembly of large genomes using second-generation sequencing. Genome Res. 2010;20(9):1165–73. 69. Delcher AL, Bratke KA, Powers EC, Salzberg SL. Identifying bacterial genes and endosymbiont DNA with Glimmer. Bioinformatics. 2007;23(6):673–9. 70. Hyatt D, Chen GL, Locascio PF, Land ML, Larimer FW, Hauser LJ. Prodigal: prokaryotic gene recognition and translation initiation site identification. BMC Bioinformatics. 2010;11:119. 71. Pati A. GenePRIMP: a gene prediction improvement pipeline for prokaryotic genomes. Nat Methods. 2010;7:455–7. 72. Carver T, Berriman M, Tivey A, Patel C, Bohme U, Barrell BG, et al. Artemis and ACT: viewing, annotating and comparing sequences stored in a relational database. Bioinformatics. 2008;24(23):2672–6. 73. Mcclure R, Balasubramanian D, Sun Y, Bobrovskyy M, Sumby P, Genco CA, et al. Computational analysis of bacterial RNA-Seq data. Nucleic Acids Res. 2013;41(14):e140. 74. Tatusov RL, Fedorova ND, Jackson JD, Jacobs AR, Kiryutin B, Koonin EV, et al. The COG database: an updated version includes eukaryotes. BMC Bioinformatics. 2003;4:41. 75. Punta M, Coggill PC, Eberhardt RY, Mistry J, Tate J, Boursnell C, et al. The Pfam protein families database. Nucleic Acids Res. 2012;40(Database issue):D290–301. 76. Lowe TM, Eddy SR. tRNAscan-SE: a program for improved detection of transfer RNA genes in genomic sequence. Nucleic Acids Res. 1997;25(5):955–64. 77. Lagesen K, Hallin P, Rodland EA, Staerfeldt HH, Rognes T, Ussery DW. RNAmmer: consistent and rapid annotation of ribosomal RNA genes. Nucleic Acids Res. 2007;35(9):3100–8. 78. Siguier P. ISfinder: the reference centre for bacterial insertion sequences. Nucleic Acids Res. 2006;34(90001):D32–6. 79. Dhillon BK, Chiu TA, Laird MR, Langille MG, Brinkman FS. IslandViewer update: Improved genomic island discovery and visualization. Nucleic Acids Res. 2013;41(Web Server issue):W129–132. 80. Bezuidt O, Lima-Mendez G, Reva ON. SEQWord Gene Island Sniffer: a program to study the lateral genetic exchange among bacteria. World Acad Sci Eng Tech. 2009;58:410–5. 81. Zhou Y, Liang YJ, Lynch KH, Dennis JJ, Wishart DS. PHAST: a fast phage search tool. Nucleic Acids Res. 2011;39(Web Server issue):W347–352. 82. Kurtz S, Phillppy A, Delcher AL, Smoot M, Shumway M, Antonescu C, et al. Versatile and open software for comparing large genomes. Genome Biol. 2004;5(2):R12. 83. Treangen TJ, Messeguer X. M-GCAT: interactively and efficiently constructing large-scale multiple genome comparison frameworks in closely related species. BMC Bioinformatics. 2006;7:433. 84. Krzywinski M, Schein J, Birol I, Connors J, Gascoyne R, Horsman D, et al. Circos: an information aesthetic for comparative genomics. Genome Res. 2009;19(9):1639–45. 85. Fischer S, Brunk BP, Chen F, Gao X, Harb OS, Iodice JB, et al. Using OrthoMCL to assign proteins to OrthoMCL-DB groups or to cluster proteomes into new ortholog groups. Curr Protoc Bioinformatics. 2011;Chapter 6:Unit 6.12.1–19. 86. Enright AJ, Dongen SV, Ouzounis CA. An efficient algorithm for large-scale detection of protein families. Nucleic Acids Res. 2002;30(7):1575–84. 87. Chen HB, Boutros PC. VennDiagram: a package for the generation of highlycustomizable Venn and Euler diagrams in R. BMC Bioinformatics. 2011;12:35. 88. Katoh K, Standley DM. MAFFT multiple sequence alignment software version 7: improvements in performance and usability. Mol Biol Evol. 2013;30(4):772–80. 89. Swofford DL. PAUP*. Phylogenetic Analysis Using Parsimony (*and Other Methods). 2002. 90. Mortazavi A, Williams BA, McCue K, Schaeffer L, Wold B. Mapping and quantifying mammalian transcriptomes by RNA-Seq. Nat Methods. 2008;5(7):621–8. 91. Roberts A, Trapnell C, Donaghey J, Rinn JL, Pachter L. Improving RNA-Seq expression estimates by correcting for fragment bias. Genome Biol. 2011;12(3):R22. 92. Benjamini Y, Hochberg Y. Controlling the false discovery rate: a practical and powerful approach to multiple testing. J Roy Stat Soc B Met. 1995;57(1):289–300. 93. Wang LK, Feng ZX, Wang X, Wang XW, Zhang XG. DEGseq: an R package for identifying differentially expressed genes from RNA-seq data. Bioinformatics. 2010;26(1):136–8. 94. Livak KJ, Schmittgen TD. Analysis of relative gene expression data using real-time quantitative PCR and the 2(-Delta Delta C(T)) Method. Methods. 2001;25(4):402–8.