Thymidine incorporation and secondary production estimates followed Fuhrman ..... into thymine and sugar by means of thymidine phosphorylase [18, 25] and.
Microb. Ecol. (1982)8:101-114
MICRC)BI~L E C O L O G Y
Bacterial Secondary Production in Freshwater Measured by 3H-thymidine Incorporation Method Bo Riemann, ~ Jed Fuhrman, 2 and Farooq Azam 3 ~FreshwaterBiologicalLaboratory,Universityof Copenhagen, Helsingorsgade51, DK-3400 Hillerod,Denmark; 2Marine SciencesResearchCenter, State Universityof New York at StonyBrook, Long Island, New York I 1794; 3Scripps Institutionof Oceanography,Institute of Marine Resources, Universityof California, La Jolla, California92093 Abstract. Bacterial secondary production in lake water was measured by 3H-thymidine incorporation into DNA. The application of the method to freshwater systems studied required (l) thymidine concentration > 10 nM (10-2 5 nM) evaluated from isotope dilution by varying the specific activity of labeled thymidine, (2) short incubation periods less than 1 hour, and (3) partial purification of the DNA fraction for measuring 3H-thymidine incorporation. During 2 diel studies, bacterial productivity was compared to phytoplankton primary production and extracellular release of organic carbon. Diel changes in bacterial growth suggested substantial activity during the morning and evening. Possible mechanisms of control of bacterial growth, such as extracellular release of organic carbon, are discussed. Introduction
Much of the organic matter produced by phytoplankton in lakes is decomposed within the water column by bacteria [12, 17, 26] or grazed by herbivores. Quantification of the routes and rates of organic matter flux through these 2 pathways has been hampered by insufficiences in methodology. Since the organic matter in lake water is chemically diverse and physically heterogenous, a direct measurement of the flux of various chemical constituents into bacteria is a tedious if not impossible undertaking. Concentrations of all constituents must be determined, as well as the radiotracer uptake rate of the substrate in order that mass flux of the substrate of interest can be computed. This has been attempted for some components of the dissolved organic matter (DOM) pool [1, 5, 24], but there is no method available for measuring flux of polymers or particulate organic matter (POM). In our studies of the role of bacteria in the flux of material and energy through the pelagic limnetic food webs, we assumed that measurements of the rates of bacterial secondary production would allow steady-state calculations of the rate at which material moves through the bacterial component. This approach was made possible by the recent development of methods for measuring bacterial secondary production rates in seawater [6, 9]. The object of the present study 0095-3628/82/0008-0101 $02.60 9 1982 Springer-VerlagNew York Inc.
102
B. Riemann et al.
was to determine the optimum conditions for measuring bacterial secondary p r o d u c t i o n b y t h e p r o c e d u r e o f F u h r m a n a n d A z a m [6] w h e n a p p l i e d t o l a k e systems. A second objective was to measure bacterial secondary production in lakes of varied trophic status and to identify environmental factors that might control bacterial production. These include rate of primary production, diel changes in the environment, and phytoplankton exudation of DOM.
Materials and M e t h o d s
Water samples were collected from Lake Hodges near San Diego, California and from the following 5 Danish lakes differing with respect to nutrient content and primary production: Lake Slaaen and hypereutrophic Lake Lilleso are situated in the central part of Jutland, and their primary production rates are 70 and 1,200 g C m -2 year -1, respectively. Lake Esrom, Lake Mosso, and Frederiksborg Slotsso have primary production estimates of about 240, 300, and 500 g C m -2 year-% respectively [21]. Thymidine incorporation and secondary production estimates followed Fuhrman and Azam [6, 7] except where indicated. Incorporation kinetics were carried out in the laboratory in the dark at the ambient temperature. Samples were incubated with either 1.2--48 nM [3H-methyl]-thymidine (20--80 Ci/mmol, New England Nuclear) or 1.6-34 nM 3H-D-glucose (18.1 Ci./mmol, New England Nuclear). All blanks were prepared with formalin fixed samples (1% final concentration). Extraction of specific macromolecular fractions by hydrolysis (DNA, RNA, and protein) followed Fuhrman and Azam [7]. Samples were extracted in (1) an equal volume of 10% ice-cold trichloroacetic acid (TCA) for 5-15 min, (2) 0.5 N NaOH (final concentration) at 60 ~ for 1 h, then chilled, and acidified with 0.13 volumes of 1 g ml-' TCA, (3) an equal volume of 10% TCA at 95-100*C for 1 h, then chilled. The ice-cold TCA extracts the soluble pools from the cells, and the cold TCA insoluble material collected on 0.45 um Millipore filters contains 3H in DNA, RNA, and protein fractions. The NaOH treated samples contain RNA and protein fraction in the cold TCA precipitate and the 95-100~ TCA extraction contains only the protein fraction. The amount of 3H in DNA, RNA, and protein fractions was calculated by subtraction. Addition of a "cartier solution" followed Fuhrman and Azam [7]. In selected experiments, a thymidine isotope dilution approach was applied [16]. Since this approach was designed for sediments, a few details are given here. To aliquots of 20 ml water samples, 0.5 nmoles 3H-thymidine (corresponding to 25 nM) as weU as unlabeled thymidine concentrations from 0.5-5 nmoles (corresponding to 25-250 nM) were added. Incubations were carried out in the dark in the laboratory at 1 I*C. After 45 min, 1 sample and 1 blank (formalin killed), both containing 3H-thymidine and no unlabeled thymidine, were extracted for specific macromolecular fractions [7]. All other samples were assayed for radioactivity in TCA insoluble material. The percent 3H in D N A fraction obtained from the macromolecular fractionations was assumed to be the same in all samples. Plots were made of the reciprocal of the amount of 3H incorporated into D N A fractions against the concentration of unlabeled thymidine added. The negative intercept on the abscissa refers to dilution of the added tbymidine by means of pools of thymidine and other endogenous precursors [16]. The isotope dilution factor was calculated according to the formula dpm x moles 2.2 x 10TM • Ci where dpm is obtained from the intercept on the ordinate, moles is obtained from the negative intercept on the abscissa, and Ci is 3H-thymidine added. Number of cells produced per unit time and volume were then calculated by multiplying the isotope dilution factor with 2.1 • 10 TM cells produced per mole thymidine incorporated [7].
Bacteria Production Measured by 3H-thymidine
103
Moriarty and Pollard's [ 16] approach was tested on water samples from eutrophic Frederiksborg Slotss~, prefiltered through 1.0 ttm Nuclepore filters, and diluted 6-fold in 0.45 #m filtered water from the same station. The 1.0/~m filter removed all phyto- and microzooplankton, and 80% of the bacteria present in the/-aw water passed through the filter. The bacteria were grown in the dark at 11"(2 and bubbled with air for 4 days, and productivity was checked daily by means of the 2 thymidine techniques. Conversion o f thymidine incorporated into bacterial production was made using the factor of 2.1 • 10 ~s cells produced per mole thymidine incorporated when "purified" D N A radioactivity was measured. This is based on 1.7 • 10 ~s cells produced per mol [7] corrected for 20% non-DNA activity in the TCA insoluble material. When calculations were based on results obtained from TCA insoluble material, the percentage 3H in D N A was determined and the factor 2.1 • 10 t8 cells produced per mole was corrected accordingly. D N A per cell and isotope dilution is assumed to be the same as in inshore marine environments. We are in the process of measuring these parameters in freshwater. During 2 diel studies on Frederiksborg Slotsso, thymidine incorporation and glucose uptake were measured by in situ incubations in 100 ml Jena bottles. On November 17-I8, 1980, all bottles were filled at sunrise, and thymidine (24 nM) and glucose (1.6 nM) were added at intervals of 3 h. All incubations lasted 45 min. Twenty ml aliquots were pipetted into small glass bottles kept on ice. After cooling for 1 min, 20 ml 10% TCA was added and samples were assayed for radioactivity in TCA insoluble material, according to Fuhrman and Azam [6]. On April 6-7, 1981, a 5 liter glass bottle was filled at sunrise, and aliquots of 40 ml were incubated with 3H-thymidine (24 nM) in 100 ml Jena bottles for 30 min.
Photosynthetic Carbon Fixation and Release o f Extracellular Organic Carbon During the diel study of November 17-18, 100 ml samples in Jena bottles were incubated with ~4CO2 (0.14 ,~Ci ml ~) in situ for 24 h. Incubations were initiated at sunrise (8:30 AM local time). Sunset was 3:30 PM local time. During the time between incubations and filtration (5-15 min), the bottles were stored cold in the light during the day and in darkness during the night. The microorganisms were then size fractionated into 2 size fractions: 1, total > 0.2 t~m (0.2 t~m Sartorius filters), and 2, < 0.8 tzm > 0.2 #m, mainly bacteria, but possibly some small phytoplankton also, which might have passed the 0.8/~m Unipore filters. Aliquots (15-20 ml) were gravity filtered through the 0.8 ~m filters, while filtration through 0.2 ~m Sartorius membranes was at vacuum pressure o f < 20 cm Hg. Five ml scintillation cocktail (Aqualuma, Lumac) was added before LScounting in a Delta 300 liquid scintillation counter (Tracor Analytical). Counting efficiency was determined using internal standards. During the diel study on April 6-7, a 5 liter glass bottle was incubated in situ with ~*CO~ (0.40 ~Ci ml-~). Aliquots of 20 ml were removed every 3.2 h and size fractionated as described above, except that 0.6 #m filters were used instead of 0.8 ~tm filters.
Enumeration o f Bacteria The method of Hobbie et al. [10] was used, with minor changes. Two 2 ml samples were stained with 0.2 ml acridine orange (AO) solution (1:1,000 in citrate buffer, pH 6.6) and diluted with 8 ml double-distilled water. The samples were filtered through 0.2 #m Unipore filters (47 m m in diameter, prestained in Irgalan black). Before counting, the dried filters were cut into wedges, and 2 wedges from each filter were mounted in Cargille immersion oil (type B) on a microscopic slide. Counting was carried out using a Leitz orthoplan microscope (fitted with a HBO-200 mercury lamp, a BP 450-490 bandpass filter, a RKP beam splitter, and an LP 515 barrier filter). Thirty randomly chosen fields of 3,055 t~m2 each were counted. Cell size was obtained from measurements of 250 cells. Volume was converted to biomass by multiplying 1.21 • 10 -~3 g C # m -3 [23].
104
B. Riemann et al.
Chlorophyl The phytoplanktonchlorophylcontent was extractedin methanol [20] and measured spectrophotometricailyfor chlorophyla without correctingfor pheopigments. Results
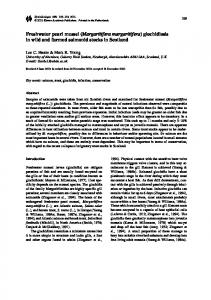
Time Course of 3H-thymidine Incorporation Time course o f thymidine incorporation into D N A (Fig. 1) was linear for all 6 lakes for the first 30 minutes and, except for Lake Lilleso and Lake Hodges, the linearity continued to 60 min. In most cases, it is convenient to use 5-30 min incubation periods to obtain reliable counts. Blanks, prepared from formalin fixed samples before addition of 3H-thymidine, did not increase during 60 min. Radioactivity in the D N A fraction (as a percentage of cold TCA precipitate) decreased with time. The percentage varied from lake to lake. The observed decreases of the activity in the D N A fraction (as a percentage of cold TCA precipitate) were caused by an increase in 3H in the protein fraction, whereas the activity in the R N A fraction remained essentially constant with time. 3H in the R NA fraction varied from 26 to 49% (percentage of cold TCA) in the six lakes studied, and 3H in the protein fraction varied from 14 to 49%. Thymidine incorporation rates varied from 0.005-0.198 nmol 3H 1-1 h -1 from the 6 lakes.
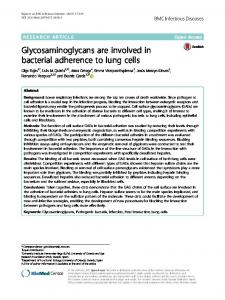
Concentration-dependence of JH-thymidine Incorporation We sought to determine the m i n i m u m addition of 3H-thymidine necessary to maximally label the extracellular and intracellular thymidine pools (and hence DNA). aH-thymidine into cold TCA precipitate increased with increasing 3Hthymidine concentrations added (Fig. 2). Additions of more than 9.6 nmol liter -t did not increase 3H-incorporation rate. Similar results were obtained for incorporation o f radioactivity into purified D N A compared to those obtained from cold TCA precipitate (data not shown). Percentage 3H in D N A fraction (percent o f cold TCA precipitate) remained essentially constant with increasing amount o f aH-thymidine.
Concentration-dependence of ~H-glucose Uptake Azam and Hodson (3) found that the uptake of glucose continues to increase in nanomolar to millimolar range. We considered however that the scavenger uptake mechanisms for thymidine might saturate at low concentrations. Glucose uptake kinetics are also included to provide a comparison of the kinetic patterns. 3H-glucose uptake rate increased almost linearly with increasing 3Hglucose concentration (Fig. 2). In 5 of the experiments, acceleration of uptake decreased at high concentrations, whereas in 3 experiments linearity continued to the highest amount of glucose added.
Bacteria Production Measured by 3H-thymidine
105
0 9
/
7
' ~ o
\
s Frederbksborg SloIssl
9
Llllesl
S
/
30
20 3
1
~.
/
10
2 i___1
I
9
x E
L Hosst
1t.
,(
J.
L Esrom
10 9
6 Z
9
c =
./
./
9 J!"
/
/
=3
o
i /
=:
to
L SI~Rn
/
3
k Hodges
Z
./
10
/ 0
./
I /
10
20
30
~
SO
60 INCUBATION PERIOD l a i n I
Time course of 3H-thymidine incorporation into D N A ( 0 - - - 0 ) , and, as % of incorporation in total TCA precipitate ({~ El) for 6 lakes. 5~r indicate clam in D N A • 10 2 a n d O indicate cpm in D N A • 10% Fig. 1.
Isotope Dilution Moriarty and Pollard [16] suggested a thymidine isotope dilution procedure to correct for isotope dilution due to de novo synthesis ofdeoxythymidine monophosphate (dTMP). We used this procedure in varied freshwater environments, and 4 experiments (Fig. 3) were selected to cover the range of results. In experiment 3, a straight line isotope curve was obtained, as in the experiments of Moriarty and Pollard [16], with marine sediment suspensions. X-intercept was - 3 . 7 nmole per 20 ml sample. In contrast, experiments 1, 2 and 4 showed a complex incorporation pattern which could not be fitted to a straight line. Using the data that best fit a straight line (Exp. 2 and 3), the calculated amount of cells produced per liter per hour would be l.l • 107 (Exp. 2) and 1.2 • 10 s
106
B. R i e m a n n
et al.
(Exp. 3) c o m p a r e d to the results o b t a i n e d f r o m o u r standard p r o c e d u r e which gave 8.8 X 10⁶ (Exp. 2) and 1.7 • 107 (Exp. 3).
Diel Variations in Thymidine Incorporation and Glucose Uptake T h e rate o f t h y m i d i n e i n c o r p o r a t i o n into cold T C A precipitate in eutrophic Frederiksborg Slotsso increased during early m o r n i n g a n d then decreased slowly until 8 PM (Fig. 4A; sunset at 3:30 aM). At m i d n i g h t a new increase was seen, followed b y a decrease. At sunrise, a new increase was seen. T h e t u r n o v e r rate o f 3H-glucose was low in the m o r n i n g o f N o v e m b e r 17, m o r e t h a n d o u b l e d during the day, a n d at sunrise on N o v e m b e r 18, a small decrease was seen. Both changes in substrate concentration a n d / o r cell kinetics m i g h t be responsible for the o b s e r v e d changes in glucose uptake. During April 6-7, similar variations in t h y m i d i n e i n c o r p o r a t i o n were seen as during N o v e m b e r 17-18 (Fig. 4B). Later e x p e r i m e n t s revealed that 3H in D N A fraction (as a percentage o f total 3H in cold T C A precipitate) v a r i e d between 18 a n d 38% ( m e a n 26%) in Frederiksborg Slotsso with 45 m i n incubations. T h y m i d i n e i n c o r p o r a t i o n rates during the 2 diel studies were, therefore, multiplied by 0.26 to correct for the presence o f radioactivity in m a c r o m o l e c u l e s other t h a n in D N A , a n d m u l tiplied with the factor 2.1 • 1018 cells p r o d u c e d per m o l t h y m i d i n e i n c o r p o r a t e d into D N A [6]. T h e specific i n c o r p o r a t i o n rates o f 3 H - t h y m i d i n e into D N A varied f r o m 1.3 • 10 -11 n m o l cell -] d a y -1 in N o v e m b e r to 1.8 • 10 -I1 n m o l cell -1 day -1 in April.
Photosynthetic Carbon Fixation and Release of Exudates P r i m a r y p r o d u c t i o n was low (23.4 m g C m -3 d -l) during the e x p e r i m e n t o f N o v e m b e r 17-18, but very high (923 m g C m -3 d -1) during the e x p e r i m e n t o f April 6 - 7 (Table 1). T h e p h y t o p l a n k t o n chlorophyl a content was 6 #g liter -1 on N o v e m b e r 17 a n d 71 #g liter -1 on April 6. Exudate release, which a p p e a r e d in 0.2-0.8 # m fraction (bacterial utilization o f exudates), followed a similar pattern. Bacterial secondary p r o d u c t i o n estimates calculated f r o m Fig. 4 varied m u c h less t h a n the p r i m a r y production. Therefore, bacterial secondary production, expressed as percent o f the p r i m a r y production, decreased greatly f r o m winter e x p e r i m e n t s (7.3%) to the springtime e x p e r i m e n t (0.6%). Bacterial biom a s s in fact decreased (from 9 1 - 5 0 m g C m-3), while p r i m a r y p r o d u c t i o n increased a b o u t 40-fold. T h e theoretical doubling t i m e for the bacterial b i o m a s s gave 37 a n d 7 days, respectively. T h e t e m p e r a t u r e w a s 6~ during N o v e m b e r 17-18 a n d 7.5~ during April 6-7.
T h e effects of increasing the concentration of 3H-thymidine on the rate of 3H-incorporation in cold TCA insoluble material (O O) and of increasing the concentration of 3H-D-glucose on rate of glucose assimilation (0-----0) measured for water samples from 5 Danish lakes. A, B, C, D: Frcdcriksborg Slotsso, E: Lake Slaacn, F: Lake LiUcso, G: Lake Esrom, and H: Lake Mosso. Bars indicate SE, n = 3. Fig. 2.
Bacteria Production Measured by SH-thymidine
107
,'"[ ~o
-
,.,.,d,
~s~.~ 5l
i
3(
3
/
~I01
~I~5- ~
'
A
/
}/
53H-Thynlidin@ ( 2
6
~:" o 9(
13 3H-Gluc.ose