Sep 30, 2008 - Cherokee Nation Environmental Programs, 208 E. Allen Road, Tahlequah, OK 74464, USA f. Southern Ute Indian Tribe, Air Quality Program, ...
Baseline ambient gaseous ammonia concentrations in the Four Corners area and ea..... (DOI: 10.1... Page 1 of 11
Journal of Environmental Monitoring Journals
Journal of Environmental Monitoring
Advance Articles
DOI: 10.1039/b807984f
J. Environ. Monit., 2008 DOI: 10.1039/b807984f Paper
Baseline ambient gaseous ammonia concentrations in the Four Corners area and eastern Oklahoma, USA Mark E. Sather *a, Johnson Mathew b, Nghia Nguyen b, John Lay b, George Golod b, Robert Vet c, Joseph Cotie d, Terry Hertel d, Erik Aaboe d, Ryan Callison e, Jacque Adam e, Danielle Keese e, Jeremy Freise e, April Hathcoat e, Brenda Sakizzie f, Michael King f, Chris Lee f, Sylvia Oliva g, George San Miguel g, Leon Crow h and Frank Geasland h aAir Quality Analysis Section, U.S. Environmental Protection Agency (EPA) Region 6, 1445 Ross Avenue, Dallas, TX 75202, USA bHouston Laboratory, U.S. EPA Region 6, 10625 Fallstone Road, Houston, TX 77099, USA cEnvironment Canada, Air Quality Research Division, 4905 Dufferin Street, Toronto, Ontario, Canada M3H 5T4 dNew Mexico Environment Department, 1301 Siler Road Building B, Santa Fe, NM 87507, USA eCherokee Nation Environmental Programs, 208 E. Allen Road, Tahlequah, OK 74464, USA fSouthern Ute Indian Tribe, Air Quality Program, P.O. Box 737, Ignacio, CO 81137, USA gMesa Verde National Park, Natural Resources, Mesa Verde, CO 81330, USA hQuapaw Tribe of Oklahoma, P.O. Box 765, Quapaw, OK 74363, USA Received 12th May 2008 , Accepted 11th September 2008 First published on the web 25th September 2008
Ambient ammonia monitoring using Ogawa passive samplers was conducted in the Four Corners area and eastern Oklahoma, USA during 2007. The resulting data will be useful in the multipollutant management of ozone, nitrogen oxides, and visibility (atmospheric regional haze) in the Four Corners area, an area with growing oil/gas production and increasing coal-based power plant construction. The passive monitoring data also add new ambient ammonia concentration information for the U.S. and will be useful to scientists involved in present and future visibility modeling exercises. Three week integrated passive ammonia samples were taken at five sites in the Four Corners area and two sites in eastern Oklahoma from December, 2006 through December, 2007 (January, 2008 for two sites). Results show significantly higher regional background ammonia concentrations in eastern Oklahoma (1.8 parts per billion (ppb) arithmetic mean) compared to the Four Corners area (0.2 ppb arithmetic mean). Annual mean ammonia concentrations for all Four Corners area sites for the 2007 study ranged from 0.2 ppb to 1.5 ppb. Peak ambient ammonia concentrations occurred in the spring and summer in both areas. The passive samplers deployed at the Stilwell, Oklahoma site compared favorably with other passive samplers and a continuous ammonia monitoring instrument.
1. Introduction In late 2005 the Four Corners Air Quality Task Force (FCAQTF) was formed to address air quality issues
http://www.rsc.org/delivery/_ArticleLinking/ArticleLinking.cfm?JournalCode=EM&Year=2008&... 9/30/2008
Baseline ambient gaseous ammonia concentrations in the Four Corners area and ea..... (DOI: 10.1... Page 2 of 11 associated with growth in the oil/gas production and coal-fired power plant industries.1 The Four Corners area includes southwest Colorado, northwest New Mexico, southeast Utah, and northeast Arizona. One of the concerns of the FCAQTF is that ambient ozone concentrations in the area may not meet the new U.S. 8 hour ozone standard of 0.075 parts per million (ppm).2 In order to mitigate increases in ambient ozone concentrations, certain controls are being considered for the ozone precursor nitrogen oxides, such as selective and non-selective catalytic reduction on oil and gas production equipment and power plants. The use of selective or non-selective catalytic reduction controls would, however, result in the release of more ammonia emissions to the atmosphere. Ammonia is known to be a precursor of fine particulate matter,3 which adversely affects public health, atmospheric visibility, and acid deposition patterns.4 Currently, it is not known whether or not increased ammonia emissions in the Four Corners area would be significant enough to cause a degradation in atmospheric visibility. To enable air quality managers to answer this question in the future, ambient monitoring of gaseous ammonia (NH3) was instituted to set a current baseline. Then in the future, after nitrogen oxide controls have been implemented along with any gaseous ammonia increases due to growth in other sources such as population and mobile vehicles, ambient monitoring of gaseous NH3 can take place again to compare to the current baseline. Thus, the states of New Mexico and Colorado in the Four Corners area requested to work with the U.S. Environmental Protection Agency (EPA) Region 6 in 2006 in order to obtain a current ambient ammonia monitoring baseline. To keep costs low Ogawa passive sampling devices (PSDs) were deployed for the baseline study, and the U.S. EPA Region 6 laboratory in Houston, Texas, provided the laboratory preparation and ion chromatographic (IC) analytical work. Simple to use PSDs, including the Ogawa PSD, have been successfully used in many published ambient ammonia studies around the world.5–15 The U.S. currently lacks a routine national Federal Reference Method (FRM) ambient monitoring network for ammonia, so the data from the 2007 study in the Four Corners area and eastern Oklahoma also add new ambient ammonia concentration information for the U.S., adding to previous ambient ammonia monitoring data collected in eastern, western, and southeastern U.S. states.14–19
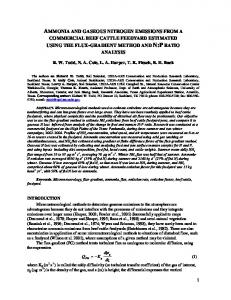
2. Experimental 2.1 Study sites There were six passive ammonia sites that sampled for the entire year-long study. In addition, in response to the Quapaw Tribe's interest in obtaining ambient ammonia concentrations around a nearby mushroom processing facility, a seventh site participated in the study for the last eight 3 week integrated sampling periods. A map of all study sites from the three different areas, including annual mean ammonia concentrations for the six sites that operated year-long, is depicted in Fig. 1. A variety of site types was desired and included: regional background sites in both the Four Corners area (Mesa Verde National Park) and eastern Oklahoma (Stilwell); oil and gas development impacted sites in the Four Corners area (Navajo Lake and Southern Ute). The Southern Ute site was also impacted by mobile source emissions, being nearby a major highway; a coal-fired power plant impacted site in the Four Corners area (Substation); an urban site in the Four Corners area (Farmington Airport), and finally a nearby source oriented site situated to record higher ambient ammonia concentrations (Quapaw site in northeastern Oklahoma).
http://www.rsc.org/delivery/_ArticleLinking/ArticleLinking.cfm?JournalCode=EM&Year=2008&... 9/30/2008
Baseline ambient gaseous ammonia concentrations in the Four Corners area and ea..... (DOI: 10.1... Page 3 of 11
Fig. 1 Map of the 2007 passive ammonia monitoring sites and annual mean concentrations in the Four Corners area and eastern Oklahoma. 2.2 Field instrumentation For the passive ammonia sampling, Ogawa passive sampling devices (PSDs) were used, previously obtained from Ogawa & Co., Inc., Pompano Beach, Florida. The Ogawa PSD is composed of a solid cylindrical polymeric body (two centimetres by three centimetres long) with a diffusion barrier and two http://www.rsc.org/delivery/_ArticleLinking/ArticleLinking.cfm?JournalCode=EM&Year=2008&... 9/30/2008
Baseline ambient gaseous ammonia concentrations in the Four Corners area and ea..... (DOI: 10.1... Page 4 of 11 stainless steel screens on each side. At most of the sites the ammonia PSDs were mounted on aluminium pole assemblies about 1.5 metres above ground level (agl). A few of the sites installed the aluminium pole assemblies on top of existing air monitoring sampling trailers (about 5 metres agl). Each PSD was placed under a rain shelter for wind face velocity and precipitation protection. Gaseous ammonia, upon natural diffusion into the PSD, was collected on filters coated with citric acid. The filters used in this study were purchased from Ogawa by the New Mexico Environment Department, the Cherokee Nation, and the U.S. EPA Region 6 laboratory in Houston. The detection limit of the ammonia PSD in our study, defined as two times the standard deviation of the blank values, was 0.18 ug m−3 for 3 week integrated deployments, which compares favorably with previous passive ammonia field studies.13,14,20 Every deployment involved duplicate sampling for both field samples and field transport blanks. The two field transport blanks were averaged and subtracted from each field sample. The two field samples were then averaged for the final ammonia concentration. All calculations were done in accordance with the Ogawa sampling protocol for ammonia21 and included corrections for local ambient temperature. Since 2004 the Cherokee Nation has operated a continuous ammonia monitor at their Stilwell, Oklahoma site. The continuous ammonia monitor is a Pranalytica Nitrolux 200 continuous trace level ammonia analyser, which measures ambient ammonia concentrations by ultrasonic acoustic spectroscopy. Weekly performance checks (e.g. for error or maintenance flags, filter or battery change, laser overheat) on the Nitrolux instrument are conducted by the Cherokee Nation, and once every year the instrument is sent to Pranalytica for checkout and any required repairs. For 2007 the Stilwell Nitrolux instrument was operated from January 1 through September 15, 2007. 2.3 Laboratory procedures 2.3.1 Sample preparation and handling. Since gaseous ammonia is ubiquitous in trace quantities in the laboratory environment (e.g. from human breath and in moisture from sweat glands), and since it was desired to credibly monitor low regional background ammonia concentrations, great care was taken in preparing and handling the passive ammonia PSDs. First, the ammonia PSDs were prepared in an ammonia-scrubbed down-draft clean hood. The PSDs were then placed into thick (at least 0.05 millimetres thick) Ziploc bags, and the Ziploc bags were then placed into SC475 68 millilitre (ml) plastic vials with tight screw caps (from Environmental Express in Mt. Pleasant, South Carolina). The plastic vials, along with log sheets and return mail labels, were then packed into thermal bags for either FedEx or UPS small box shipping. Onsite sample change-out training was conducted with all of the operators for all of the sites for consistency and to further help in minimizing sample contamination. Powder-free disposable gloves were employed by all laboratory chemists and monitoring site operators. 2.3.2 Chemical analyses. After each three weeks of sampling the ammonia PSDs were shipped back to the EPA Region 6 Houston laboratory. The ammonia filters were removed from the PSDs under the down-draft clean hood. The filters were then extracted with 8 ml of deionized water and ultrasonicated for 45 minutes. Sample solutions were analysed using a Metrohm MIC-2 advanced modular ion chromatograph (IC). The Metrohm IC was equipped with a guard column and MetroSep C2-250 (4 millimetres (mm) by 250 mm) separation column for cations. An eluent mixture of 4 millimoles (mM) tartaric acid plus 1 mM 2,6-pyridine dicarboxylic acid (PDCA) at a flow rate of 1 ml min−1 was used to elute the ammonium ion (IC detection limit for the ammonium ion = 0.025 ppm). The IC was used in nonsuppressed conductivity detection mode with detector settings at a range of one millisiemen per centimetre (mS cm−1) and 100 uS cm−1 full scale.
3. Results and discussion 3.1 Precision and comparisons of the passive data The precision for the year-long study was reviewed by analysis of the absolute differences of 124 data pairs from all seven sites (Fig. 2), using the median absolute difference and 90th percentile of all of the absolute difference values per Sirois and Vet.22 The absolute difference between duplicate field samples
http://www.rsc.org/delivery/_ArticleLinking/ArticleLinking.cfm?JournalCode=EM&Year=2008&... 9/30/2008
Baseline ambient gaseous ammonia concentrations in the Four Corners area and ea..... (DOI: 10.1... Page 5 of 11 had a median value of 0.1 ppb with 90% having a 0.3 ppb or lower difference. Lower precision was measured at the higher ambient ammonia concentrations (all from the Quapaw site). For the 16 data pairs from the Quapaw site the absolute difference between duplicate field samples had a median value of 0.2 ppb with 90% having a 0.75 ppb or lower difference.
Fig. 2 Precision of the Ogawa NH3 PSDs for the 2007 Four Corners area and eastern Oklahoma passive ammonia study. The Ogawa PSDs used in this study have been successfully validated and used in previous published studies.13,14,18 To support our confidence that the Ogawa PSDs were providing reliable indicators of ambient ammonia concentrations, we conducted two data comparisons. First, at the Stilwell site, the passive ammonia data were compared to the continuously running Nitrolux monitoring data. The Nitrolux monitor operated through September 15, 2007. As seen in Fig. 3, the passive ammonia data overall tracked well with the Nitrolux ammonia data, with the Nitrolux ammonia concentrations usually higher than the passive ammonia concentrations. The correlation coefficient, r, was 0.74. The difference in arithmetic means was 0.7 ppb, but was not statistically significant (2.6 ppb mean ammonia concentration for the Nitrolux versus a 1.9 ppb mean ammonia concentration for the passive samples). It is important to note that since the Nitrolux monitor was not calibrated on site (i.e. only calibrated by the manufacturer once a year), the data from the Nitrolux monitor could only be viewed as providing an estimate of ambient ammonia concentrations rather than providing more precise measurements of ambient ammonia concentrations. Second, also at the Stilwell site, the passive ammonia data were compared to supplementary passive ammonia data being collected through a short-term Environment Canada study. Both studies used the Ogawa passive sampling device (PSD), with the Environment Canada Ogawa PSDs slightly modified (i.e. using 25 millimetre diameter filters instead of 14.5 millimetre diameter filters, and having more holes in the diffusion barriers), and operating at 2 week intervals instead of 3 week intervals. The Environment Canada PSDs were loaded, unloaded and analysed at their own laboratory in Toronto, Canada. The Environment Canada ammonia study ran through March, 2007, so a three month comparison with the EPA Region 6 passive data was possible. As seen in Table 1 the six week and twelve week average concentrations of the EPA Region 6 passive ammonia data and the Environment Canada passive ammonia data compared within +7% at best and within −20% at worst (calculated as 100× [EPAEC]/EPA). Table 1 Comparison of EPA Region 6 and Environment Canada Ogawa passive sample data at the Stilwell site; mean ammonia concentrations; 2007 Time period
EPA Region 6 sampler mean (ppb) Environment Canada sampler mean (ppb)
1/2–2/13 (first 6 weeks) 1.5 2/13–3/27 (second 6 weeks) 2.0
1.4 2.4
http://www.rsc.org/delivery/_ArticleLinking/ArticleLinking.cfm?JournalCode=EM&Year=2008&... 9/30/2008
Baseline ambient gaseous ammonia concentrations in the Four Corners area and ea..... (DOI: 10.1... Page 6 of 11 1/2–3/27 (entire 12 weeks) 1.7
1.9
Fig. 3 Comparison of 3 week integrated passive ammonia data with continuous hourly Nitrolux ammonia data at the Stilwell, Oklahoma site; data capture of the Nitrolux monitor > 70% for each time period; 12/12/06–9/11/07. Additional information which contributed to confidence in the passive data was obtained from the Quapaw Tribe source-oriented site. This site not only provided important data for the tribe concerning ambient ammonia concentrations close to a local mushroom processing facility (i.e. about 0.75 miles NNE of the facility), but also checked the ability of the PSD to adequately record higher concentrations of ambient ammonia concentrations compared to the considerably lower ambient ammonia concentrations recorded at the Four Corners area and Stilwell sites. Fig. 4 shows the time series of all passive ammonia samples taken at the Quapaw site (first samples taken July 13–July 31, 2007). The first four sampling periods involved collocated samples taken at slightly different heights (3 metres agl versus 5 metres agl), and those samples tracked close with the platform ambient ammonia concentration average at 4.9 ppb and the trailer top ambient ammonia concentration average at 5.0 ppb. For the second four sampling periods, the trailer top pair of duplicate samples was moved about 0.25 miles closer to the mushroom processing plant. All samples tracked well with the samples closer to the mushroom processing facility recording the higher passive ammonia concentrations (6.4 ppb average at 0.5 miles from the facility versus a 4.8 ppb average at 0.75 miles from the facility).
http://www.rsc.org/delivery/_ArticleLinking/ArticleLinking.cfm?JournalCode=EM&Year=2008&... 9/30/2008
Baseline ambient gaseous ammonia concentrations in the Four Corners area and ea..... (DOI: 10.1... Page 7 of 11
Fig. 4 Passive ammonia data time series for the Quapaw, Oklahoma site; 3 week integrated samples. 3.2 Time series analyses A time series of the 3 week integrated passive ammonia samples was constructed for each site for the yearlong 2007 study period. For the five Four Corners area sites (Fig. 5) the time series traces of passive ammonia concentrations generally increased from the beginning winter months to the warmer summer months, reaching peak ammonia concentrations during the July 10–July 31, 2007 time period, before generally decreasing in concentrations during the fall months. There were two notable exceptions to this general trend. First, the Southern Ute site recorded an additional peak ammonia concentration during the spring (the April 17–May 8, 2007 time period). There is moderate local agricultural activity around the Southern Ute site, so field fertilization probably caused the spring peak. Second, the Substation site, impacted by two coal-fired power plants, recorded additional peak ammonia concentrations during the fall (the October 2–October 23, 2007 and the October 23–November 13, 2007 time periods). These fall concentrations at the Substation site were also the highest ambient ammonia concentrations recorded in the Four Corners area for the year-long study.
Fig. 5 Passive ammonia data time series for the Four Corners area sites; 3 week integrated samples; ending dates 1/3/08 for Southern Ute and 1/22/08 for Mesa Verde NP. The time series trace for the Stilwell, Oklahoma site is shown in Fig. 6. The Stilwell site recorded its peak ambient ammonia concentration during the spring (the March 27–April 17, 2007 time period), probably due to agricultural fertilization activity. Table 2 displays the summary statistics for the five Four Corners area sites and the Stilwell, Oklahoma site. Of note is that the Stilwell site, representing regional http://www.rsc.org/delivery/_ArticleLinking/ArticleLinking.cfm?JournalCode=EM&Year=2008&... 9/30/2008
Baseline ambient gaseous ammonia concentrations in the Four Corners area and ea..... (DOI: 10.1... Page 8 of 11 background ammonia concentrations for eastern Oklahoma (1.8 ppb arithmetic mean), was nine times higher than the regional background site for the Four Corners area (0.2 ppb arithmetic mean at Mesa Verde National Park). Agricultural ammonia emissions, including microbial decomposition of animal waste from confined animal feeding operations (CAFOs), are higher in the region around eastern Oklahoma compared to the Four Corners area, resulting in a greater county ammonia emissions density for the Stilwell site versus the Four Corners area.23 Table 2 Summary statistics for Four Corners area and Stilwell, Oklahoma passive ammonia sites; 3 week integrated samples; December 12, 2006–December 26, 2007a Site (type) Substation (power plant impacted) Farmington Airport (urban) Navajo Lake (rural, oil/gas impacted) Southern Ute (oil/gas/mobile source impacted) Mesa Verde NP (rural, regional background) Stilwell (rural, regional background)
Mean (ppb)
Max. Min. (ppb) (ppb)
95% confidence interval (ppb) around mean (ppb)
1.1 1.5 0.2
0.2 0.5 No detection 0.3
3.5 2.9 0.5
0.9 0.5 0.1
0.7–1.6 1.2–1.7 0.1–0.3
1.5
0.3
0.7–1.0
No detection 0.8
0.6
0.2
0.1–0.3
3.3
0.6
1.5–2.1
0.8 0.2 1.8
a
Ending dates December 31, 2007 for Substation, Farmington Airport and Navajo Lake, January 3, 2008 for Southern Ute, and January 22, 2008 for Mesa Verde NP.
Fig. 6 Passive ammonia data time series for the Stilwell, Oklahoma site; 3 week integrated samples. In the Four Corners area, the urban Farmington Airport site recorded the highest annual mean ammonia concentration (1.5 ppb), followed by the power plant impacted Substation site (1.1 ppb). The rural Navajo Lake site, located in an area with growing oil and gas production, recorded an annual mean ammonia concentration (0.2 ppb) identical to the regional background site at Mesa Verde National Park. The Southern Ute site, also located in an area with growing oil and gas production but with added mobile source impacts, recorded a higher annual mean of 0.8 ppb.
http://www.rsc.org/delivery/_ArticleLinking/ArticleLinking.cfm?JournalCode=EM&Year=2008&... 9/30/2008
Baseline ambient gaseous ammonia concentrations in the Four Corners area and ea..... (DOI: 10.1... Page 9 of 11
3.3 Examination of the passive data in a national and international context The Four Corners area and eastern Oklahoma passive ammonia data were reviewed in the context of other United States and International ammonia monitoring studies. Table 3 presents summaries of some yearlong ambient ammonia monitoring studies culled from a current literature review. The Four Corners area and eastern Oklahoma ranges of annual mean concentrations for ambient ammonia are lower compared to the International and Delaware, U.S. studies, but similar to the concentration ranges seen in the southeastern U.S. states. Peak ambient ammonia concentrations in the spring or summer or fall were seen at sites in all of the studies, with winter maxima occurrences rare. Table 3 Comparison of Four Corners area and eastern Oklahoma passive ammonia data with other USA and International studies Study area (reference #)
Time period
Range of annual mean concentrations (ppb)
Four Corners Area, USA, New Mexico, Colorado (this study) Eastern Oklahoma, USA (this study) Delaware inland bays, USA14 SE USA, Georgia, Alabama, Mississippi, Florida17 Denmark heathland24 Scotland, UK 10 m from road edges25
12/2006–1/2008
0.2–1.5
12/2006–12/2007
1.8 (one site)
4/2000–4/2001 1/2004–12/2004
8.6 0.23–2.44
5/1995–5/1996 4/2002–4/2003
2.9 (one site) 0.2–4.5
10/1995–10/1996 1.3–9 and 4/1998–4/1999 36 regional sites in Asia, Africa 9/1999–8/2000