BAYESIAN STATISTICS 9, pp. 421–438. J. M. Bernardo, M. J. Bayarri, J. O. Berger, A. P. Dawid, D. Heckerman, A. F. M. Smith and M. West (Eds.) c Oxford University Press, 2011 �
Bayesian Methods in Pharmacovigilance David Madigan Columbia University, USA
[email protected]
Patrick Ryan GlaxoSmithKline Research and Development, USA
[email protected]
Shawn Simpson
Ivan Zorych
Columbia University, USA
[email protected]
Columbia University, USA
[email protected] Summary
Regulators such as the U.S. Food and Drug Administration have elaborate, multi-year processes for approving new drugs as safe and effective. Nonetheless, in recent years, several approved drugs have been withdrawn from the market because of serious and sometimes fatal side effects. We describe statistical methods for post-approval data analysis that attempt to detect drug safety problems as quickly as possible. Bayesian approaches are especially useful because of the high dimensionality of the data, and, in the future, for incorporating disparate sources of information. Keywords and Phrases: Drug safety; Shrinkage; High-dimensional modeling; Poisson regression.
1. INTRODUCTION Increasing scientific, regulatory and public scrutiny focuses on the obligation of the medical community, pharmaceutical industry and health authorities to ensure that marketed drugs have acceptable benefit-risk profiles. This is an intricate and ongoing process that begins with carefully designed randomized clinical trials prior to approval but continues after regulatory market authorization when the drug is in widespread clinical use. In the post-approval environment, surveillance schemes based on spontaneous reporting systems (SRS) represent a cornerstone for the early detection of drug hazards that are novel by virtue of their clinical nature, severity and/or frequency. SRS databases collect reports of adverse events made directly David Madigan is Professor of Statistics, Shawn Simpson is a PhD student, and Ivan Zorych is a Research Scientist, all at Columbia University. Patrick Ryan is a Research Scientist at GlaxoSmithKline.
422
D. Madigan et al.
to the regulator or to the product manufacturer by clinicians or patients without regard to any assessment of causality. Such spontaneous report databases present a number of well-documented limitations such as under-reporting, over-reporting, and duplicate reporting. Furthermore, SRS databases have limited temporal information with regard to duration of exposure and the time order of exposure and condition. Despite the limitations inherent in SRS-based pharmacovigilance, analytic methods for signal detection in spontaneous report databases have attracted considerable attention in the last decade, and several different methods have become well established, both in commercial software products and in the literature. All of the more widely used methods compute measures of “disproportionality” for specific drugcondition pairs. That is, the methods quantify the extent to which a given condition is disproportionally reported with a given drug. We provide a brief description of a Bayesian shrinkage approach due to DuMouchel that has been widely adopted in this context. More recent work has focused on Bayesian regression approaches that attempt to deal with certain types of confounding. Newer data sources have emerged that overcome some of the SRS limitations but present methodological and logistical challenges of their own. Longitudinal observational databases (LODs) provide time-stamped patient-level medical information, such as periods of drug exposure and dates of diagnoses. Typical examples include medical claims databases and electronic health record systems. The scale of some of these databases presents interesting computational challenges – the larger claims databases contain upwards of 50 million lives with up to 10 years of data per life. A nascent literature on signal detection in LODs now exists including adaptations of some of the Bayesian methods developed in the SRS context. We also consider one particular approach that draws on a method known in epidemiology as the selfcontrolled case series. We present a Bayesian analysis of this method and describe some generalizations. Because our focus in this paper is on drug safety in the post-approval context, we do not consider randomized clinical trials (RCTs). While most RCTs occur prior to drug approval, it is not uncommon for pharmaceutical manufacturers to conduct post-approval trials, especially for potential new indications. Ross et al. (2009) describe one particular meta-analytic approach to drug safety analysis in the RCT context. The use of pre-approval RCTs to inform post-approval drug safety analyses is also beyond the scope of this paper, but the use of Bayesian methods for this purpose seems apt. 2. DRUG SAFETY TERMINOLOGY In what follows, we will use the term “signal.” What do we mean by a signal? The drug safety literature often uses the term signal to refer to early hints that point at the possibility of novel “unintended drug effects.” Stolley (1981) defines an unintended drug effect as a noxious and unintended response to a drug in humans that occurs at usually recommended doses. The precise definition of signal however, remains somewhat elusive. Meyboom et al. (1997) provide an eloquent discussion and settle on: “A set of data constituting a hypothesis that is relevant to the rational and safe use of a medicine. Such data are usually clinical, pharmacological, pathological, or epidemiological in nature. A signal consists of a hypothesis together with data and arguments.”
Bayesian Pharmacovigilance
423
Crucially, most authors consider a signal to be more than just a statistical association. Some authors use the term “signal of disproportionate reporting” (SDR) when discussing purely statistical signals without clinical, pharmacological and/or (pharmaco)epidemiological context (Hauben et al., 2005, Hauben and Reich, 2005). In reality, most SDRs that emerge from spontaneous report databases in particular represent noise because the reports are associated with treatment indications (i.e., confounding by indication), co-prescribing patterns, co-morbid illnesses, protopathic bias, channeling bias, or other reporting artifacts, or, the reported adverse events are already labeled or are medically trivial. In this sense, SDRs generate hypotheses. Confirmation of such hypotheses goes beyond the purview of spontaneous reports and draws on the pharmacoepidemiologist’s extensive armamentarium. Longitudinal observational databases can provide a richer context in which to study drug safety. There, signals that arise from marginal drug-condition associations might reasonably be referred to as SDRs, but more elaborate approaches that adjust for potential confounders, while falling short of definitively establishing causation, could yield “signals.” Because we focus on observational data, the potential for confounding is ever present and indeed is the central problem in pharmacovigilance. Following Greenland and Morgenstern (2001) we view confounding as a causal concept. This is germane because ultimately we want to know which drugs cause which adverse effects. Consider a population of people exposed to a particular drug D (the D population) and suppose a fraction a of these people experience an adverse effect A. Ideally we would compare a with the fraction b of these people that would have experienced A had they not been exposed to D. The ratio a/b (or possibly some other function of a and b) then measures the causal effect of D on A. In reality, b is unobserved and instead we compare a to the fraction c of the unexposed or comparator population (the D� population) that experienced the adverse effect. Thus we would like to have a/b but instead we work with a/c. Confounding occurs if c differs from b. In the drug safety context this can happen in myriad scenarios including: (i) Individuals in the D� population took a drug other than D at a different rate that the individuals in population D. This other drug increases or decreases the probability of A and thus increases or decreases c (relative to b). (ii) The condition(s) that led people in the D� population to take the other drug may themselves increase or decrease the probability of A (i.e., c) relative to b. (iii) The relative absence in the D� population of the condition(s) that led people to take the target drug may causally increase or decrease the probability of A (i.e., c) relative to b. While one can never rule out the possibility of confounding, the primary goal of the methods we describe is to be diminish its impact. 3. SPONTANEOUS REPORT DATABASES Pharmaceutical companies, health authorities and drug monitoring centers use SRS databases for global drug safety screening. These databases comprise case reports of suspected adverse drug reactions and/or adverse events (i.e., any medical event coincident with drug therapy). The precise details of each SRS differ in terms of size and scope, statutory reporting mandates, surveillance selectivity or intensity,
424
D. Madigan et al.
and organizational structure. Prominent SRSs include the Adverse Event Reporting System (AERs) of the United States Food and Drug Administration (FDA), the Yellow Card Scheme of the Medicines and Healthcare Products Regulatory Agency (MHRA), and the international pharmacovigilance program of the World Health Organization (the WHO Uppsala Monitoring Center). Regulators created these systems to provide early warnings of possible safety problems that would be difficult to detect during clinical drug development because of the power limitations, constricted range of demographics, exclusion of patients with extensive co-morbid illnesses and co-medications, and limited duration of follow-up, characteristic of clinical trials. Although legally required in some countries, there is de facto voluntary reporting for all but pharmaceutical manufacturers. This introduces differential reporting of adverse events. An extensive literature describes the factors that influence reporting behavior – see, for example, Belton (1997) or De Bruin et al. (2002). At the outset, drug safety professionals review individual reports and can instigate extensive follow-up, especially for serious events. The algorithms we discuss in this paper in no way obviate the need for this first level of case review. Individual records in SRS databases typically include limited demographic information (age and sex), date of report, one or more drugs and one or more adverse event codes. The adverse event codes typically come from a standardized vocabulary such as MedDRA. One of the drugs may be labeled as ”suspect” but we ignore this in what follows. Since there over 10,000 entries in MedDRA and over 10,000 licensed drugs (at least in the U.S.), one can think of each record as a vector with over 20,000 dimensions, albeit a sparse vector. Since SRS databases only contain reports of adverse effects, they fail to provide a denominator, i.e., the number of individuals consuming a particular drug. 3.1. Disproportionality Methods Disproportionality analysis methods for drug safety surveillance comprise the most widely used class of analytic methods for signal detection in SRSs. These methods include the DuMouchel’s Bayesian multi-item gamma-Poisson shrinker (MGPS), the Bayesian confidence propagation neural network (BCPNN), proportional reporting ratios (PRR), and reporting odds ratios (ROR). The methods search SRS databases for potential signals, focusing on low-dimensional projections of the data, specifically 2-dimensional contingency tables. Table 1 shows a typical table. Table
1: A fictitious 2-dimensional projection of an SRS database. Drugi =Yes Drugi =No
AEj =Yes w00 = 20 w10 = 100
AEj =No w01 = 100 w11 = 980
Total 120 1080
The basic task of a disproportionality method then is to rank order these tables in order of “interestingness.” Different disproportionality methods focus on different statistical measures of association as their measure of interestingness. MGPS focuses on the “reporting ratio” (RR). The observed RR for the drug i – adverse event j combination is the observed number of occurrences of the combination (20 in the example above) divided by the expected number of occurrences under a model of independence (12 in the example above). Thus the observed RR for this example is 20/12 or 1 2/3; this combination occurred about 67% more often than expected.
Bayesian Pharmacovigilance
425
Natural (though not necessarily unbiased) estimates of various quantities emerge from tables like Table 1. Table 2 lists the measures of association in common use. Table
2: Common measures of association for 2 × 2 tables in SRS analysis.
Measure of Association Reporting Ratio (RR)
Probabilistic Interpretation
Proportional Reporting Ratio (PRR) Reporting Odds Ratio (ROR) Information Component (IC)
P r(AE|Drug P r(AE) P r(AE|Drug) P r(AE|notDrug P r(AE|Drug)/P r(notAE|Drug) P r(AE|notDrug)/P r(notAE|notDrug) P r(AE|Drug) log2 P r(AE)
0
In the SRS context, however, the count in the w00 cell is often small, leading to substantial variability (and hence uncertainty about the true value of the measure of association) despite the often large numbers of reports overall. PRR and ROR do not address the variability issue whereas MGPS and BCPNN adopt a Bayesian approach to address the issue.
!"#$%&'()'&%*(&+,'
*
+
,
!"#$&'()
.
/
+ , / +* /*1+**
*
+
,
-
.
/
0
!"#$%%
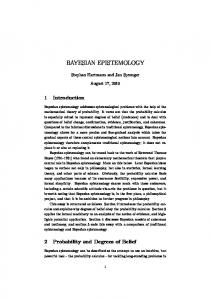
Figure
1: GPS shrinkage in the AERS database.
MGPS and its predecessor GPS (DuMouchel, 1999; DuMouchel and Pregibon, 2001) are the most widely used methods and they provide a singular example of large-scale Bayesian shrinkage in routine use by regulators and pharmaceutical manufacturers worldwide. GPS proceeds as follows. Let w00 (i, j) denote the w00 entry for the two-by-two table for the ith drug and the jth adverse event. Assume that each w00 (i, j) is a draw from a Poisson distribution with mean m(i, j). Let m(i, j) = λ(i, j) ∗ E(i, j), where E(i, j) = w0+ (i, j) ∗ w+1 (i, j)/w++ (i, j), i.e., the expected value of w00 (i, j) under independence, and is assumed to be known. The goal is to estimate the λ’s. GPS assumes that the λ’s arise a particular 5-parameter prior distribution, namely a mixture of two gamma distributions. GPS adopts an empirical Bayes approach and chooses the five hyperparameters to maximize the
426
D. Madigan et al.
marginal likelihood. Commonly reported summary statistics include the geometric mean of the posterior distribution for each λ or the fifth percentile of the posterior (“EBGM” and “EB05” respectively). For further details see DuMouchel (1999). Figure 1 illustrates the effect of the shrinkage for a sample of 2X2 tables in AERS. Each point represents a particular drug-adverse effect combination and shows the EBGM estimate versus the observed RR, both on the log scale. Tables where w00 = 1, i.e., drug-adverse effect combinations with a single report in AERS (denoted by the open circles), shrink substantially whereas tables with w00 of say 50 and above (denoted by the solid circles) hardly shrink at all. 3.2. Bayesian Logistic Regression Disproportionality analyses typically stratify by age, sex, and year of report but otherwise provide no protection against confounding. One particular kind of confounding risk has come to be known as the “innocent bystander” effect in the drug safety literature. Consider a fictitious drug Rosinex that causes nausea. Suppose that 90% of the individuals taking Rosinex experience nausea whereas 10% of the individuals not taking Rosinex experience nausea. Further, suppose that Rosinex makes one susceptible to eye infections. Consequently, due to standard practice guidelines, 90% of the Rosinex users also take a prophylactic antibiotic called Ganclex whereas about 1% of the non-Rosinex users take Ganclex. Ganclex does not cause nausea, yet, the observed RR for Ganclex-nausea will be over 4! By contrast, a logistic regression of nausea on both Ganclex and Rosinex, because it adjusts for Rosinex, provides a estimated Ganclex coefficient of zero, i.e., it does the right thing. As we mentioned above, SRS databases such as AERS can include upwards of 10,000 different drug names (including many redundant drug names). Thus a regression of a particular AE on all the drugs, involves simultaneous estimation of over 10,000 regression coefficients. While the number of reports in a typical SRS database greatly exceeds 10,000, maximum likelihood logistic can still result in a lack of convergence, large estimated coefficient variances, and poor predictive accuracy in these applications. Regularized or Bayesian logistic regression addresses these concerns. Concretely, we are interested in conditional probability models of the general form p(yi = +1|β, xi ) = ψ(β T xi ), where yi represents the presence or absence of a particular adverse effect in the ith report, xbi is a binary vector of drug indicators, and ψ is the logistic link function. We have experimented with two choices of prior distribution for the regression coefficient vector β. Perhaps the simplest Bayesian approach to the logistic regression model is to impose a univariate Gaussian prior with mean 0 and variance τ > 0 on each parameter βj . Finding the maximum a posteriori (MAP) estimate of β with this prior is equivalent to ridge regression for the logistic model (Santner and Duffy 1989; Le Cessie and Van Houwelingen 1992). Alternatively, a sparseness inducing hierarchical prior distribution for β gives each βj a Gaussian prior with mean 0 and variance τj and then an exponential prior on the τj ’s: „ « γj γj p(τj |γ) = exp − τj . 2 2 with γ > 0. Integrating out τj then gives a (nonhierarchical) double exponential or Laplace prior distribution. MAP estimation in this context corresponds to the well-known lasso (Tibshirani, 1995).
Bayesian Pharmacovigilance
427
Computing the full posterior distribution for β is computationally demanding and even efficiently calculating the posterior mode requires some care. We use a cyclic coordinate ascent algorithm described in Genkin et al. (2007) and implemented in the open source BXR software1 . Yuan et al. (2010) provide a review of related methods and software.
Figure
2: An illustration of the “Innocent Bystander” problem in the WHO database.
Figure
3: An illustration of the “Masking” problem in the WHO database.
Figures 2 and 3 from Caster et al. (2010) provide examples that contrast the logistic regression approach with a Bayesian disproportionality method due to Bate et al. (1998). Figure 2 considers hemorrhagic cystitis, a well-known adverse effect associated with anti-cancer drugs such as Cyclophosphamide and Ifosamide. The circles show the disproportionality estimate for different drugs while the triangles show the logistic regression coefficients. Consider the drug mesna. Mesna is commonly co-prescribed with cyclophosphamide to prevent hemorrhagic cystitis. The 1 http://www.bayesianregression.org
428
D. Madigan et al.
disproportionality method focuses on the 2X2 table formed by mesna and hemorrhagic cystitis and yields a point estimate of close to 2. The logistic regression estimate accounts for the co-prescribing relation with cyclophosphamide and yields a point estimate of zero. Figure 3 considers an issue known as “masking.” The drug baycol was withdrawn from the market because of its association with rhabdomyolysis, a rare and serious condition. Because of the publicity surrounding this withdrawal, many reports of rhabdomyolysis flowed into spontaneous report databases worldwide. Figure 3 shows disproportionality and logistic regression estimates for rhabdomyolysis and a number of anti-depressant drugs, none of which are suspected to cause rhabdomyolysis. The disproportionality methods are sensitive to artificial elevations in the background rate of rhabdomyolysis while the logistic regression estimates behave reasonably. Caster et al. (2010) describe an extensive application of Bayesian logistic regression to the World Health Organization’s SRS and we refer the interested reader to that paper for further details. Performing 10,000+ large logistic regressions presents some computational challenges. Choosing hyperparameters via cross-validation, estimating drug-drug interactions, and computing posterior variances remain cumbersome at best. Our current efforts focus on massively parallel computing using graphics processing units (GPUs). 4. LONGITUDINAL OBSERVATIONAL DATABASES Newer data sources have emerged that overcome some of the limitations of SRSs but present methodological and logistical challenges of their own. Longitudinal observational databases (LODs) provide time-stamped patient-level medical information. Typical examples include medical claims databases and electronic health record systems. The scale of some of these databases presents interesting computational challenges – the larger claims databases contain upwards of 50 million lives with up to 10 years of data per life.
Figure 4: A longitudinal observational dataset with three patients, three distinct drugs (A, B, and C) and two distinct conditions (X and O)
Figure 4 provides a schematic of LOD data for coverage periods for three patients. Patient 1 consumed drug A during two separate drug eras. While on drug A, patient 1 experienced condition X on three different occasions. Patient 2 consumed drugs A, B, and C during successive non-overlapping eras. Patient 2 experienced condition X before consuming any drugs and also experienced condition X while consuming drug C. Patient 2 consumed drug C and later starting taking drug B in addition to drug C. This patient experienced condition O while taking both B and C and later experienced conditions O and X after the drug B and C eras had ended. The methodological challenge is to estimate the strength of the association between
Bayesian Pharmacovigilance
429
each drug and each condition, while appropriately accounting for covariates such as other drugs and conditions, patient demographics, etc. A nascent literature on signal detection in LODs exists. Several papers have looked at vaccine safety in this context, see, for example, Lieu et al. (2007), McClure et al. (2008), and Walker (2010). The Vaccine Safety Datalink provides an early example of a LOD specifically designed for safety. Papers focusing on drug safety include Curtis et al. (2008), Jin et al. (2008), Kulldorff et al. (2008), Li (2009), Noren et al. (2008), and Schneeweiss et al. (2009). 4.1. Statistical Methods for Signal Detection in LODs Methods currently under investigation fall into four broad categories: (i) Disproportionality Methods. These are the widely used methods for spontaneous reports and include PRR, MGPS, BCPNN, etc. Application of these methods to LODs presents an array of choices and current research focuses on empirical evaluation – see Madigan et al. (2010). (ii) Cohort Methods The epidemiology literature describes various cohort-based methods and associated matching algorithms. Such approaches have been widely used in drug safety although infrequently with databases on the scale of current LODs. Both cohorts and comparators can be defined in various ways and current research focuses on basic design questions. Schneeweiss (2010) argues in favor of so-called new user designs in which covariates are measured prior to the start of drug exposure. See also Brookhart et al. (2010). (iii) Case-based Methods Case-control methods are also widely used in drug safety, although again, applying them to LOD-sized databases presents new challenges. Matching is the central challenge in designing case control studies and propensity-based methods have the potential to work on large-scale data. The self-controlled case series approach offers many advantages, and scaling up appears feasible. A key challenge to address in the drug safety context is confounding by time-varying covariates such as disease flairs. (iv) Surveillance Approaches All of the above methods estimate an effect size relating a drug (or group of drugs) to a medical outcome. As such these can be used in a surveillance context – the effect size is recomputed as new data arrive and a surveillance algorithm triggers an alarm when certain temporal patterns emerge. Standard surveillance techniques include SPRT, CUSUM, and hidden Markov models. The next section describes one particular case-based method in detail. 5. THE SELF-CONTROLLED CASE SERIES METHOD Farrington (1995) proposed the self-controlled case series (SCCS) method in order to estimate the relative incidence of adverse events to assess vaccine safety. The major features of SCCS are that (1) it automatically controls for fixed individual baseline covariates, and (2) only cases (individuals with at least one event) need to be included in the analysis. With SCCS, each individual serves as their own control. SCCS is one of several self-controlled methods that the epidemiology literature describes, many of which are variants on the case-crossover method (Maclure, 1991).
430
D. Madigan et al.
However unlike the case-crossover method, which requires the choice of a comparator time period to serve as a control, SCCS makes use of all available temporal information without the need for selection. Epidemiological applications of SCCS tend to focus on situations with small sample sizes and few exposure variables of interest. In contrast, the problem of drug safety surveillance in LODs must contend with millions of individuals and millions of potential drug exposures. The size of the problem presents a major computational challenge – ensuring the availability of an efficient optimization procedure is essential for a feasible implementation. 5.1. One Drug, One Adverse Event We will first focus on the case where there is one drug (i.e., Vioxx) and one adverse event (i.e., myocardial infarction, MI) of interest. To set up the notation, i will index individuals from 1 to N . Events and exposures in our databases are recorded with dates, so temporal information is available down to the level of days (indexed by d). Let τi be the number of days that person i is observed, with (i,d) being their dth day of observation. The number of events on day (i,d) is denoted by yid , and drug exposure is indicated by xid , where xid = 1 if i is exposed to the drug on (i,d), and 0 otherwise. SCCS assumes that AEs arise according to a non-homogeneous Poisson process, where the underlying event rate is modulated by drug exposure. We will start with the simple assumption that person i has their own individual baseline event rate eφi , which is constant over time. Under the SCCS model, drug exposure yields a multiplicative effect of eβ on the baseline incidence rate. In other words, the event intensity for person i on day d can be written as a function of drug exposure xid , λid = eφi +βxid . The number of events observed on (i,d) given the current exposure status is distributed as a Poisson random variable with rate λid , which has the following density: y P (yid | xid ) = e−λid λidid /yid !. The SCCS likelihood contribution for person i is the joint probability of the observed sequence of events, conditional on the observed exposures Lci = P (yi1 , . . . , yiτi | xi1 , . . . , xiτi ) = P (yi | xi ) =
Y τi
d=1
P (yid | xid )
There are two assumptions implicit in the Poisson model that allow us to write out this likelihood: (i) events are conditionally independent given exposures yid ⊥ ⊥ yid� | xi
for d �= d� , and
(ii) past events are conditionally independent of future exposures given the current exposure yid ⊥ ⊥ xid� | xid for d �= d� . These assumptions are likely to be violated in practice (i.e., , one might expect that having an MI increase the future risk of an MI and also impacts future drug usage), however they allow for simplifications in the model.
Bayesian Pharmacovigilance
431
AtP this point one could maximixe the full log-likelihood over all individuals (lc = i log Lci ) in order to estimate the parameters. However since our primary goal is to assess drug safety, the drug effect β is of primary interest and the personspecific φi effects are nuisance parameters. A further complication is that claims databases can contain well over 10 million patients. Since the dimension of the vector of person-specific parameters φ = (φ1 , . . . , φN )� is equal to the number of individuals N , estimation of φ would call for optimization in an ultra high-dimensional space and presumably would be computationally prohibitive. In order to avoid estimating the nuisance parameter, we can condition on its sufficient statistic and remove the dependence on φi . Under the Poisson model this sufficient statistic is the total number of events P person i has over their entire observation period, which we denote by ni = d yid . For a non-homogeneous Poisson process, ni is a Poisson random variable with rate parameter equal to the cumulative intensity over the observation period: Xτi Xτi βx ni | xi ∼ Poisson( λid = eφi e id ) d=1
d=1
In our case the cumulative intensity is a sum (rather than an integral) since we assume a constant intensity over each day. Conditioning on ni yields the following likelihood for person i: «yid τi „ Y P ( yi | xi ) e βxid P ∝ Lci = P ( yi | xi , ni ) = βxid� P ( ni | xi ) d� e d=1
Notice that because ni is sufficient, the individual likelihood in the above expression is no longer contains φi . This conditional likelihood takes the form of a multinomial, but differs from a typical multinomial regression. Here the number of “bins” (observed days) varies by person, the β parameter is constant across days, and the covariates xid vary by day. Assuming that patients are independent, the full conditional likelihood is simply the product of the individual likelihoods. Lc ∝
τi „ N Y Y
i=1 d=1
e βxid βxid� d� e
P
«yid
Estimation of the drug effect can now proceed by maximizing the conditional log-likelihood to obtain βˆCM LE . Winkelmann (2008) showed that this estimator is consistent and asymptotically Normal in the Poisson case. It is clear from the expresson for the likelihood that if person i has no observed events (yi = 0), they will have a contribution of Lci = 1. Consequently, person i has no effect on the estimation, and it follows that only cases (ni ≥ 1) need to be included in the analysis. SCCS does a within-person comparison of the event rate during exposure to the event rate while unexposed, and thus the method is “self-controlled”. Intuitively it follows that if i has no events, they cannot provide any information about the relative rate at which they have events. That the SCCS analysis relies solely on data from cases is a substantial computational advantage – since the incidence rate of most AEs is relatively low, typical SCCS analyses will utilize only a modest fraction of the total number of patients.
432
D. Madigan et al.
5.2. Multiple Drug Exposures and Drug Interactions So far we have discussed the scenario where there is one AE and one drug of interest. However patients generally take multiple drugs throughout the course of their observation period. Additionally, patients may take many different drugs at the same time point, which leads to a potential for drug interaction effects. In order to account for the presence of multiple drugs and interactions, the intensity expression for the SCCS model can be extended in a natural way. Suppose that there are p different drugs of interest, each with a corresponding exposure indicator xidj = 1 if exposed to drug j on day (i,d); 0 otherwise. Let eβj be the multiplicative effect of drug j on the event rate. A multiplicative model describes the intensity for patient i on day d: λid = eφi +β
�
xid
= eφi + β1 xid1 + ··· + βp xidp ,
where xid = (xid1 , . . . , xidp )� and β = (β1 , . . . , βp )� . Since ni is still sufficient for φi , person-specific effects will once again drop out of the likelihood upon conditioning. One can derive the expression in a similar manner to the previous case of one AE and one drug case, resulting in: Lci
= P ( yi | ni , Xi ) ∝
τi Y
d=1
�
e β xid P β � xid� d� e
!yid
,
where Xi = [x�i1 . . . x�iτi ]� . To simplify the summation in the denominator, days with the same drug exposures can be grouped together. Suppose that there are Ki distinct combinations of drug exposures for person i. Each combination of exposures defines an exposure group, indexed by k = 1, . . . , Ki . For person i and exposure group k, we need to know the number of events i has while exposed to k (yik ) along with the length of time i spends in k (lik ). For person i we only require information for each of Ki exposure groups, rather than for all τi days. This allows for coarser data and more efficient storage – since patients tend to take drugs over extended periods of time, Ki is typically much smaller than τi . L
c
∝
Ki N Y Y
i=1 k=1
�
e β xik P β � xik� � k� lik e
!yik
(1)
SCCS can be further extended to include interactions and time-varying covariates (i.e., age groups). The intensity on (i,d) including two-way drug interactions and a vector of time-varying covariates zid can be written as �
λid = e φi + β xid +
P
r�=s
γrs xidr xids + α �zid .
Remark 1. In practice, many adverse effects can occur at most once in a given day suggesting a binary rather than Poisson model. One can show that adopting a logistic model yields an identical conditional likelihood to (1). Remark 2. It is straightforward to show that the conditional likelihood in (1) is log-concave.
Bayesian Pharmacovigilance
433
5.3. Bayesian Self-Controlled Case Series We have now set up the full conditional likelihood for multiple drugs, so one could proceed by finding maximum likelihood estimates of the drug parameter vector β. However in the problem of drug safety surveillance in LODs there are millions of potential drug exposure predictors (tens of thousands of drug main effects along with drug interactions). This high dimensionality leads to potential overfitting under the usual maximum likelihood approach, so regularization is necessary. We take a Bayesian approach by putting a prior over the drug effect parameter vector and performing inference based on posterior mode estimates. There are many choices of prior distributions that shrink the parameter estimates toward zero and address overfitting. We focus on the (i) Normal prior and (ii) Laplacian prior. (i) Normal prior. Here we shrink the estimates toward zero by putting an independent Normal prior on each of the parameter components. Taking the posterior mode estimates would be analogous to a ridge Poisson regression, placing a constraint on the L2 -norm of the parameter vector. (ii) Laplace prior. Under this choice of prior a portion of the posterior mode estimates will shrink all the way to zero, and their corresponding predictors will effectively be selected out of the model. This is equivalent to a lasso Poisson regression, where there is a constraint on the L1 -norm of the parameter vector estimate. Efficient algorithms exist for finding posterior modes, rendering our approach tractable even in the large-scale setting. In particular, we have adapted the cyclic-coordinate descent algorithm of Genkin et al. (2007) to the SCCS context. An open-source implementation is available at http://omop.fnih.org. 6. EXTENSIONS TO THE BAYESIAN SCCS MODEL We are currently exploring several extensions to the basic model: (i) Hierarchical model: Drugs. Drugs form drug classes. For example, Vioxx is a Cox-2 inhibitor. Cox-2 inhibitors in turn are non-steroidal anti-inflammatories. A natural extension assumes regression coefficients for drugs from within a single class arise exchangeably from a common prior distribution. This hierarchy could extend to multiple levels. (ii) Hierarchical model: AEs. AEs also form AE classes. For example, an MI is a cardiovascular thrombotic (CVT) event, a class that includes, for example, ischemic stroke and unstable angina. In turn, CVT events belong to a broader class of cardiovascular events. This extension assumes that the regression coefficients for a particular drug but for different AEs within a class arise from a common prior distribution. Again this hierarchy could extend to multiple levels. (iii) Relaxing the Independence Assumptions: Events. Farrington and Hocine (2010) explore one particular approach to allowing for event dependence although other approaches are possible.
434
D. Madigan et al.
(iv) Relaxing the Independence Assumptions: Exposures. As discussed above, the SCCS model assumes that events are conditionally independent of subsequent exposures. Farrington et al. (2009) present a relaxation of this assumption based on an estimating equations approach. Roy et al. (2006) present an alternative approach. 7. FINAL COMMENTS We have described statistical methods for post-approval drug safety signal detection, some Bayesian and some not. In the spontaneous report context, Bayesian methods offer significant advantages and represent the de facto standard approach worldwide. Considerable attention now focuses on large-scale longitudinal observational databases and basic research on methods for signal detection in that context is underway. When dealing with large numbers of drug-adverse effect combinations, the great success of the Bayesian approach on the SRS context should extend to the LOD context. Real-life LODs are noisy and have the potential to introduce all sorts of artifacts and biases into analyses. For example, conditions and the drugs prescribed to treat the conditions are often recorded simultaneously at a single visit to the doctor, even though the condition actually predated the visit. This can introduce “confounding by indication” – the drug used to treat a condition can appear to be caused by the condition. Many such challenges exist and it remains to be seen whether or not false positives will render signal detection in LODs impractical. The use of LODs to study specific drug-adverse effect combinations has become routine. The medical literature provides many examples and many different epidemiological and statistical approaches, often tailored to the specific drug and specific adverse effect. For example some adverse effects occur immediately following drug ingestion while other may take months or even years to exhibit themselves – clearly this has methodological implications. Our focus, however, is on signal detection, and this implicitly requires simultaneous consideration of many drug-adverse effects combinations. A major outstanding challenge is develop approaches that flexibly adapt to different contexts. The Observational Methods Outcomes Partnership (OMOP) is an international public-private partnership between the pharmaceutical industry and the FDA. The OMOP is implementing and evaluating methods for signal detection in LODs. Open source software for many of the methods mentioned above are available on the OMOP website, http://omop.fnih.org. A key practical barrier in pharmacovigilance research is the dearth of ground truth judgments –drug-condition pairs known to be causal or non-causal. OMOP is developing simulators to generate high-fidelity longitudinal medical records. The project is in its early stages (and a simulator written in R is available on the OMOP website) but has the potential to transform pharmacovigilance research. REFERENCES Bate, A., Lindquist, M., Edwards, I. R., Olsson, S., Orre, R., Lansner, A. and De Freitas, R. M. (1998). A Bayesian neural network method for adverse drug reaction signal generation. European J. Clinical Pharmacology 54, 315–321. Belton, K. J. (1997). Attitude survey of adverse drug-reaction reporting by health care professionals across the European Union. European J. Clinical Pharmacology 52, 423–427.
Bayesian Pharmacovigilance
435
Brookhart, M. A., Sturmer, T., Glynn, R. J., Rassen, J. and Schneeweiss, S. (2010). Confounding control in healthcare database research: Challenges and potential approaches. Medical Care 48, S114–S120. Brown, J. S., Kulldorff, M. et al. (2009). Early adverse drug event signal detection within population-based health networks using sequential methods: key methodologic considerations. Pharmacoepidemiology and Drug Safety DOI: 10.1002/pds.1706. Cameron, A. C and Trivedi, P. K. (1988). Regression Analysis of Count Data. Cambridge: University Press. Caster, O., Noren, G. N., Madigan, D. and Bate, A. (2010). Large-scale regression-based pattern discovery: The example of screening the WHO Global Drug Safety Database. Statistical Anaysis and Data Mining 3, 197–208. Curtis, J. R., Cheng, H., Delzell, E., Fram, D., Kilgore, M., Saag, K., Yun, H. and DuMouchel, W. (2008). Adaptation of Bayesian data mining algorithms to longitudinal claims data. Medical Care 46, 969–975. De Bruin, M.L., Van Puijenbroek, E. P., Egberts, A. C., Hoes, A. W. and Leufkens, H. G. (2002). Non-sedating antihistamine drugs and cardiac arrhythmias – biased risk estimates from spontaneous reporting systems? British J. Clinical Pharmacology 53, 370–374. DuMouchel, W. (1999). Bayesian data mining in large frequency tables, with an application to the FDA spontaneous reporting system. Amer. Statist. 53, 170–190. DuMouchel, W. and Pregibon, D. (2001). Empirical Bayes screening for multi-item associations. Proc. 7th Internat. Conf. on Knowledge Discovery and Data Mining, SIGKDD 2001, 67–76. Farrington, C. P. (1995). Relative incidence estimation from case series for vaccine safety evaluation. Biometrics 51, 228–235. Farrington, C. P. and Hocine, M.N. (2010). Within-individual dependence in self-controlled case series models for recurrent events. Appl. Statist. 59, 457–475. Farrington, C. P., Whitaker, H.J. and Hocine, M.N. (2009). Case series analysis for censored, perturbed or curtailed post-event exposures. Biostatistics 10, 3–16. Genkin, A., Lewis, D. D. and Madigan, D. (2007) Large-scale Bayesian logistic regression for text categorization. Technometrics 49, 291–304. Greenland, S. and Morgenstern, H. (2001). Confounding in health research. Annual Review of Public Health, 22 189–212. Hauben, M., Madigan, D., Gerrits, C. and Meyboom, R. (2005). The role of data mining in pharmacovigilance. Expert Opinion in Drug Safety 4, 929–948. Hauben, M. and Reich, J. (2005). Communication of findings in pharmacovigilance: Use of term“signal” and the need for precision in its use. Eur. J. Clinical Pharmacology 61, 479–480. Jin, H., Chen, J., He, H., Williams, G. J., Kelman, C. and O’Keefe, C. M. (2008). Mining unexpected temporal associations: Applications in detecting adverse drug reactions. IEEE Trans. Information Technology in Biomedicine 12, 488–500. Kulldorff, M., Davis, R.L., Kolczak, M., Lewis, E., Lieu, T. and Platt, R. (2008). A maximized sequential probability ratio test for drug and vaccine safety surveillance. Tech. Rep., Harvard Medical School, USA. Le Cessie, S. and van Houwelingen, J. C. (1997). Ridge estimators in logistic regression. Appl. Statist. 41, 191–201. Li, L. (2009). A conditional sequential sampling procedure for drug safety surveillance. Statistics in Medicine. DOI:10.1002/sim.3689 Lieu, T.A., Kulldorff, M., Davis, R.L., Lewis, E.M., Weintraub, E., Yih, K., Yin, R., Brown, J.S. and Platt, R. (2007). Real-time vaccine safety surveillance for the early detection of adverse events. Medical Care 45, S89–95. Maclure, M. (1991). The Case-Crossover Design: A method for studying transient effects on the risk of acute events. Amer. J. Epidemiology 133, 144–153.
436
D. Madigan et al.
Madigan, D., Bate, A., Zorych, I. and Ryan, P. (2010). Disproportionality methods for pharmacovigilance in longitudinal observational oatabases. Tech. Rep., Columbia University, USA. McClure, D. L., Glanz, J.M., Xu, S., Hambidge, S.J., Mullooly, J. P. and Baggs, J. (2008). Comparison of epidemiologic methods for active surveillance of vaccine safety. Vaccine, doi:10:1016/j.vaccine.2008.03.074. Meyboom, R.H., Egberts, A.C., Edwards, I.R., et al. (1997). Principles of signal detection in pharmacovigilance. Drug Safety 16, 35–365. Noren, G. N., Bate, A., Hopstadius, J., Star, K. and Edwards, I. R. (2008). Temporal pattern discovery for trends and transienteffects: its application to patient records. Proc. 14th Internat. Conf. on Knowledge Discovery and Data Mining, SIGKDD 2008, 963–971. Ross, J. S., Madigan, D., Hill, K.P., Egilman, D. S., Wang, Y. and Krumholz, H. M. (2009). Pooled analysis of Rofecoxib placebo-controlled clinical trial data: Lessons for post-market pharmaceutical safety surveillance. Archives of Internal Medicine 169, 1976-1985. Roy, J., Alderson, D., Hogan, J. W. and Tashima, K. T. (2006). Conditional inference methods for incomplete Poisson data with endogenous time-varying covariates. J. Amer. Statist. Assoc. 101, 424–434. Santner, T. and Duffy, D. (1989). The Statistical Analysis of Discrete Data. New York: Springer. Schneeweiss, S., Rassen, J. A., Glynn, R J., Avorn, J., Mogun, H., and Brookhart, M. A. (2009). High-dimensional propensity scoring adjustment in studies of treatment effects using health care claims data. Epidemiology 20, 512–522. Schneeweiss, S. (2010). A basic study design for expedited safety signal evaluation based on electronic healthcare data. Pharmacoepidemiology and Drug Safety 19, 858–868. Stolley, P. D. (1981). Prevention of adverse effects related to drug therapy. Preventative and Community Medicine (2nd ed.) (D.W. Clark, and P. MacMahon, eds.) Boston: Little Brown, 141–148. Tibshirani, R. (1996). Regression shrinkage and selection via the lasso. J. Roy. Statist. Soc. B 58, 267–288. Walker, A. M. (2010). Signal detection for vaccine side effects that have not been specified in advance. Pharmacoepidemiology and Drug Safety 19, 311–317. Winkelmann, R. (2008). Econometric Analysis of Count Data. Berlin: Springer. Wooldridge, J.M. (1999). Distribution-free estimation of some nonlinear panel data models. J. Econometrics 90, 77–97. Yuan, G., Chang, K., Hsieh, C. and Lin, C. (2010). A comparison of optimization methods and software for large-scale L-1 regularized linear classification. J. Machine Learning Research 11, 3183–3234.
DISCUSSION WILLIAM DUMOUCHEL (Oracle Health Sciences, USA) Professor Madigan and his co-authors have done an excellent job of describing the challenges and opportunities for Bayesian Statistics in the area of studies of drug safety. They focus on two types of observational studies, the analysis of disproportionality in spontaneous reports of drug adverse reactions, and the analysis of longitudinal medical databases. A third type of study, the randomized clinical trial, also usually involves data on adverse events, and Bayesian approaches to these studies can also contribute much to our understanding of drug safety issues.
Bayesian Pharmacovigilance
437
Regarding the analysis of spontaneous report databases, as the authors note, the need to analyze thousands, even millions of associations while screening for drugevent ”signals” presents an ideal opportunity for empirical Bayes methodology. The use of shrinkage estimates as a way to cope with lots of estimates based on sparse data and to negotiate a trade-off between bias and variance has gained widespread acceptance among practitioners in industry and at regulatory agencies. Upgrading from analysis of very many 2x2 tables to multivariate methods such as logistic regression is a logical next step that has not yet become common in practice, perhaps because those tasked with checking the data for “signals” are usually medical officers less comfortable with complex statistical methods. Solomon et al. (2006) provide an application showing how the logistic regression estimates of disproportionality can be larger than those based on 2x2 table analyses because of the masking issue that the present authors mention. Perhaps when software platforms are available that provide the fully automatic application of regression-type adjustments in the context of enterprise and regulatory databases we will also see widespread adoption of Bayesian multivariate methodology. Longitudinal observational databases are only now being assembled for intensive research and data mining on drug safety problems, and the present authors are among the pioneers in this area. Their summary of the many challenges this type of data presents, and of progress so far, is welcome, and we all welcome, indeed plead for, more Bayesian statisticians to get involved. The most work here has focused on signal strengthening rather than signal detection. That is, there are prespecified drug-event combinations to be analyzed, as opposed to a screen for totally unknown drug-event associations. Probably the most generally accepted approach is a cohort study comparing two or more drugs for the same indication, with propensity score adjustment for the selection effect inherent in an observational study. The present authors spend more time discussing a different method, the selfcontrolled case series method. Their hope is that this method will allow each patient to serve as his or her own control, while at the same time allowing use of all available temporal information, at least for patients who experience the adverse event being studied. Although this design no doubt works well for certain situations, I am skeptical of its widespread applicability for serious adverse events, mainly because of one assumption that the authors themselves admit is implicit to their approach: past events must be conditionally independent of future exposures given the current exposure. The most glaring exception is when the adverse event is the patient’s death–that certainly limits future exposure to the drug! Perhaps future research, along the lines of some of the approaches mentioned in Section 6, will get around this limitation. Finally, consider the analysis of safety data from randomized clinical trials. These are often referred to as the ”gold standard” of medical research, but the gold often shines less brightly when results from a trial sized for an efficacy outcome are being used to compare rates of relatively rare, and perhaps unanticipated, adverse events. In such cases interpretation of results from trials can get bogged down in a morass of post-hoc multiple comparisons involving highly variable contrasts. In a poster presented in this Valencia 9 I described how Bayesian hierarchical models can assist with three different aspects of this problem. Data from different trials can be combined in a global analysis. Medically related adverse event rate estimates can borrow strength from each other. And Bayesian models for covariate-by-treatment interaction can help identify vulnerable subgroups more susceptible to particular adverse events.
438
D. Madigan et al.
REPLY TO THE DISCUSSION We are grateful to Dr. DuMouchel for his insightful comments. DuMouchel has made profound and hugely influential contributions to Bayesian statistics and to drug safety. Amongst statisticians, when it comes to real-world impact, Dr. DuMouchel has few peers. DuMouchel expresses concern about the reasonableness of the assumptions underlying the self-controlled case series method. We share these concerns. Farrington’s approach makes three key assumptions: future exposures are independent of previous events, future events are independent of previous events, and the Poisson event rate is constant within time periods. Any of these can be violated (and probably usually are). However, all methods make assumptions that are potentially incorrect. We don’t think one can easily make a theoretical argument about the pros and cons of different sets of assumptions in real-world applications. Case series methods in particular trade off the advantage of self-control versus potentially undesirable modeling assumptions. To us, the advantages and disadvantages of different kinds of assumptions can best be studied experimentally. In fact, researchers have proposed a large array of methods for drug safety analysis in observational databases, but few, if any, have been studied experimentally. Very little evidence currently exists to determine appropriate scenarios for use of these competing methods. Furthermore the operating characteristics of the methods in terms of sensitivity, specificity, mean square error, etc., remain essentially unknown. These concerns apply throughout the continuum of drug safety analyses, from preliminary signal detection through refinement and evaluation. On a more positive note, we are delighted that Dr. DuMouchel highlights the role Bayesian methods can play in the analysis of clinical trial data for drug safety purposes. His recent work in that area has tremendous potential and we look forward to seeing widespread adoption. ADDITIONAL REFERENCES IN THE DISCUSSION Solomon. R. and DuMouchel, W. (2006). Contrast media and nephropathy: Findings from systematic analysis and Food and Drug Administration reports of adverse effects. Investigative Radiology 41, 651–660.