Acta Neurobiol. Exp. 2000, 60: 247-260
Beta activity: a carrier for visual attention Andrzej Wróbel Department of Neurophysiology, Nencki Institute of Experimental Biology, 3 Pasteur St., 02-093 Warsaw, Poland, Email:
[email protected]
ABSTRACT. The alpha (8-13 Hz), beta (15-25 Hz) and gamma (30-60 Hz) bands of the EEG have been long studied in clinical research because of their putative functional importance. Old experimental results indicated that repetitive stimulation of the visual pathway evoked synchronous responses at the cortical level with gain depending on frequency: oscillations within relevant bands were less damped at subsequent processing levels then others. Our current results show that in the cat, cortico-geniculate feedback has a build-in potentiation mechanism acting at around the beta frequency which activates thalamic cells and may thus lower the threshold for visual information transmission. We have also shown that enhanced beta activity is propagated along this feedback pathway solely during attentive visual behavior. This activity consists of 300 ms to 1 s long bursts which tend to correlate in time with gamma oscillatory events. Beta bursting activity spreads to all investigated visual centers, including the lateral posterior and pulvinar complex and higher cortical areas. Other supporting data on enhanced beta activity during attentivelike behavior of various species including man, are discussed. Finally, we put forward a general hypothesis which attributes the appearance of oscillations within the alpha, beta and gamma bands to different activation states of the visual system. According to this hypothesis, alpha activity characterizes idle arousal of the system, while beta bursts shift the system to an attention state that consequently allows for gamma synchronization and perception. KEY WORDS. Animals' LEP, human EEG, resonance frequencies, corticothalamic loops, visual information flow: gain and organization, alpha beta and gamma frequency bands, activation states of the visual system
INTRODUCTION The neuronal mechanisms underlying perception by the mammalian brain are poorly understood. Fast oscillatory (gamma) rhythms are believed to serve as a coactivation mechanism for populations of cells from different brain areas during the feature integration process (Eckhorn et al. 1988, Gray et al. 1989, Bressler 1990, Lopes da Silva 1991, Roskies 1999). Another hypothesized mechanism, attentional selection, posits that the same result is obtained by increasing the relative excitability of cells activated by attended objects or voluntary action (Treisman and Gelade 1980, Crick 1994). The possibility exists that both mechanisms cooperate; the attentional mechanism may activate populations of cells thereby allowing them to synchronize their activity. In a hierarchically organized system like the visual system, this hypothesis would require the harmonized activation of cell assemblies encompassing many processing levels via feedback pathways (Crick 1994, Zeki 1993). In our experiments we first approached the issue by analyzing the neuronal activity in the cortico-thalamic system of attending cats. These data are discussed together with scarce relevant observations from the literature and our own results obtained on human subjects. The paper
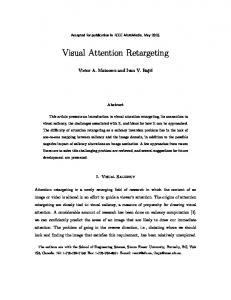
Fig. 1. Simplified scheme of the mammalian visual system. Consecutive processing levels are marked by circles. Notice the reciprocal connections between thalamic and cortical areas. LGN, lateral geniculate
nucleus; LP-P, lateral posterior - pulvinar complex; V1 and V2, primary and secondary visual cortex.
focuses mostly on the analysis of local field potentials (LFPs) as these better mirror the modulation mechanisms (e.g. attention) and allow for more direct comparison with human EEG recordings. RESONANCE FREQUENCIES IN THE VISUAL SYSTEM The mammalian visual system is hierarchically organized (Fig. 1). Sensory activation is transmitted from retina through lateral geniculate nucleus (LGN) to the primary visual cortex (V1) and higher visual centers. Principal neurons at extraretinal levels of this system are under inhibitory influence of recurrent
Fig. 2. A, Relative phosphene threshold intensity obtained with alternating electrical stimulation of the human eye (adapted from Motokawa and Ebe 1953); B, amplitude of
occipital EEG signal evoked by visual stimulation of the human retina with sinusoidally modulated light of different frequencies (adapted from Utlett and Johnson 1958).
interneurones. Separate excitatory feedback pathways control the relay structures. Such a network of recurrent loops may exert various modulatory actions on cellular firing in the frequency domain. For more than five decades researchers have known that repetitive stimulation of sensory pathways evokes synchronous responses at the cortical level with gain depending on frequency. For example electrical stimulation of the human optic nerve has shown that the phosphene threshold is lowest at 20 Hz and additional local minima are observed around 10 and between 30 and 65 Hz (Schwartz 1947, Motokawa and Ebe 1953, Fig. 2A). Relevant physiological measures were performed by stimulating the retina with sinusoidally modulated light intensity. It appeared that stimuli modulated with 10 and 20 Hz frequencies evoked a high amplitude oscillatory responses in occipital EEG recordings whereas other frequencies produced damped responses at the cortical level (Utlett and Johnson 1958 - Fig. 2B, Montagu 1967, Lopes da Silva 1970a). It has been further shown that such modulation can even
Fig. 3. Frequency characteristics of the evoked potentials (EPs) in the cat's visual system. A, Averaged EP recorded in the visual cortex and its power spectrum; B, power spectra calculated from consecutive EPs registered in the visual cortex (V1) and lateral geniculate nucleus (LGN). Dashed lines indicate frequencies of highest local power
amplitude in spectrum averaged from all constitutives (adapted from Basar 1980).
be observed at the retinal level (Hughes and Maffei 1965) and the damping coefficients increase at subsequent processing levels in LGN and V1 (Spekreijse et al. 1971). It is obvious that in a system containing excitatory recurrent loops such damping is necessary in order to secure stabilization. It is common to ascribe the damping mechanisms to feed-forward and recurrent inhibitory connections (Ahlsen et al. 1985). Disactivation of the inhibitory interactions or amplification of the excitatory loops leads to epileptic discharges within the system. Accordingly, we have shown that electrical stimulation of the cat's visual radiation provokes resonance oscillatory activity of about 20 Hz frequency in the retinotopically localized cortico-geniculate loop (Wróbel et al. 1998). With the hypothesis considering visual evoked potentials (EPs) as stimulus-induced LFP rhythmicities Basar (1980) found that amplitude-frequency characteristics of these potentials peaked
Fig. 4. A, Power spectra calculated from the LFP registered in dog visual cortex with eyes closed and
during attentive observation of a hole in the screen in expectation of appearance of the reward (adopted from Lopes da Silva et al. 1970, 1991); B, Amplitude spectra of the LFPs registered from the visual cortex of the pretrigeminal preparation of the cat after habituation, and during a period in which eyes followed the hand of experimenter moving in vertical direction (Wróbel and Bekisz, unpublished); C, averaged difference of frequency spectra of the EEG registered from the occipital electrodes of the subjects when listening to music and observing the complicated posters (32 subjects of the 1113 years age; adapted from Giannitrapani 1970).
for the same 10 and 20 Hz values with additional prominent peak developing above the 35 Hz (Fig. 3). All the above experiments support the notion that spike trains of distinct frequencies (about 10, 20, and above 35 Hz) pass through the mammalian visual system with the smallest decrement. These frequency bands may be therefore called resonance frequencies. FUNCTIONAL MEANING OF THE RESONANCE FREQUENCIES Long clinical experience has ascertained that the spectral power of the specific EEG signal bands changes with different functional states of the brain. Much interest has been recently focused on the alpha (8-13 Hz), beta (15-25 Hz) and gamma (30-60 Hz) bands. First observations indicated that general arousal is accompanied by decreased power in the low frequency, alpha band (Berger 1930) which was described as EEG desynchronization. With better quality recordings it turned out that more characteristic for cortical arousal was decrease of amplitude of slow 1-4 Hz oscillations (delta) and the accompanying alpha power could even increase at the same time (Childers and Perry 1970, Bekisz and Wróbel 1993, 1999, Herculano-Houzel et al. 1999). Interesting from this point of view are observations of increased beta activity in subjects habitually using vivid visual imagery as compared to negligible beta activity recorded in subjects with relatively inadequate visual imagery ability (MundyCastle 1951, v. Stein et al. 1993). Beta activity in both groups was highly correlated with the observed power in the alpha band (Mundy-castle 1951).
It is generally assumed now that alpha activity mirrors idle arousal of the visual network (Childers and Perry 1970, Lopes da Silva 1990, Steriade et al. 1990, Steriade 1993, Vanni et al. 1997, Castro-Alamancos and Connors 1997) and gamma oscillations serve as a mechanism for feature binding (Roskies 1999). Functional role of beta band reminds, however, still obscure (Steriade 1993). Prominent beta band activity was registered from the occipital cortex of dog which expected a rewarding piece of meat to appear visually (Lopes da Silva 1970b, Fig. 4A) and from occipital electrodes of subjects performing emotional and cognitive tasks (Ray and Cole 1985). Recording cortical LFPs from the vigilant cat pretrigeminal preparation we have observed the appearance of beta activity during the following reflex, when the eyes tracked the hand of the experimenter. This activity ceased after a long habituation period without any visual stimuli presented (Wróbel and Bekisz, unpublished data, Fig. 4B). Preliminary data show enhanced beta activity in monkey visual cortex during behavior based on attentional tasks (Graille and Rougell-Buser 1996). On the other hand decrease of beta spectral power was detected in EEG signals recorded from occipital electrodes of subjects perceiving patterned visual stimuli (Giannitrapani 1971, Fig. 4B, V. Stein et al. 1993). Such confusing results can be explained by the assumption that visual processing organizes cortical activity into specific spatial pattern replacing the global synchronization present during idle state. This hypothesis will be discussed below together with supporting data from our cat experiments. The increased beta activity in the cortical EEG of human subjects has, however, recently been observed during a delay time preceding visual differentiation response. This activity was associated with mechanism of short-term memory (TallonBaudry and Bertrand 1999). Our intensive investigations which are reviewed below suggest that all the described results can be consistently understood by assuming that beta band activity reflects an arousal of the visual system during increased visual attention (Wróbel 1997a).
THE ROLE OF CORTICAL ACTIVATION IN GAIN OF THE RETINO-CORTICAL FLOW OF INFORMATION Neuronal circuits located in higher levels of the mammalian visual system project feedback pathways terminating on principal cells of the preceding level (Felleman and Van Essen 1991, Zeki 1993). The idea that the descending systems might be used for control of the attention processes is not new (Adrian 1953, Hernandez-Peon 1966, Singer 1977, Sherman and Koch 1986) but it was only recently that the neural mechanisms underlying such control has been demonstrated (Lindström and Wróbel 1990, McCormick and van Krosigk 1992). It is not surprising that due to the complicated organization of the association cortex with many intermingled connections (Kaas 1993, Felleman and Van Essen 1991, Zeki 1993), these mechanisms were at first investigated in the cortico-thalamic pathway of the visual system (Lindström and Wróbel 1990). The ascending fibers of the principal cells of the lateral geniculate nucleus (LGN) of the cat send collaterals to pyramidal cells of layer 6 of the visual cortex (V1). The cortical neurons project in turn toward the LGN where contacts of their axons on principal cells outnumber all other excitatory synapses (Wilson et al. 1984, Montero 1991). Using intracellular recording techniques we were able to show that cortico-geniculate synapses have a built-in frequency amplification mechanism which reaches maximal values at about the 20 Hz frequency (Lindström and Wróbel 1990). Based on this observation we postulated that beta frequency activity transmitted via the corticogeniculate pathway can depolarize geniculate cells and therefore increase the input-output gain of the geniculate relay (Lindström and Wróbel 1990, Musiał et al. 1997). The role of this rich and potentially powerful descending pathway was obscured for a long time (Geisert et al. 1991, Kalil and Chase 1970) since all experiments were carried out on anesthetized animals and the cells in layer 6 become active only after waking up, as shown by Livingston and Hubel (1981). These authors also demonstrated that bursting activity of
pyramidal cells which accompanied the waking periods improved the responsiveness of geniculate cells (comp. also Coenen and Vendrik 1972). It is clear that the possible functions of the cortico-thalamic
Fig. 5. A, B, increase in amplitude and frequency of appearance of beta bursts recorded from cat's visual cortex during expectation of the visual cue (A) and lack of such changes in auditory differentiation task (B). Consecutive 8 rows represent continuously recorded signal from the same electrode in visual cortex (V1') before and after appearance of the preparatory stimuli of corresponding modality; C, D, correlation between beta bursts (marked by vertical markers in A and B) registered by two electrodes in V1 (V1" signal not shown) during visual (C) and auditory (D) trials. The recorded signal in A and B was filtered in the 16-24 Hz frequency band (adapted from Wróbel 1997b).
projections should be studied in awake animals in which the pyramidal cells in visual cortex are easy to activate and thus operate within their intended physiological limits (Wróbel et al. 1994a, Gray and Di Prisco 1997, Wróbel 1997b). Therefore we planned further experiments on behaving cats which performed conditional tasks requiring shifts in visual attention. We hypothesized that when visual information forms a vital component of a task, the attentive state necessary to gain this information should be accompanied by activation of the cortico-geniculate pathway. BETA ACTIVITY IN THE CORTICOGENICULATE SYSTEM INCREASES DURING VISUAL ATTENTION In an attempt to elucidate whether the spectral power of beta activity increases during
visual attention we performed an experiment in which cats were rewarded for proper responses in a spatial differentiation test which required visual or auditory attention in intermingled trials (Bekisz and Wróbel 1993, Wróbel et al. 1994 a,b). In brief, cats were trained in a specially designed small wooden cage equipped in front with two translucent doors. The visual and auditory trials were preceded by a preparatory stimuli of appropriate modality: a diffuse flash of light or noise from a loudspeaker from behind the front wall. During the visual trial the cat had to notice the cue stimulus (1 s duration flash of a small light spot) which appeared with 10 to 20 s delay (randomized) on one of the doors. When pressing this door the cat could grab a piece of meat for a reward. Analogously, a short (1 s) noise from one of the loudspeakers placed behind the sidewalls was a cue for solving the auditory differentiation task. This procedure kept the animal in a state of attention to a given modality, starting from a warning up to the cue stimulus, and shifting it to other modality in the subsequent trial. It is important that during the analyzed period of any trial the animal was kept in the same (visual or auditory) sensory environment. Local field potentials were registered with the use of a set of electrodes chronically implanted into the visual cortex (area 17, V1), auditory cortex (A1) and also the visual thalamic nuclei: lateral geniculate nucleus (LGN) and lateral posterior –
averaged LFP amplitude spectra from the time periods preceding correct and erroneously ended behavioral responses in the same session; C, D, amplitude spectra showing spectral content of the signal registered from the primary visual (C) and auditory (D) cortices of other cat, calculated from correct trials in one experimental session. Stars indicate the significance in the beta band (t-test, P