Building Information Modeling (BIM) can have promising impact in that domain. In this ... (2004) developed a web-based system for .... Computing is an easy part of the cost ..... As for the suggestion for improvement, they recommended to.
Emad Elbeltagi Int. Journal of Engineering Research and Applications ISSN : 2248-9622, Vol. 4, Issue 7( Version 4), July 2014, pp.56-66
RESEARCH ARTICLE
BIM-Based Cost Construction
www.ijera.com
OPEN ACCESS
Estimation/
Monitoring
For
Building
Emad Elbeltagi1, Ossama Hosny2, Mahmoud Dawood1 and Ahmed Elhakeem3 1
Civil Engineering Department, Mansoura University Construction and Architectural Engineering Department, The American University in Cairo 3 Civil Engineering Department, Faculty of Engineering-Mataria, Helwan University 2
Abstract Proper Cost Estimate, Monitor and Control (CEM&C) are vital for the success of construction projects. Starting from preliminary design to project closing, CEM&C progressively becomes more complex and challenging. Visualization can add another dimension to monitor and control where major deviations can be visually detected and analyzed. However, literature related to visualization in construction and integrating it with cost control is still in its early stages. Building Information Modeling (BIM) can have promising impact in that domain. In this paper, a comprehensive cost estimating and monitoring model is presented. The model is integrated with BIM to provide the user with the capability of visualizing actual cost expended in different building elements and compare it with that budgeted at different time intervals. It provides construction practitioners with vital data that help them in taking appropriate corrective actions in case of any deviation from the budget. An example application is presented to demonstrate the capability and applicability of the model. Keywords: Cost monitoring and Control, Cost Variances, Cost Estimate, BIM, Visualization.
I. INTRODUCTION Accurate cost estimate and effective cost monitoring and control are essential elements to construction project success. Project managers need reliable cost estimating systems to initiate budgets and develop financial management plans. Cost estimate can be defined as the process of predicting cost to perform the scope of work specified for a project. The cost estimate level of accuracy depends on the method used, availability of cost data and level of project definition (Jrade 2000). The Association for the Advancement of Cost Engineering (AACE) defines cost estimate as; "A predictive process used to quantify cost and/or price of resources required by the scope of an asset investment option, activity, or project" (AACE International 2011). While Rad (2002) defines it as: "the art and science of using historical data, personal expertise, institutional memory, and the project scope statement to predict the resource expenditure, and total cost of a project". However, estimating without proper monitoring and control may result in complete project failure. During project construction, procedures for project monitoring, recording and control are essential elements for project managers. Monitoring is the process of tracking various operations during the construction stage. Cost control indicates the direction of the changes in preliminary planning variables compared with actual performance with the aim of avoiding unacceptable variations. Cost control includes “monitoring” costs and recording data, then analyzing the data in order to take appropriate www.ijera.com
corrective actions before it is too late. Once the project starts; control becomes the major task of the contractor, because contractor’s profit depends to a great extent on the effectiveness of its cost monitoring and control system (Olwan 2004). Project control system indicates the direction of change in preliminary planning variables compared with actual performance (Rozenes et al. 2006). It assures that all changes to the scope baseline are controlled in a structured manner. This prevents the baseline plan from becoming obsolete. Several research have focused on cost and schedule variances (eg., Li 2004). Cheung et al. (2004) developed a web-based system for monitoring the performance of construction Projects. The system measures several performance measures that include: cost, time, quality, health,safety and others to evaluate the performance of project progress. Other researchers focused on describing how to collect the required data to control projects (e.g., Abudayyeh et al. 2001; Navon, and Goldschmidt 2003; Sacks et al 2003; Perera and Imyiyas 2004; Eldin and Lloyd 2005). Hegazy and Abdel-Monem (2012) introduced an email based system for documenting as built information for progress monitoring and analysis. The system facilitates efficient communication and feedback between construction personal and head office. Building Information Modeling (BIM) is a new technology in the field of CAD, which contains not only geometric data, but can accommodate great amount of engineering data over the lifecycle of a 56 | P a g e
Emad Elbeltagi Int. Journal of Engineering Research and Applications ISSN : 2248-9622, Vol. 4, Issue 7( Version 4), July 2014, pp.56-66 building (Xudong and Jie 2007). It simulates the construction of the building in a virtual environment. BIM assists planners in making crucial decisions by enabling visualization of the details of the prospective work at any specified time (Chau et al. 2004). When a project is planned and built virtually, most of its relevant aspects can be considered and communicated before the instructions for construction are finalized (Li et al. 2006). According to Khemlani (2010), BIM is a revolutionary technology that goes well beyond the design phase to impact construction and lifecycle management of the project. BIM can be used in the preconstruction phase in cost and quantity estimates, and in integration and coordination among building components and their scheduling data. It can also be used as a life cycle information management process for safety planning (Sulankivi et al. 2010). Elbeltagi and Dawood (2011) developed a time control model for repetitive construction projects based on BIM technology. Sacks et al (2011) developed a matrix that links the functionalities in BIM with the prescriptive principles of lean construction. They identified fifty six constructive interactions between them. Fard et al. (2009) developed a 4D simulation model based on time-Lapsed photographs to visualize construction progress. The authors used color coding images for progress tracking where different colors were given to project components based on their progress status. They claim that color coding provides end users with more realistic picture of project progress leaving more time for decision makers to take corrective actions. 1.1 Problem Statement Timely and accurate feedback of actual cost enables project managers to take appropriate corrective actions that would minimize cost overrun in a timely manner. As project progress, the process of construction monitoring and control gets more sophisticated, complex and challenging due to the huge amount of information that need to be measured and analyzed. An effective monitoring and control system should include a data management system to cover the large sets of data associated with the different project components. Accordingly, developing an integrated visualized cost estimate and control models to track construction projects performance would be an important advance in the area of construction project monitoring and control. This research aims to introduce a model that integrates cost estimate and monitoring processes with the advances in data visualization to provide decision makers with a tool for better monitoring and control of their construction projects.
II. INTEGRATED COST ESTIMATE AND Monitoring Framework www.ijera.com
www.ijera.com
Figure 1 shows the framework of the proposed model. The framework consists of three interacting modules; cost estimate and schedule module, cost monitoring and control module, and BIM module. The three modules interact together as illustrated in the figure through the intersected areas of these modules. The project Work breakdown Structure (WBS) is used to link the estimate/scheduling (i.e., planning) with the BIM where the project was broken down into a set of activities that are mapped to their corresponding building components During construction the actual cost (ACWP) for each resource/activity is compared with its corresponding original budget (BCWS) and the Earned Value (EV). Then, cost variances in the different components are visualized through the BIM module.
Figure 1: Proposed BIM based Cost Estimate / Monitoring Framework Advanced spreadsheet modeling with Visual Basic for Applications macro programming is utilized to create the cost estimate model, store actual progress data and perform cost variance analyses in addition to, automate the data exchange with BIM to visualize construction cost progress. In the current research, BIM is used as a platform of visualization, quantity takeoffs, counts, and measurements to perform cost estimate and control then visualize cost variances. A cost estimation module is developed to calculate the activities’ direct cost (indirect cost is out of scope of this research). A mathematical cost monitoring/control module is also developed to measure work progress, track resource changes (quantities, productivities, crews, and costs), and to perform detailed cost variance analyses (details are in section 2.2) to enable decision makers take timely corrective actions. The proposed framework can be used to help all construction parties to reduce/recover any deviation, if any, from the original plan. Figure 2 however shows the framework main processes. Developing a reasonable Work Breakdown Structure (WBS) is the first step for implementation. The WBS is the base for developing a custom Building Information Model (BIM) 57 | P a g e
Emad Elbeltagi Int. Journal of Engineering Research and Applications ISSN : 2248-9622, Vol. 4, Issue 7( Version 4), July 2014, pp.56-66
www.ijera.com
representing the building. On the other hand, the WBS is used in preparing the initial project plan/schedule on any Project Management software (e.g., MS Project).
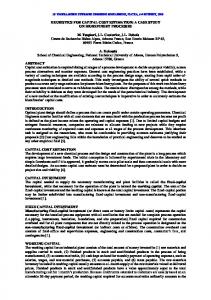
Figure 3: Actual Daily Crew Time and Cost Card
Figure 2: Framework Main Process Quantities, based on the BIM model, are extracted and exported to a database (e.g., MS Access) as an intermediate database which is linked to the cost estimate module/model in the proposed framework. The cost estimate/control model is developed using Excel. The model imports the initial plan/schedule from MS Project to realize project activities and imports also the matching quantities from BIM through MS Access then integrates the resources basic cost data to estimate activities’ time and cost. The calculated time and cost are exported back to MS Project to develop the schedule and determine the BCWS at the project level. Actual resources data are collected from the construction site during the construction phase using structured acquisition forms (e.g., Figure 3 for crew daily time and cost). The forms are plugged into the estimate/control spreadsheet model. By comparing initial cost estimate against actual progress, detailed cost variances are automatically calculated. Variance analysis is exported back to the BIM model to allow the user visual the construction progress by viewing favorable/unfavorable cost variances in coloring schemes. The next sections will discuss in details the proposed model.
www.ijera.com
2.1 Cost Estimate and Schedule Module Cost estimate can be viewed as the task of determining the quantities of work to be performed, with the production rate and cost of the resources required to perform that work (Al-Mashta 2010). Cost estimating process internal steps do not have a commonly adapted structure. Consequently, experts and researchers do not adhere to exact specific steps during the cost estimating process. The preparation of cost estimate depends mainly on developing a Work Breakdown Structure (WBS) that breaks down the project into subsets of items or packages. Traditionally, cost estimation for building projects starts with quantification (Sabol 2008). Quantification is a time consuming task, it consumes from 50% to 80% of the cost estimator’s time on a project (Autodesk 2007). In order to develop quantity takeoffs, estimators typically begin by digitizing the drawings or doing manual takeoffs. All these methods introduce the potential for human error and propagate any inaccuracies there may be in the original drawings. By using a Building Information Model instead of drawings, the takeoffs, counts, and measurements can be generated directly from the underlying model. Therefore the information is always consistent with the design. And, when a change is made in the design, it will automatically ripple to all related construction documentation and schedules, as well as all the takeoffs, counts, and measurements that are used by the estimator. Preparing of BIM model, based on the WBS that is previously developed, can reduce the time needed to achieve a high quality building by improving design and construction integration and quantity takeoff accuracy. Therefore, it is most beneficial to convert the design into BIM software to allow extracting more detailed spatial and material quantities directly from the building model in a timely manner. All BIM tools provide capabilities for extracting counts of components, area and volume of spaces, material quantities, and to report these in various schedules. Several software packages are available in the market (e.g. Revit, Tekla Structure, Archicad, etc.). Revit is used as the BIM engine for the current application. Quantity surveying, in the proposed model, is done by exporting the BIM model to an Access database file that is then sent to Excel spreadsheets (core of the cost estimate engine) as
58 | P a g e
Emad Elbeltagi Int. Journal of Engineering Research and Applications ISSN : 2248-9622, Vol. 4, Issue 7( Version 4), July 2014, pp.56-66 shown in Figure 4. These quantities are used to calculate the total project cost estimate.
www.ijera.com
system to measure the environmental performance done by the contractor. Barraza et al. (2000) developed a model based on stochastic S-curve to monitor project performance.
Figure 5: Cost Estimate Module Components Figure 4: BIM Manipulation and Data Exchange via MS Access The next step is the cost data collection regarding the direct cost based on historical data or resource enumeration. Historical data can be collected from previously executed projects or obtained from third parties: manufacturers, subcontractors or database references (e.g. RS Means in North America). Cost data regarding project resources are organized in Excel sheets. Finally, data manipulation or calculation to produce the cost estimate is performed. Computing is an easy part of the cost estimate process (although it is prone to mistakes when done manually). In general it depends on simple mathematics. By using the powerful data management features of Excel, simplified spreadsheets are used to estimate project cost. The design of spreadsheets involved the setup of several data lists and establishing the relationships among them (Figure 5). 2.2 Cost Monitoring Module The earned value management technique is considered as a powerful project management tool that supports the management of project scope, time, and cost (Leu et al. 2005). Using the earned value process, contractors can easily compare how much work has actually been completed with the amount of work planned to be accomplished. Earned value provides work progress status, and the relationship of planning to the actual cost. Jung and Kang (2007) developed a system to standardize progress measurement. Shen et al. (2005) developed a scoring www.ijera.com
There are three key indicators that are used in performance measurement: (1) budgeted cost of work scheduled (BCWS), (2) budgeted cost of work performed (BCWP), (3) and actual cost of work performed (ACWP). The performance measurement computes variances from baseline. Figure 6 represents cost variance analysis breakdown tree (Adapted from Dawood 2011). Cost variance for the activity/project is quantified from its three main resources: material, crew (labor and equipment), and subcontractor.
Figure 6: Cost Variance Analysis Tree Figure 7 shows the ACWP and BCWP using a mirror fashion (in front of each other). For each activity the ACWPs and BCWPs for the main resources are shown in addition to the corresponding CVs (total of eight curves). This representation provides a better illustration for various CVs related to an activity and its resources. 59 | P a g e
Emad Elbeltagi Int. Journal of Engineering Research and Applications ISSN : 2248-9622, Vol. 4, Issue 7( Version 4), July 2014, pp.56-66
www.ijera.com
Where: CVM is the material cost variance for ij material type j in activity i, BCWPM is the budgeted ij
material cost of work performed; ACWPM is the ij actual material cost of work performed. As shown in Figure 8, material variance may occur due to changes in quantity and/or changes in unit price. The following subsections describe the reasons for variances in the material cost.
Figure 7: Cost Variance Major Components Following are the mathematical formulation for different elements cost variances (Dawood 2011). Activity-based Cost Variance (CV) The CV is computed for each activity to show the deviation of its actual cost from the baseline estimate. It is the difference between the budgeted cost of work performed (BCWP) and the actual cost of work performed (ACWP).
CVi BCWPi ACWPi
CVi is the cost variance for activity i, BCWPi is the budgeted cost of work performed for
Where:
activity i,
ACWPi is the actual cost of work
performed for activity i. The CV is caused due to deviation in the actual cost of key resources (material, crews, subcontractors and/or overhead) from those estimated. Therefore, further analysis has to be performed to define the reasons for the CV. Consequently, the CV of any activity can be expressed as:
CV CVM CVcrew CVSub CVOver Where: CVM, is the variance in the material cost, CVcrew, is the variance in the crews cost, CVSub, is the variance in the subcontractor work and CVOver is the cost variance in the overhead. Overhead cost is beyond the scope of this research. Material Cost Variance Materials are the major component of construction cost. It contributes to more than half of the project cost. Material cost variance is the difference between budgeted material costs and actual material costs. Material cost variance can be calculated as follows:
CVM BCWPM ACWPM ij
www.ijera.com
ij
ij
Figure 8: Components of Materials Cost Variance Material Quantity Variance Material quantity variance (CVM.Q) is the cost variance that arises due to a change in actual quantities of consumed materials to perform the work in any activity (i) from the budgeted quantities. Material quantity variance can be computed as follows:
CVM .Q Cb.M Pa Cb.M ij
Where: CVM .Q ij
ij
ij
ij
Qa.M
ij
Qb.M
ij
is the material quantity cost
variance for material type j in activity i, Cb.M is the ij budgeted material cost,
Qb.M ij is the budgeted
quantity of materials, Qa.M is the actual quantity of ij performed materials to date and Pai is the actual completed percent to date. Material Price Variance Material price variance (CVM price) is the difference between the budgeted cost and actual cost for the quantity of material used. Material price is the cost per unit quantity (e.g. $/m3). Material price variance could be computed as follows:
Cb.Mij Ca.Mij CVM .Pij Qb.Mij Pai Qb.Mij Qa.Mij
60 | P a g e
Emad Elbeltagi Int. Journal of Engineering Research and Applications ISSN : 2248-9622, Vol. 4, Issue 7( Version 4), July 2014, pp.56-66
www.ijera.com
Where: CVM . P is the material price cost variance ij
Where: CVC.Q is the crew quantity cost variance for ij
for material type j in activity i, Ca.M is the actual ij
crew j in activity i and Cb.C is the crew’s budgeted
material costs to data.
cost.
ij
Material Quantity-Price Joint Variance Material quantity-price joint variance is the cost variance due to the deviation of the budgeted cost and the budgeted quantity of material used simultaneously. It can be computed as follows:
Ca.M ij Cb.Mij CVM .QPij Qb.M ij Pai Qa.M ij Q Qb.Mij a . M ij
Where: CVM .QP is the material quantity-price joint ij
variance for material type j in activity i Material cost variance can be calculated by the summation of material quantity, material price and material quantity-price joint variances. If the variance value is positive it will be favorable. If negative, it will be unfavorable. Crew Cost Variance Crew cost variance is the difference between the budgeted crew cost and actual cost over a period of time. It could be computed by the following equation:
Figure 9: Components of Crews/Subcontractors Cost Variances Crew Rate Variance Crew rate variance is due to the difference between crew’s actual cost and crew’s budgeted cost per unit of measure. Crew rate is the crew’s cost per unit of quantity performed (e.g., $/m3). Crew rate variance can be computed as follows:
Where: CVC is the crew cost variance for crew j in ij
Cb.C Ca.C CVC . R Qb Pa Qa Qb
activity i, BCWPC is the budgeted cost for a crew ij
Where: CVC.R is the crew rate variance for crew j in ij
of work performed, ACWPC is the actual crew ij
activity i, Ca.C is the actual crew cost to date. ij
cost of work performed.
Crew Quantity-Rate Joint Variance Crew quantity-rate joint variance is due to a variance in rate and a variance in quantity, simultaneously. Crew joint variance can be computed as follows:
CVC BCWPC ACWPC ij
ij
ij
ij
ij
Crew cost variance can be attributed to several factors as shown in Figure 9. It is mainly due to the following reasons: (1) changing of quantity of work performed (e.g., m3); (2) deviation of crew rate per unit quantity (e.g., $/m3); and (3) changing in both quantity and crew rate (e.g., $/m3). On the other hand, crew rate variance is mainly due to three reasons: (1) variance in production rate (e.g., hour/m3); (2) variance in cost per hour ($/hour); and (3) variance in both production rate and cost per hour. The following subsections describe crew’s variances that may rise due to previous reasons. Crew Quantity Variance Crew quantity variance is due to the deviation of the actual quantity performed from the budgeted. It can be computed as follows:
CVC .Q ij
Cb.C
Q b Pa Qa Qb ij
ij
i
ij
ij
ij
i
ij
ij
Ca.Cij Cb.Cij CVC .QRij Q bij Pai Qaij Q Q bij aij Where: CVC .QR is the crew quantity-rate joint ij variance for crew j in activity i. Crew rate variance can be divided into three types: (1) crew production rate variance; (2) crew cost per hour variance; and (3) crew production rate cost per hour joint variance. Crew Production rate Variance Crew production rate variance occurs when the actual production rate differs from budgeted value. Crew production rate is reported in hours per unit quantity (e.g., hour/m3). Crew production rate variance can be computed as follows:
ij
www.ijera.com
61 | P a g e
Emad Elbeltagi Int. Journal of Engineering Research and Applications ISSN : 2248-9622, Vol. 4, Issue 7( Version 4), July 2014, pp.56-66
CVC .Pij
Chrsbij Chrsaij Qbij Pai Chrsbij Qbij Qaij Cb.Cij
Where: CVC.P is the crew production rate cost ij variance for crew j in activity i, Chrsa is the actual ij number of working hours required to perform the activity, and Chrsb is the budgeted number of ij
working hours required to perform the same activity. Crew Cost per hour Variance Crew cost per hour variance is due to deviations that occur when the actual cost per hour differs from the budgeted cost per hour. Crews cost per hour is reported in $/hour. Crew cost per hour variance can be computed as follows:
CVC . H Cb.C Pa Ca .C . ij
ij
i
ij
Chrsb
www.ijera.com
As shown in Figure 9, subcontractor cost variance is the total variance that can be attributed to many factors such as: (1) changes in quantity of work performed (m3); (2) deviation of subcontractor rate per unit quantity (e.g., $/m3); and/or (3) changes in both quantity and subcontractor rate. The following subsections describe the most important elements resulting in subcontractor variance. Subcontractor Quantity Variance Subcontractor quantity variance is due to the deviation of actual quantity from budgeted quantity of work performed by the sub-contractor. Subcontractor quantity variance can be computed as follows:
CVS .Q Cb.S Pa Cb.S i
i
i
i
Qa
i
Qbi
Where: CVS .Qi is the subcontractor cost variance,
ij
Chrsa
and Cb . Si is the budgeted sub-contractor cost.
ij
Where: CVC.H is the crew cost per hour variance ij for crew j in activity i. Crew Production rate Cost per hour Joint Variance Crew production rate cost per hour joint variance is due to a variance in the production rate of crews and a variance in the crews cost per hour at the same time. Crew production rate cost per hour joint variance can be computed as follows:
Subcontractor Rate Variance Subcontractor rate variance is due to the difference between the subcontractor actual cost and the subcontractor budgeted cost per unit of measure. Subcontractor rate is the subcontractor cost per unit of quantity performed (e.g., $/m3). Subcontractor rate variance can be computed as follows:
CVS .Ri Cb.Si Pai Ca.Si
Qbi
Qai Chrsbij Chrsaij Ca.Cij Cb.Cij CVC.P Hij Qbij Pai Qaij Chrsaij Chrsbij Where: CVS . R is the subcontractor rate variance, Qbij i Where: CVC .P H is the crew production rate cost ij per hour joint variance for crew j in activity i. Crew cost variance equals crew quantity variance plus crew rate variance plus crew quantity-rate joint variance. On the other hand, crew rate variance equals crew production rate variance plus crew cost per hour variance plus crew production rate cost per hour joint variance. If the variance is positive it will be favorable, the bad thing is to have a negative variance. Subcontractor Cost Variance Subcontractor cost variance is the difference between the budgeted and actual sub-contractor costs for a period of time. It could be computed as follows:
CVSi BCWPSi ACWPSi Where: CVSi is the subcontractor cost variance,
BCWPSi is the budgeted subcontractor cost of work
performed;
ACWPSi is
subcontractor cost of work performed.
www.ijera.com
the
actual
Ca . Si is the actual Subcontractor cost to date. Subcontractor Quantity Rate Joint Variance Subcontractor quantity rate joint variance is due to a variance in rate and a variance in quantity at the same time. Subcontractor joint variance can be computed as follows:
Ca.Si Cb.Si CVS .Q Ri Q bi Pai Qai Qbi Qai Where: CVS .Q Ri is the subcontractor quantity rate joint cost variance. Subcontractor rate variance can be divided into three types; (1) sub-contractor production rate variance, (2) subcontractor cost per hour variance and (3) subcontractor production rate cost per hour joint variance. These are illustrated next. Subcontractor Production Rate Variance Subcontractor production rate variance is due to deviations between actual and budgeted subcontractor production rate. Production rate is reported in hours per each unit quantity (e.g., 62 | P a g e
Emad Elbeltagi Int. Journal of Engineering Research and Applications ISSN : 2248-9622, Vol. 4, Issue 7( Version 4), July 2014, pp.56-66 hour/m3). Subcontractor production rate variance can be computed as follows:
CVS . P Cb.S Pa Cb.S Pa i
i
i
i
i
Shrsa
i
Shrsb
i
www.ijera.com
problems to take corrective actions in a timely manner.
Qb
i
Qa
i
Where: CVS . Pi is the subcontractor production rate cost variance, Shrsai
is the actual number of
subcontractor working hours to date, and Shrsb i is the budgeted number of sub-contractor working hours. Subcontractor Cost per Hour Variance Subcontractor cost per hour variance is due to deviations that occur when the actual cost per hour differs from the budgeted one. Subcontractor cost per hour is reported in $/hour. Subcontractor cost per hour variance can be computed as follows:
CVS .Hi Cb.Si Pai Ca.Si Pai
Shrsbi
Figure
10:
Planned Versus actual Visualization Flow Chart
Variance
III. MODEL IMPLEMENTATION
Shrsai
This section describes a computerized system that is developed to automate the estimating/monitoring process. The implementation Where: CVS . H i is the subcontractor cost per hour process depends on using commercial software packages such as Microsoft Project and Microsoft variance. Excel. Microsoft Excel provides the capabilities needed to reduce and analyze of the input data and Subcontractor Production rate Cost per Hour Joint output results, so all of the data and results are loaded Variance into Excel spreadsheets. The software is used to Subcontractor production rate cost per hour joint enable easy and accurate transfer of data from one variance is due to a variance in subcontractor media to the other. The proposed system will be able production rate and a variance in subcontractor cost to perform the estimate/monitor at different levels to per hour at the same time. Subcontractor production satisfy the requirements of the different managerial rate cost per hour joint variance can be computed by levels. The Visual Basic for Application (VBA) in the following equation: the Microsoft Excel media is used to develop the Shrsbij Shrsaij Ca.Sij integration and linking between Microsoft Cbdesired .Sij CVS .P Hij Qbij Paij Project and Microsoft Excel to achieve the desired Qaij Shrsaij Shrs Qbij b ij results. Initially a scheduling module for the project is developed using Ms Project software. The project is Where: CVS .P H is the subcontractor cost per ij an eight-storey building (Ground floor, 6 typical hour joint variance. floors and a roof) of a foot print area of 1000 m2 and Cost variance is broken into more detailed a built up area of 8200 m2. Visual Basic for variances for all resources. Cost variance equals the Applications (VBA) macro programming language of total variance in material cost plus crews cost plus Excel is used to retrieve the project schedule to the subcontract cost. These detailed variances mainly Excel spreadsheets. It acquires the initial plan for the occur due to deviations in quantities, rates, resources, project from Ms Project. By developing an initial and production rate of used resources. schedule and integrate it with the cost estimating With the highly compatible spreadsheet module, the total cost of the project is calculated as format/modeling of the cost estimate model and the well as the detailed cost for all activities and acquisition forms for resources progress data, resources. Actual cost data in addition to resources variances calculations according the aforementioned data, which represent actual progress information, equations are facilitated using simple spreadsheet can be plugged into the cost control module in Excel formulas. This is illustrated in Figure 10. During the environment by using friendly forms. Detailed progress monitoring, these variances will be project cost variances are computed in the calculated frequently then sent to the BIM model for background based on the previously discussed visualization. Visualization will facilitate pinpointing equations. Actual cost data and detailed variances are
www.ijera.com
63 | P a g e
Emad Elbeltagi Int. Journal of Engineering Research and Applications ISSN : 2248-9622, Vol. 4, Issue 7( Version 4), July 2014, pp.56-66 then automatically transferred to the Microsoft Project. The proposed model is capable of dealing with any type of projects. The automated cost monitoring module is a prototype system that is developed to enable project parties to identify critical control points and improve their effectiveness in monitoring their projects. Automated early progress cost performance assessments are most susceptible to performance data noise (change). Quantities measurements, crew’s productivities and number of crew’s noise are increasingly diluted as the project progresses. A new menu is created in Excel to make it easy to enter actual resources data and to calculate required variances. Entering data into a large spreadsheet list may become extremely tedious and prone to error. The proposed forms in the created menu provide a simple way for entering, editing or deleting existing records in a list. Figure 11 shows screen shots for the cost control and variance analysis module. These screens allow the users to define parameters, edit inputs, and define actual values. As shown in Figure 11, the user has the ability to input actual duration, actual performed quantities, actual production rates and actual costs regarding all project elements. Accordingly cost variances are calculated and presented.
www.ijera.com
must be prepared in a BIM environment (e.g. Rivet). Building the model in Revit does not only represent a 3D model but also extends it to nD modeling because each object (e.g. walls, roofs, and etc.) has a database containing all information pertaining to that object. Project objects data can be exported from the BIM environment to the central Access database. By preparing the project cost estimate and implementing cost control models in Excel spreadsheets, all information is exported to the central database. Accordingly, project elements information in Access is updated by the cost estimate and control data. Also, the project data stored in the database system could be exported to BIM and linked to their corresponding objects automatically. Accordingly, a query can be done to visualize the project components based on the imported data from Access. Project objects in Revit, which corresponds to project activities, now are stored in Revit with their cost estimate and cost variances data. The filter command in Revit enable the user to visualize the project objects that have unfavorable cost variance and those that have favorable cost variance in color coding. Figure 12 shows the work progress at month 6. It can be noticed from the figure that the first and second floor slabs were over budget while other elements were either on budget or below budget.
Figure12: BIM-Based Visualized Cost Control
V. MODEL BENEFITS AND LIMITATIONS Figure 11: Screen Shots for Automated Cost Control Tool
IV. BIM BASED VISUALIZATION PLATFORM The ability to visualize construction projects from the design phase, integrating it with project cost estimate and control is a destination that is achieved using the advances in the Building Information Modeling (BIM). In developing a visualized nD model, first of all, a three dimensional (3D) model www.ijera.com
A visualized cost estimate/cost control model provides reliable features to architects, owners, engineers, contractors, and all participants involved in the construction industry. It creates a single building model that act as a repository for all elements of the building. The model provides many features that help project construction team to avoid costly errors during construction of the project. Element clashes can be detected from the design phase saving considerable time delays and cost overrun, in case of any discrepancy. At the same time, visualization helps construction team to absorb and understand project information. 64 | P a g e
Emad Elbeltagi Int. Journal of Engineering Research and Applications ISSN : 2248-9622, Vol. 4, Issue 7( Version 4), July 2014, pp.56-66 Computerized automated model could support decision making by enabling project parties to test and evaluate any alternative rapidly for the purpose of reaching an optimum solution. Ambiguities in the construction process can be highlighted by any team member and resolved before construction starts. Constructability issues can also be discussed and evaluated. Time that is normally spent in traditional tracking methods by construction team will be reduced considerably. In the other hand, the completeness of documents provided by the proposed model can be used not only for design and construction purposes, but also for delay analysis in post construction. Quantity takeoff is another area which can be immensely benefited from BIM. Autodesk Revit creates a building information model such that it identifies the model as building elements, such as walls, foundation, and floor not just few lines drawn but as assemblies made of real materials which can be viewed if a section is cut. Quantity takeoff using a BIM can be done by exporting the building object quantities to Ms Access database. One of the considerable limitations of the proposed model is the amount of computer memory and processing power required for interactive walk through and controlling repetitive construction projects. The proposed model is applicable for small to medium projects, but it is complex to apply to large projects in view of the memory and processing power required. The model has been introduced to several project management experts to provide the authors with an evaluation regarding the following points: The simplicity of the model and the sufficiency of its outputs; Its potential application in the area of cost monitoring and control Its benefits and advantages over current cost monitoring/control practices and Further suggestions for improvement. Results show that the model/approach is perceived by construction experts to have a good potential and several benefits in simplifying the process of monitoring construction activities. They added that color coding help in pinpointing the areas that need immediate corrective actions. As for the suggestion for improvement, they recommended to have a split view to concurrently see the resources cost variances for an activity along with the overall cost variance. Currently BIM versioning as a core for split view is investigated by the authors to be included in a future research.
VI. SUMMARY AND CONCLUSIONS Cost estimate and control are important tools to track and monitor construction projects. This research introduces a new approach to monitor/control www.ijera.com
www.ijera.com
construction projects. A mathematical methodology for evaluating construction performance with respect to cost has been developed. One of the model objectives is to introduce the major variables that affect controlling of project cost. Components of cost variances were presented in details. Based on the previous analysis, the proposed project monitoring system provides useful information for effective control of construction projects. A methodology for evaluating and visualizing construction performance with respect to cost has been developed. A BIM based visualization system has been introduced to facilitate tracking and monitoring construction progress. The proposed model can be effectively used in controlling small to medium projects. The main advantage of the system is that it enables nD visualization of the construction progress along with the geographical conditions. The system provides project participants with a framework to effortlessly view and evaluate construction progress. This paper emphasizes the importance of integration between project cost estimate, cost monitoring/control techniques and BIM platforms. The integration will add other dimensions to construction progress visualization. The developed framework can be considered as an effective tool for monitoring construction projects and providing decision makers with a visualization aid to enable them to take cost and progress related decisions in a timely manner.
REFERENCES [1]
[2]
[3]
[4]
[5]
[6] [7]
AACE International (2011). “Supporting Skills and Knowledge of a Cost Engineer”. Based Upon AACE® International Recommended Practice 11R-88, Required Skills and Knowledge of Cost Engineering. Aaron, A. Larry (1997). “Part 1: In The Engineer's Cost handbook,” edited by Richard E. Westney. New York: Marcel Decker, Inc. Abudayyeh, O., Temel, B., and AlTabtabai,H. (2001). “An Internet-Based Cost Control System.” Advances in Engineering Software, 32, 87-94. Al-Jibouri, S. (2003). “Monitoring Systems and Their Effectiveness for Project Cost Control in Construction.” International Journal of Project Management, 21, 145154. Al-Mashta, S. (2010). “Integrated Cost Budgeting and Cost Estimation Model for Building Projects.” M.Sc Thesis, Concordia University, Canada. Autodesk (2007).“BIM and Cost Estimating.” Autodesk, Inc. Barraza, G., Back, W., and Mata, F. (2000). ”Probabilistic Monitoring of Project 65 | P a g e
Emad Elbeltagi Int. Journal of Engineering Research and Applications ISSN : 2248-9622, Vol. 4, Issue 7( Version 4), July 2014, pp.56-66
[8]
[9]
[10]
[11]
[12]
[13]
[14]
[15]
[16]
[17]
[18]
Perfromance Using SS-Curves.” Journal of Construction Engineering and Management 126(2), 142-148. Cheung, S., Suen, H. and Cheung, K. (2004). PPMS: a Web-based construction Project Performance Monitoring System, Automation in Construction, 13(3), 361-376 Chau, K., Anson, M., and Zhang, J. (2004). “Four Dimensional Visualization of Construction Scheduling and Site Utilization,” Journal of Construction Engineering and Management, ASCE, 130 (4), 598-606. Elbeltagi, E. and Dawood, M. (2011). “Integrated visualized time control system for repetitive construction projects.” Journal of Automation in Construction, doi:10.1016/j.autcon.2011.03.012 Eldin, N.N., and Lloyd L.C. (2005).“An Innovative Project Controls System.” Proceeding of the tenth International Conference on Civil, Structure and Environmental Engineering Computing, Civil-Comp Press,.Stirling, Scotland. Fu, C., Aouad, G., Lee, A., Ponting, A., and Wu, S. (2006). “IFC Model Viewer to Support nD model Application,” Automation in Construction, 15, 178-185. Golparvar-Fard, M., Peña-Mora, F., Arboleda, C. and Lee, S. (2009). “Visualization of Construction Progress Monitoring with 4D Simulation Model Overlaid on Time-Lapsed Photographs”, Computing in Civil Engineering, 23(6), 391404 Hegazy, T. and Abdel-Monem M. (2012). “Email – Based System for Documenting Construction As-Built Details”, Journal of Automation in Construction, 24(7), 130-137 Jrade, A. (2000). “A Conceptual Cost Estimating Computer System for Building Projects,” M. Sc. thesis, Concordia University, Canada. Jung, Y. and Kang, S. (2007). “KnowledgeBased Standard Progress Measurements for Integrated Cost and Schedule Performance Control.” Journal of Construction Engineering and Management, ASCE, 133(1), 10-21. Khemlani, L. (2010). “Visual Estimating Extending BIM to Construction”, ECbytes, Accessed on August, . Leu S., Lin Y., and Chen T. (2005). ”SPCBased Project Performance Evaluation System.” Proceeding of the tenth
www.ijera.com
[19]
[20]
[21]
[22]
[23]
[24]
[25]
[26]
[27]
[28]
[29]
[30]
www.ijera.com
International Conference on Civil, Structural and Environmental Engineering Computing, Civil-Comp Press, Stirling, Scotland. Li, J. (2004). "Web-based Integrated Project Control System." Ph.D. Thesis, Concordia University, Canada. Li, G., Ding, L., and Wang, J. (2006). “Construction Project Control in Virtual Reality: A Case Study,” Journal of Applied Science, 3(13), 2724-2732. Navon, R., and Goldschmidt, E. (2003).“ Monitoring Labor Inputs: Automated-DataCollection Model and Enabling Technologies.” Automation in Construction, 12, 185-199. Olwan M. (2004). “Integrated Information Data Base and Cost Control System for Construction Projects,” M.Sc. Thesis, Cairo University, Cairo, Egypt. Perera, A., and Imriyas, K. (2004). “An Integrated Construction Project Cost Information System Using MS Access TM and MS Project TM.” Construction Management and Economics, 22, 203-211. Rad, P. (2002).“Project Estimating and Cost Management.” Management Concepts, Inc., Vienna, VA. Rozenes, S, Vitner, G and Spraggett, S (2006) Project control: literature review. Project Management Journal, September 2006, 37(4), 5-14. Sabol, L. (2008). “Challenges in Cost Estimating with Building Information Modeling.”Design and Construction Strategies, LLC, Washington, DC, www.dcstrategies.net. Sacks, R., Koskela, L., Dave, B. and Owen, R. (2010), “The Interaction of Lean and Building Information Modeling in Construction, Journal of Construction Engineering and Management, 136 (9), pp. 968-980 Sacks, R., Navon, R., and Goldschmidt, E. (2003). “ Building Project Model Support for Automated Labor Monitoring”. Journal of Computing in Civil Engineering. ASCE 17(1), 19-27. Shen, L., Lu, W., Yao., H., and Wu, D. (2005). ”A Computer-Based Scoring Method for Measuring the Environmental Performance of Construction Activities”. Automation in Construction, 14(3), 297-309. Xudong, Z. and Jie, T. (2007). “Building Information Modeling based on Intelligent Parametric Technology,” Frontiers of Architecture and Civil Engineering in China, 1(3), 367-370.
66 | P a g e