BIOETHANOL GREENHOUSE GAS CALCULATOR
User’s Guide
Authors: Jeremy Woods, Gareth Brown and Alexander Estrin Biomass Energy Group Centre for Environmental Policy Imperial College London London, SW7 2BP, UK
October 2005
http://www.iccept.imperial.ac.uk/research/bioenergygroup/beg.html
Table of Contents Executive Summary ........................................................................................................ i 1. Introduction ............................................................................................................ 1 1.1 Why is a GHG calculator required? ............................................................... 2 1.2 Why now? ...................................................................................................... 3 1.3 Scientific basis ............................................................................................... 4 1.4 Possible uses for the calculator ...................................................................... 4 2. Scope of work ........................................................................................................ 5 3. Who should use the calculator and why ................................................................ 5 4. Using the Calculator .............................................................................................. 6 4.1 Data Input Page .............................................................................................. 6 4.1.1 Data Input Help ...................................................................................... 7 4.1.2 Farming inputs and Yields ..................................................................... 8 4.1.3 Pre-processing ........................................................................................ 9 4.1.4 Feedstock Transport ............................................................................. 10 4.1.5 Processing ............................................................................................ 10 4.1.6 Transport to End-Use ........................................................................... 12 4.1.7 Calculation ........................................................................................... 12 4.2 Report Page .................................................................................................. 12 4.3 Calculations Page ......................................................................................... 14 5. Underlying factors and calculations..................................................................... 16 5.1 Agricultural Inputs ....................................................................................... 17 5.2 Effects of Straw Removal ............................................................................ 17 5.3 Fossil Fuels and Electricity .......................................................................... 18 5.4 Transport ...................................................................................................... 18 5.5 Credits .......................................................................................................... 19 6. Default Bioethanol Production Chains ................................................................ 21 6.1 Basic wheat-to-ethanol pathway .................................................................. 21 6.2 Farming Inputs and Yields ........................................................................... 22 6.3 Pre-processing (Drying and Storage) ........................................................... 22 6.4 Transport to Processing................................................................................ 22 6.5 Processing .................................................................................................... 22 6.6 Transport to End Use ................................................................................... 23 7. References ............................................................................................................ 24 Definitions and terminology ........................................................................................ 26 Figure 1: Main input sheet for the calculator ................................................................. 7 Figure 2: Data Input Guidance Sheet ............................................................................. 8 Figure 3: Farm-level inputs - data requirements ............................................................ 8 Figure 4: Pre-processing inputs, data requirements ..................................................... 10 Figure 5: Feedstock Transport to Processing- data requirements ................................ 10 Figure 6: Processing / Conversion, data requirements................................................. 11 Figure 7: Ethanol Transport to end-use, data requirements ......................................... 12 Figure 8: Calculator Reporting Screen - calculation outputs ....................................... 13 Figure 9: Calculations Page ......................................................................................... 15 Figure 10: Basic assumptions for default wheat to ethanol pathways (LCVP, 2004) . 21 Table 1: Farming share of energy and GHG emissions for ethanol production ............ 2
Table 2: GHG emission factors for fertilizers, seeds and pesticides ........................... 17 Table 3: Effects of straw removal on fertilizer requirements ...................................... 18 Table 4: GHG emissions factors for fossil fuels and electricity .................................. 18 Table 5: GHG emissions factors for freight transport ................................................. 19 Table 6: Default farming inputs and yields.................................................................. 22 Table 7: Default fuel inputs and surplus electricity outputs ........................................ 23
i
Executive Summary It is not currently possible to calculate a credible single generic GHG (or carbon) factor for the net (LCA) emissions resulting from the use of a biofuels at the national level. Furthermore, the underlying assumption that all forms of biomass use for energy are strictly carbon or GHG neutral is challengeable. This new understanding has profound implications for the development of a credible biofuels sector and for the calculation of incentives or tax breaks that Government could or should award. Yet, the combination of the high oil price, the EU Biofuels Directive (EU, 2003), UK Fuel Duty Rebate and the imminent announcement of a UK Renewable Transport Fuels Obligation, are powerful drivers for the increased production and utilisation of biofuels in the UK. These major policy drivers are justified on a combination of pressing climate change mitigation needs and energy security factors. Without a sound and broadly accepted basis for calculating the energy and GHG balances for biofuels, such policies will remain unconvincing at best. As a consequence, such policies will be vulnerable to change, for example when targets are not being met, increasing uncertainty and risk for business. The GHG Calculator outlined in this report has been designed to address some of these concerns by providing the basis for a credible calculation of the GHG emissions arising from a batch of UK-derived bioethanol using specified agricultural and conversion processes. The calculator is also designed to allow farmers and ethanol suppliers to see how changes made in management practices or inputs could affect the overall GHG emissions of the resulting ethanol production. In order to assist farmers with evaluating how their choice of management, technologies and inputs would affect the overall GHG emissions of the resulting ethanol production, the calculator enables a selected range of the key variables to be altered by the user. For example, producing low-protein wheat for ethanol production should allow reduced nitrogen fertiliser applications. In the calculator, the default value for N-fertiliser applications can be changed and the resulting reduction in GHG emissions calculated. Section 4 explains which factors can be altered and summarises the scientific basis for the calculation of potential GHG emissions using the calculator. For ease-of-use, the calculator divides up the ethanol production and supply chain into the following sub-sectors: •
Farming inputs and yields.
•
Pre-processing.
•
Feedstock transport.
•
Processing / conversion.
•
Transport to end-use, duty or blending points.
The GHG emissions arising from each of these sub-sectors are displayed in numerical and graphical form for each calculation (Figure 8). In addition, a choice of reporting units is provided in order to facilitate cross-comparison with alternative LCA studies.
1
1.
Introduction
A recent lifecycle evaluation by Rickeard et al (LCVP, 2004), has shown that a conservative range in net greenhouse gas (GHG) emissions from wheat-based ethanol production in the UK would be between 7% and 77% lower than the emissions from petrol, depending on how the ethanol is produced. In fact, the range is likely to be greater than this (see for example, Bauen et al., 2005). The broader range in possible emissions arises from very large array of technological and management options available at almost very stage in the feedstock production and conversion sectors, location of production (local or international) and the importance of integrated transport logistics. Also, other renewable transport fuels may be cheaper and/or have a greater impact on reducing GHG emissions. A large array of alternative renewable energy resources could be used for renewable transport fuel (RTF) production in the UK. It is estimated that UK-sourced biomass and non-biomass renewable transport fuels could theoretically substitute over half of road transport fuel use, based on the estimated practical renewable energy potential and an average assumed conversion efficiency from renewable resource to transport fuel of 50% (Woods & Bauen, 2003). These renewable energy resources are roughly equally divided between biomass and waste, and direct renewable electricity sources. In practice, there will be a number of technical and economic constraints and competition between renewable resources for different end uses, that will reduce the potential for RTF production from renewables. On the other hand, competition for land for food production is likely to continue to decrease as subsidies to food crops are reduced and global competition in agricultural commodities grows, particularly for cereals. Also, supplies of RTFs from abroad may be cheaper than home production. Therefore, a UK RTF industry will need to make sustained gains in efficiency and cost reductions if it is to become and remain competitive. Despite a lack of UK-based experience in the wide-spread production of energy crops they are increasingly viewed as an important component of agri-environment and rural development activities. A variety of energy crops could be grown, ranging from annual crops such as oilseed rape, sugar beet and wheat, to perennial crops such as short rotation willow or poplar coppice and energy grasses e.g. miscanthus. However, other energy end-uses, i.e. electricity and heat, are also likely to compete with the transport sector for the same renewable energy resources. Trade-offs in terms of economics and the environment between these competing end uses will need to be carefully addressed. In order to effectively address climate change and the associated reduction in GHG emissions, standardised methodologies and data collection are required. This standardised approach is necessary to allow a realistic crosscomparison between the relative benefits of using the biomass, and other renewable, resources for competing single and poly generational pathways to renewable energy production. However, an agreed methodology for comparing the net GHG emissions and wider environmental and social impacts has not yet been produced. The work
2 commissioned by the HGCA to develop such an assurance scheme could provide the basis for developing a methodology that encompasses a wide range (if not all) the renewable transport fuel provision options with the GHG calculator representing a significant first stage in this process. The evolving role of a GHG calculator in such a process is described below.
1.1 Why is a GHG calculator required? Growing biomass in modern agricultural systems requires energy inputs (mostly fossil-fuel and direct solar). In a standard ethanol-from-wheat production chain, these inputs could represent a quarter of the total energy requirements for producing and delivering the ethanol. However, the share of total GHG emissions is disproportionately large, primarily as a result of including an estimate for field-level nitrous oxide (N2O) emissions. In the example provided in Table 1, agricultural GHG emissions account for just over half of the total emissions resulting from the production and delivery of ethanol in a model UK supply chain. Farm-level GHG emissions from nitrous oxide and those that result from the production of nitrogen fertilisers account for over 40% of the total chain emissions. No allowance is made for potential emissions that could result from land use change which together with nitrous oxide emissions represent the greatest areas of uncertainty in calculating the net chain GHG emissions. Much can be done to reduce the energy, and particularly the fossil energy, inputs into the production and conversion of biomass for biofuel production. UK farmers have already made great strides in reducing inputs into agriculture as highlighted by Turley et al (2005). However, the different quality requirements for biomass produced for energy versus food production may allow further reductions in inputs and management intensity. But, how can farmers and agricultural planners evaluate which changes to management and inputs will have the greatest impact on the overall energy and GHG balances for biofuel production? Table 1: Farming share of energy and GHG emissions for ethanol production Energy Inputs
GHG Emissions
GJp/ha
% of total chain
Kg CO2eq/ha
% of total chain
Diesel
4.7
7.0%
356.6
5.8%
K fertiliser
0.4
0.6%
21.0
0.3%
P fertiliser
0.7
1.0%
29.1
0.5%
N fertiliser
7.5
11.1%
1238.0
20.2%
Pesticides
0.6
0.8%
10.8
0.2%
Seed Material
2.5
3.7%
160.4
2.6%
1290.6
21.0% 50.6%
N2O emissions Total Farm
16
24.2%
3106
Rest of Chain
51.1
75.8%
3037.2
Notes: based on Model B22 Natural Gas-Gas Turbine Boiler + fired Steam
3 recovery (LCVP report; Rickeard et al, 2004). This model assumes that the straw is ploughed back in and is therefore awarded a nitrogen credit reducing the N-fertiliser requirement from 253kgN per ha to 185kgN/ha.
The calculator described here, provides farmers with a simple tool to assess the impact of changes in management and inputs on the lifecycle GHG balance for ethanol production from wheat in the UK. It reports in both tabular and graphical formats, the impact of changes in inputs (e.g. nitrogen fertiliser rates) on the final GHG balance for ethanol for a selected conversion chain. As a result farmers, biofuel producers and policy makers can assess the value of investing in new more energy efficient equipment or altering the level of inputs to strike the best yield : input balance for an entire production chain.
1.2 Why now? That it is not possible to calculate a credible single generic GHG (or carbon) factor for the net (LCA) emissions resulting from the use of a biofuels at the national level has profound implications for the development of the sector and the calculation of incentives or tax breaks that Government can or should award. The combination of the high oil price, the EU Biofuels Directive (EU, 2003) and the imminent announcement of the UK Renewable Transport Fuels Obligation are powerful drivers for the increased production and utilisation of biofuels in the UK. The existing mechanisms to discourage GHG emissions, such as the UK Emissions Trading Scheme, operate at the national boundary and are therefore not sufficiently capable of differentiating between the emissions resulting from the different sectors. In addition, the Renewables Obligation (RO) for the electricity sector, assumes strict carbon-neutrality for the biomass feedstocks consumed, despite widely divergent origins and compositions and there is currently no mechanism for assessing the GHG intensity of renewable transport fuel options. The UK government has made a powerful yet challenging commitment to the reduction of national GHG emissions within the Kyoto framework and beyond which leaves planners with no option than to address transport sector emissions together with the other sectors. Yet in the short term, the only proven viable alternatives to petrol and diesel are biofuels (bioethanol and biodiesel). The development of a UK assurance scheme for biofuel production will provide a transparent framework for evaluating the actual GHG emissions from alternative routes to producing and using renewable transport fuels (see for example Woods & Bauen, 2003). It is therefore, critical that biofuel production (and use) is optimised to maximise the GHG benefits that can arise from substituting the relevant fossil fuels. Should government policy incentivise energy use on the basis of quantified GHG emissions, producers and suppliers risk having locked themselves into inefficient supply pathways (including sunk investments in infrastructure) and thus becoming uncompetitive unless they maximise GHG performance now. The calculator has been developed to allow these calculations to take place using an agreed and transparent evidence base.
4
1.3 Scientific basis Well-To-Tank (WTT) lifecycle analysis is a critical component of understanding the energy and GHG impact of new fuel/vehicle technologies through a transparent methodology that can be used to allow comparison with alternatives. The principles and standards for Lifecycle Assessment are laid out by the International Standards Organisation through its ISO 14040 series of standards (ISO, 1997). The framework developed by ISO 14040 has been used by a range of relevant LCA analyses used in the development of the Calculator, in particular the work carried out by Mortimer et al (2004) and Rickeard et al, (2004). Conventional biofuels (ethanol and biodiesel) are generally used as blends with petrol or diesel in existing vehicles, so comparison of the fuel production cycles is the most important aspect of the analysis. For the Bioethanol GHG Calculator we assumed that the ethanol is produced from wheat grain via the conventional hydrolysis and fermentation process. The evidence-base for each of the assumptions made is provided in the text of the relevant sections and pointers to background literature are provided.
1.4 Possible uses for the calculator The Bioethanol Calculator might be used to: •
Raise awareness among farmers, bioethanol producers and consumers of GHG and global warming issues, highlighting the nexus between GHG emissions and fertilisers and pesticide applications.
•
Attract interest of agricultural procedures because practices which reduce GHG emissions may also increase production efficiencies and thus the profitability of agricultural operations.
•
Formalize an accepted means of calculating and reporting GHG emission reductions associated with ethanol feedstock cultivation and ethanol production and use.
•
Assign the benefits (e.g. credits) of GHG emission reductions to the ethanol feedstock producers who implement practices in verifiable, quantifiable GHG emission reductions.
•
Give consumers or investors confidence that the bioethanol has been produced under conditions that meet sustainability standards.
•
Enable stakeholders such as NGOs and oil companies to assess the environmental performance of biofuels, in particular in relation to GHG reductions.
•
Assist policymakers in understanding of the extent to which a fuel increases the security of the energy supply.
5
2.
Scope of work
This work was commissioned by the HGCA in July 2005, as an independent followup to existing work on developing a GHG assurance scheme for biofuel production pathways in the UK. The terms of reference were to produce a user-friendly tool that used scientifically peer-reviewed methodologies and default factors to produce industry-standard and acceptable reports, focused at the farm-level. See section 1.3 for the scientific basis that underpins this methodology. The GHG calculator has been developed to allow farmers (and other interested parties) to input data on the factors that they can manage so as to become more GHGefficient e.g. nutrient, pesticide and energy inputs. The calculator provides a breakdown of the impacts of changes in one (or all) of the main energy-relevant inputs as a function of the overall emissions resulting from the final production of the biofuel (ethanol) in a range of easy-to-compare units. All reporting is provided on a full Lifecycle well-to-tank basis.
3.
Who should use the calculator and why
Changing agricultural management practices can reduce field-level GHG emissions and if carried out at a sufficiently large scale could result in measurable reductions in atmospheric GHG emissions. Incentives which reward lower GHG-emitting fuels, either directly through targeted subsidies, tax breaks, etc, or indirectly through the creation of new economically viable markets e.g. carbon trading, are emerging. Given the sensitivity of the whole-chain GHG emissions to the emissions arising from the feedstock production sector, feedstock suppliers are likely to want to understand the cost-benefit of such changes in practice. For example, it is possible that biomass feedstocks for bioenergy production could be categorised by their GHG emissions intensity in a similar way that wheat grain is currently sold by its protein content. Biofuel producers would then purchase feedstock of a sufficiently low GHG-intensity to ensure that the biofuel produced could meet stated maximum emission levels when used in a vehicle. Such a system would be a pre-requisite for any environmental labelling scheme for low GHG fuels or vehicles. The GHG calculator can be used by any of the stakeholders in a bioethanol fuel supply chain (e.g. farmers, biofuel producers, investors, NGOs, academics and policy makers) to sensitise themselves to the key issues involved in understanding how GHG emissions can be managed and how the different sub-sectors are inter-dependent. In its current configuration, the calculator reports solely on full lifecycle GHG emissions of wheat-based bioethanol production and does not include economic or wider environmental factors. However, it does provide a practical pathway towards; firstly, a GHG assurance scheme and secondly, a wider sustainability assurance scheme.
6
4.
Using the Calculator
The bioethanol GHG calculator is an interactive spreadsheet-based tool for calculating the GHG emissions resulting from the production and use of wheat-based bioethanol in the United Kingdom. It uses input data describing the entire production chain for any batch of ethanol to calculate the GHG emissions associated with that batch and compares the results with those produced from the production and use of an equivalent quantity of petrol. The methodology and factors underlying the calculations are based on a consensus study carried out by experts from industry and academia as part of the Low Carbon Vehicles Partnership in 2004 (LCVP, 2004). The tool is provided as a Microsoft Excel workbook. Please note that Macros must be enabled for the tool to run.
4.1 Data Input Page The calculator opens to the Data Input Page, shown in Figure 1. The bioethanol production chain is specified on this page by entering data and making selections that describe the inputs, outputs and other features of the different sections of the chain. The use can make appropriate selections and entries as instructed on the page or simply leave the existing default values. Further clarification can be obtained by pressing the “HELP” button. For each section of the ethanol production chain, standard default values can be reentered by clicking on the "Set Default Values" button. These default values are based on a typical production chain producing 100 000 tonnes of ethanol per annum, as analysed in the Low Carbon Vehicles Partnership study by Rickeard et al (LCVP, 2004). The functions and input data requirements of the different sections of the Data Input Page are described below.
7
FEEDSTOCK: WHEAT
DATA INPUT PAGE Please make selections from the drop-down lists and click inside the boxes to change quantities. For further help, click the "HELP" button on the right.
HELP HELP
For each section of the ethanol production chain, standard default values can be entered by pressing the "Set Default Values" button. After specifying the entire production chain, press the "CALCULATE" button at the bottom of the page.
FARMING INPUTS AND YIELDS kg N/ha
Diesel consumption l/ha
185
141 Was straw ploughed in at end of previous crop?
kg P2O5/ha
94
Pesticide active ingredient kg/ha
kg K2O/ha
55
Seed material kg/ha
2 185
8
Crop Yield t/ha
Yes, straw ploughed in No, straw removed
Set Default Values
PRE-PROCESSING (DRYING AND STORAGE) Grain moisture before drying, %
16
Grain moisture after drying, %
3
Diesel consumption l/t dried grain
18.5
Electricity consumption kWh/t dried grain
11.7
Set Default Values
TRANSPORT TO PROCESSING Mode
Distance
Road
50 km
Set Default Values
PROCESSING Energy Generation
NG GT + steam generator + steam turbine
Natural gas consumption GJ/t ethanol
Imported electricity kWh/t ethanol
27.2
Ethanol Yield l/t feedstock supplied to plant
Destination of DDGS co-product Surplus Electricity kWh/t ethanol
416
0 Animal feed
2525
Set Default Values
TRANSPORT TO END USE Mode
Road
Distance
150 km
Set Default Values
CALCULATE CALCULATE
Figure 1: Main input sheet for the calculator
4.1.1 Data Input Help Guidance on data input can be obtained by clicking on the HELP button on the right of the upper section of the Data Input Page. The Data Input Guidance Sheet is displayed as shown in Figure 2 below.
8
DATA INPUT GUIDANCE The table below provides guidance on entering data and making selections to specify a bioethanol production chain for calculation of the greenhouse gas emissions associated with that chain. After reviewing the relevant sections, click the "BACK" button at the bottom of this page to return to the DATA INPUT page.
Section
Entry/Selection
Notes
Nitrogen fertiliser rate (kg N/ha)
Enter quantity of nitrogen fertiliser applied in kilograms nitrogen per hectare
Phosphate fertiliser unit drop-down (kg P2O5/ha or kg P/ha)
Select units in which you measure phosphate fertiliser application rates
Potash fertiliser unit drop-down (kg K2O/ha or kg K/ha)
Select units in which you measure potash fertiliser application rates
Phosphate fertiliser rate
Enter quantity of phosphate fertiliser applied in kilograms per hectare, ensuring the correct units are selected in the adjacent drop-down list
Potash fertiliser rate
Enter quantity of potash fertiliser applied in kilograms per hectare, ensuring the correct units are selected in the adjacent drop-down list
Diesel consumption l/ha
Enter total quantity of diesel fuel used on the farm for growing wheat, in litres per hectare. Note that this should not include any fuel used in wheat drying.
FARMING INPUTS AND YIELDS
Pesticide active ingredient kg/ha
Enter total quantity of pesticide applied in kilograms of active ingredient per hectare
Seed material kg/ha
Enter total quantity of seed used in kilograms of active ingredient per hectare
Was straw ploughed in at end of previous crop? (Option buttons - Yes straw ploughed in / No, straw removed)
PRE-PROCESSING (DRYING AND STORAGE)
TRANSPORT TO PROCESSING
Crop Yield t/ha
Click on appropriate option button to indicate whether wheat straw was ploughed in or removed after the previous harvest Enter average number of tonnes of wheat produced per hectare
Grain moisture before drying, %
Enter grain moisture before drying, in percent
Grain moisture after drying, %
Enter grain moisture after drying, in percent
Diesel consumption l/t dried grain Electricity consumption kWh/t dried grain
Enter total quantity of diesel fuel used for drying wheat, in litres per tonne dried wheat grain Enter electricity consumed in drying wheat, in kWh per tonne dried wheat grain
Transport mode drop-down list Transport distance
Select mode of transport of dried wheat grain to processing facility Enter average distance from farm to ethanol plant
Energy generation drop-down list
Select means of heat and electricity provision at ethanol plant
Natural gas consumption GJ/t ethanol
Enter total natural gas consumption at ethanol plant, in gigajoules per tonne ethanol produced. This will include natural gas used for generating the heat and electricity required for ethanol production as well as for generating any surplus electricity
Imported electricity kWh/t ethanol
Enter total electricity imports used for ethanol production, in kilowatt-hours per tonne ethanol produced.
Surplus Electricity kWh/t ethanol
Enter total electricity generated at ethanol plant but not used for ethanol production, in kilowatt-hours per tonne ethanol produced.
Straw consumption kg/l ethanol
Enter quantity of straw used as fuel at ethanol plant, in kilograms per litre of ethanol produced
Straw transport drop-down list
Select mode of transport of straw fuel to ethanol plant
Straw transport distance
Enter average distance that straw fuel is transported from farm to ethanol plant
Ethanol Yield l/t feedstock supplied to plant
Enter yield of ethanol in litres per tonne dried wheat grain supplied to the ethanol plant
DDGS Destination drop-down list
Select destination of distiller's dried grains and solubles (DDGS) co-product - use as animal feed or use as co-fuel in a power plant
Transport mode drop-down list Transport distance
Select mode of transport of ethanol to distribution sites Enter average distance from ethanol plant to distribution sites
PROCESSING
TRANSPORT TO END USE
BACK BACK
Figure 2: Data Input Guidance Sheet
4.1.2 Farming inputs and Yields This section summarises how the data describing the inputs and outputs of the farming stage of the production chain and be used in the calculator.
FARMING INPUTS AND YIELDS kg N/ha
185
Diesel consumption l/ha
141 Was straw ploughed in at end of previous crop?
kg P2O5/ha
94
Pesticide active ingredient kg/ha
kg K2O/ha
55
Seed material kg/ha
2 185
Crop Yield t/ha
8
Yes, straw ploughed in No, straw removed
Set Default Values
Figure 3: Farm-level inputs - data requirements
Enter quantities of fertiliser, seeds, pesticides and fuel used in cultivation of wheat for ethanol production:
9
•
Nitrogen fertiliser rate (kg N/ha) – Enter quantity of nitrogen fertilizer applied in kilograms nitrogen (N) per hectare.
•
Phosphate fertiliser unit drop-down (kg P2O5/ha or kg P/ha) – Select units in which you measure phosphate fertiliser application rates.
•
Potash fertiliser unit drop-down (kg K2O/ha or kg K/ha) – Select units in which you measure potash fertiliser application rates.
•
Phosphate fertiliser rate – Enter quantity of phosphate fertiliser applied in kilograms per hectare, ensuring the correct units are selected in the adjacent drop-down list.
•
Potash fertiliser rate – Enter quantity of potash fertiliser applied in kilograms per hectare, ensuring the correct units are selected in the adjacent drop-down list.
•
Diesel consumption (l/ha) – Enter total quantity of diesel fuel used on the farm for growing wheat, in litres per hectare. Note that this should not include any fuel used in wheat drying.
•
Pesticide active ingredient (kg/ha) – Enter total quantity of pesticide applied in kilograms of active ingredient per hectare. This figure should include all herbicides, insecticides and fungicides.
•
Seed material (kg/ha) – Enter total quantity of seed applied in kilograms per hectare.
Indicate whether the straw resulting from the previous crop had been ploughed back into the soil or removed. This function affects the quantities of fertilisers required for the crop, and also the emissions of the powerful GHG nitrous oxide from the land. •
Was straw ploughed in at the end of previous crop? (Option buttons – ‘Yes, straw ploughed in’ / ‘No, straw removed’) – Click on appropriate button to indicate whether wheat straw was ploughed in or removed after the previous harvest.
Finally, enter the crop yield in tonnes per hectare. •
Crop yield (t/ha) – Enter average number of tonnes of wheat grain produced per hectare as harvested. Moisture contents are stated in the pre-processing section.
4.1.3 Pre-processing This refers to the drying of wheat grain prior to delivery at the processing plant. Enter the percentage moisture of the wheat grain before and after drying. Enter the total diesel fuel and total electricity consumed in drying and storage of the wheat. This enables calculation of the reduction in weight of the wheat grain between harvest and delivery to the ethanol plant and the associated GHG emissions arising from the energy inputs.
10
PRE-PROCESSING (DRYING AND STORAGE) Grain moisture before drying, %
16
Grain moisture after drying, %
3
Diesel consumption l/t dried grain
18.5
Electricity consumption kWh/t dried grain
11.7
Set Default Values
Figure 4: Pre-processing inputs, data requirements
•
Grain moisture before drying (%mass) – Enter grain moisture before drying as percent by mass: grain moisture =
mass of water in grain × 100% total mass of grain
•
Grain moisture after drying (%mass) – Enter grain moisture content after drying as percent by mass.
•
Diesel consumption (l/t dried grain) – Enter total quantity of diesel fuel used for drying wheat, in litres per tonne of dried wheat grain.
•
Electricity consumption (kWh/t dried grain) – Enter electricity consumed for wheat drying, in kWh per tonne dried wheat grain.
4.1.4 Feedstock Transport In this section, enter details of the transportation of the wheat grain from preprocessing to the processing plant. Enter the mode of transport (road, rail, etc.), and the average transportation distance.
TRANSPORT TO PROCESSING Mode
Road
Distance
50 km
Set Default Values
Figure 5: Feedstock Transport to Processing- data requirements
•
Transport mode drop-down list – Select mode of transport.
•
Transport distance – Enter average distance (one-way) from farm (preprocessing point e.g. grain drying barn) to ethanol plant.
4.1.5 Processing Data describing material and energy inputs and outputs at the ethanol conversion facility are entered in this section if necessary. Default values are available for a number of conversion plant configurations following the Rickeard et al, 2004 analysis (LCVP, 2004).
11 PROCESSING Energy Generation
NG GT + steam generator + steam turbine
Natural gas consumption GJ/t ethanol
Imported electricity kWh/t ethanol
27.2
Ethanol Yield l/t feedstock supplied to plant
Destination of DDGS co-product Surplus Electricity kWh/t ethanol
416
0 Animal feed
2525
Set Default Values
Figure 6: Processing / Conversion, data requirements
•
Energy Generation drop-down list – Select the means of heat and electricity provision at the ethanol plant. The available options are: •
NG boiler and grid This setup uses a conventional natural gas-fired steam boiler for steam generation and imports electricity from the grid
•
NG boiler and steam turbine This is a combined heat and power (CHP) arrangement using a conventional natural gas-fired steam boiler and a backpressure steam turbo-generator.
•
NG GT + steam generator + steam turbine Here a natural gas-fired gas turbine coupled to an unfired heat recovery steam generator and a backpressure steam turbo-generator are used.
•
NG GT + fired steam generator + steam turbine This configuration has a natural gas-fired gas turbine, a co-fired heat recovery steam generator and a backpressure steam turbo-generator. It differs from the previous example in that it employs additional co-firing for increased efficiency.
•
Straw boiler + steam turbine This option uses straw as to generate heat and electricity from a combination of a straw-fired steam boiler and a backpressure steam turbogenerator. When selected, additional fields are provided to specify the amount of straw consumed and the mode of straw transport.
Alternatively, the user can enter amounts of natural gas and electricity used at the ethanol plant, as well as amounts of surplus electricity exported. If straw is used as fuel at the ethanol plant, enter the amount of straw used, the average distance (oneway) that it is transported to the plant, and the mode of transportation. •
Natural gas consumption (GJ/t ethanol) – Enter total natural gas consumption at ethanol plant, in gigajoules per tonne ethanol produced. This will include natural gas used for generating the heat and electricity required for ethanol production as well as for generating any surplus electricity.
•
Imported electricity (kWh/t ethanol) – Enter total electricity imports used for ethanol production, in kilowatt-hours per tonne ethanol produced.
12 •
Surplus electricity (kWh/t ethanol) – Enter total electricity generated at ethanol plant but not used for ethanol production, in kilowatt-hours per tonne ethanol produced.
•
Straw consumption (kg/l ethanol) – Enter quantity of straw used as fuel at ethanol plant, in kilograms per litre of ethanol produced.
•
Straw transport drop-down list – Select mode of transport of straw fuel to the ethanol plant.
•
Straw transport distance - Enter average distance (one-way) that straw fuel is transported from farm to ethanol plant.
•
Ethanol Yield (l/t feedstock supplied to plant) – Enter yield of ethanol in litres per tonne dried wheat grain supplied to the ethanol plant.
•
DDGS Destination drop-down list – Select destination of distiller’s dried grains and solubles (DDGS) co-product – use as animal feed or use as co-fuel in a power plant.
4.1.6 Transport to End-Use In this section, enter details of the transportation of ethanol from the processing plant to the distribution sites or leave the default values. Enter the mode of transport, and the average transportation distance.
TRANSPORT TO END USE Mode
Road
Distance
150 km
Set Default Values
Figure 7: Ethanol Transport to end-use, data requirements
•
Transport mode drop-down list – Select mode of transport of ethanol to distribution sites as either; road, rail, sea or air.
•
Transport distance – Enter average distance (one-way) from ethanol plant to distribution sites.
4.1.7 Calculation After specifying the entire production chain, press the “CALCULATE” button at the bottom of the page. The Report Page is then displayed.
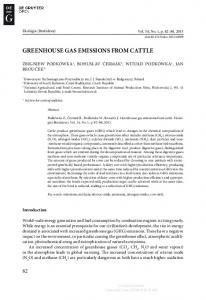
4.2 Report Page The Report Page displays the total GHG emissions resulting from the production of ethanol as specified on the Data Input page. It also shows how the different sections of the production chain contribute to this total. A comparison with the emissions from production and use of petrol is given in terms of the percentage reduction in GHG emissions relative to those of an energy-equivalent amount of petrol.
13
BIOETHANOL GREENHOUSE GAS CALCULATOR
REPORT PAGE This page shows the greenhouse gas emissions associated with the production of bioethanol based on the lifecycle inputs from the data entry page
Feedstock: Ethanol Yield:
Wheat 2882 litres per hectare
GHG Units:
Production Chain Specifications
Greenhouse Gas Emissions
FERTILISER, SEEDS & PESTICIDES 185 kg N, 94 kg P2O5, 55 kg K2O, 2 kg pesticide and 185 kg seed per hectare Straw ploughed in
637.8 kg CO2eq/t
ON FARM FUEL USE 157.1 kg CO2eq/t
141 litres diesel/ha
N2O EMISSIONS 564 kg CO2eq/t
Assumed proportional to quantity of nitrogen fertiliser applied
PRE-PROCESSING 195.2 kg CO2eq/t
18.5 l diesel/t dried grain 11 7 kWh l t i it /t d i d TRANSPORT TO PROCESSING
i
Dried wheat grain transported by road on average 50 km to distillery
12.84 kg CO2eq/t
PROCESSING Energy generation:
Destination of DDGS:
NG GT + steam generator + steam turbine: 27.2 GJ natural gas, 0 kWh imported electricity and 2525 kWh surplus electricity per tonne ethanol
Animal feed -208 kg CO2eq/t
TRANSPORT TO END USE 12.72 kg CO2eq/t
Ethanol transported by road on average 150 km to end use
TOTAL: Percent reduction relative to petrol emissions:
1372 kg CO2eq/t bioethanol
40.35%
kg CO2eq/t bioethanol -300
-200
-100
0
100
200
300
400
500
600
700
Fertiliser, seeds & pesticides On-farm fuel use N2O emissions Pre-processing Transport to processing Processing Transport to end use
Developed by The Edinburgh Centre for Carbon Management, Imperial College London and Themba Technology For comments or further information contact Richard Tipper (
[email protected]), Jeremy Woods (
[email protected]) or Gareth Brown (
[email protected])
Figure 8: Calculator Reporting Screen - calculation outputs
The units in which the GHG emissions are presented may be changed by selecting from the ‘GHG Units’ drop-down box in the upper right-hand corner of the page. The buttons at the bottom of the Report Page have the following functions:
14 Clicking the BACK button takes the user back to the Data Input Page. Clicking the VIEW REFERENCES button displays the data sources (references) on which the underlying default emission factors and conversion efficiencies are used to generate the calculations by calculator. Clicking the VIEW CALCULATIONS button displays a spreadsheet with detailed calculations and intermediate results for the ethanol production chain specified. Clicking the SAVE REPORT creates a new file containing the current Report Page and the detailed calculation spreadsheet. Clicking the PRINT REPORT prints the current Report Page and the detailed calculation spreadsheet. Clicking the CLOSE button closes the calculator tool without saving.
4.3 The Calculations Page The Calculations Page (see Figure 9) displays a spreadsheet with detailed calculations for the GHG emissions of the particular ethanol production chain being analysed. It is accessed by clicking the ‘View Calculations’ button on the Report Page. This page provides the results of intermediate calculations throughout the chain along with the input data and underlying factors used.
15
Bioethanol Production Chain - Calculation of Greenhouse Gas Emissions FEEDSTOCK:
Wheat Fuel and Energy Data
Ethanol Production Chain Yields Feedstock yield, t/ha Ethanol yield, l/t dried grain Ethanol yield, t/ha
8.0 416 2.29
Anhydrous Ethanol Petrol Diesel Natural Gas (EU-mix) Electricity (UK-mix)
Lower heating value (MJ/l) 21.28 32.95 35.71
GHG Emissions Factor (kgCO2eq/GJ)
Density (kg/l) 0.794 0.749 0.834
85.8 87.4 60.8 160
Feedstock Production Fertiliser, seed and pesticides Application Rate (kg/ha) N fertiliser P fertiliser (as P) K fertiliser (as K) Pesticide (as active ingredient) Seed production
GHG Emissions Factor (kgCO2eq/kg)
185 41 46 2 185
6.69 0.71 0.46 5.41 0.87
Emissions Rate (kg/ha)
Global Warming Potential (kgCO2eq/kg)
4.36
296
GHG Emissions (kgCO2eq/t ethanol) 541.0 12.7 9.1 4.7 70.1
GHG Emissions (kgCO2eq/l ethanol) 0.43 0.01 0.01 0.00 0.06
GHG Emissions GHG Emissions (kgCO2eq/petrol(kgCO2eq/GJ ethanol) equivalent litre ethanol) 0.67 20.19 0.02 0.47 0.01 0.34 0.01 0.18 0.09 2.62
On-farm N2O emissions GHG Emissions (kgCO2eq/t ethanol) 564
GHG Emissions GHG Emissions (kgCO2eq/petrol(kgCO2eq/GJ ethanol) equivalent litre ethanol) 0.45 0.69 21.04
GHG Emissions (kgCO2eq/l ethanol)
On-farm diesel usage Usage Rate (l/ha) Total used for cultivation Credit for use of set-aside Net
GHG Emissions Factor (kgCO2eq/l)
141 -25.8 115.2
GHG Emissions (kgCO2eq/t ethanol)
3.1 3.1 3.1
192 -35 157
GHG Emissions GHG Emissions (kgCO2eq/petrol(kgCO2eq/GJ ethanol) equivalent litre ethanol) 0.15 0.24 7.18 -0.03 -0.04 -1.31 0.12 0.19 5.86
GHG Emissions (kgCO2eq/l ethanol)
Pre-Processing 16% 3%
Grain moisture before drying Grain moisture after drying
Energy Consumption (GJ/t dried grain) Diesel fuel Electricity
GHG Emissions (kgCO2eq/t ethanol)
0.661 0.042
GHG Emissions GHG Emissions (kgCO2eq/petrol(kgCO2eq/GJ ethanol) equivalent litre ethanol) 0.14 0.21 6.52 0.02 0.03 0.76
GHG Emissions (kgCO2eq/l ethanol)
174.8 20.4
Feedstock Transport to Processing
Mode of Transport Dried wheat grain
GHG Emissions Factor (kgCO2eq/t-km)
Distance (km)
Road
50
0.085
GHG Emissions (kgCO2eq/t ethanol) 12.84
GHG Emissions GHG Emissions (kgCO2eq/petrol(kgCO2eq/GJ ethanol) equivalent litre ethanol) 0.0102 0.0158 0.4790
GHG Emissions (kgCO2eq/l ethanol)
Processing Energy Supply: Destination of DDGS:
NG boiler and grid Animal feed
Natural gas Imported electricity Credit for surplus electricity Credit for DDGS
Energy Consumption and Credits (GJ/t ethanol) 11.8 1.45 0.00 -3.133 (GJp)
GHG Emissions (kgCO2eq/t ethanol)
GHG Emissions (kgCO2eq/l ethanol)
717 232 0 -407
0.57 0.18 0.00 -0.32
GHG Emissions GHG Emissions (kgCO2eq/petrol(kgCO2eq/GJ ethanol) equivalent litre ethanol) 0.88 26.77 0.29 8.66 0.00 0.00 -0.50 -15.20
Ethanol Transport to End Use
Mode of Transport Road
GHG Emissions Factor (kgCO2eq/t-km)
Distance (km) 150
GHG Emissions (kgCO2eq/t ethanol)
0.085
12.72
GHG Emissions GHG Emissions (kgCO2eq/petrol(kgCO2eq/GJ ethanol) equivalent litre ethanol) 0.0101 0.0156 0.4746
GHG Emissions (kgCO2eq/l ethanol)
Summary
GHG Emissions (kgCO2eq/t ethanol) Emissions source Fertiliser, seeds & pesticides On farm fuel consumption On-farm N2O emissions Pre-processing Transport to processing Processing Transport to end use
Total
GHG Emissions (kgCO2eq/l ethanol)
637.68 157.10 563.98 195.21 12.84 542.27 12.72
0.51 0.12 0.45 0.15 0.01 0.43 0.01
2121.8
1.68
GHG Emissions GHG Emissions (kgCO2eq/petrol(kgCO2eq/GJ ethanol) equivalent litre ethanol) 0.78 23.79 0.19 5.86 0.69 21.04 0.24 7.28 0.02 0.48 0.67 20.23 0.02 0.47
Ethanol Percent Reduction In Greenhouse Gas Emissions Relative to Petrol:
BACK
Figure 9: Calculations Page
2.61
79.17
7.7%
16
5.
Underlying factors and calculations
A range of assumptions, default factors and conversion efficiencies have been used in the calculator in order to generate the lifecycle GHG emissions data. These assumptions and factors are based on through review of the available literature relevant to full lifecycle assessment of biofuel production chains and on the feedback from the project steering group. In order to meet accepted standards in transparency and to clearly explain how the calculations are derived a summary is provided below for each of the assumptions and factors used.
5.1 Basis of Calculations The Calculator integrates all the GHG emissions directly or indirectly attributable to the inputs and processes involved in the different stages of a selected wheat-to-ethanol production chain. From this total, it subtracts credits for GHG emissions avoided by the bioethanol co-products substitution of other GHG-generating products and processes e.g. DDGS used as animal feed substituting for maize gluten feed. Direct emissions are those resulting from the combustion of fuels in the ethanol production chain. Indirect emissions are those resulting from the production of the fuels used, the generation of imported electricity and the manufacture of material inputs and equipment used in the ethanol production chain. Indirect emissions may require separate lifecycle analyses to be carried out on the associated sectors or reference systems e.g. animal feed or fossil fuel production. The Calculator does not separate out direct and indirect emissions, but calculations are based on emissions factors which incorporate both direct and indirect emissions. Each GHG emissions factor gives the total emissions of the GHGs; carbon dioxide (CO2), methane (CH4) and nitrous oxide (N2O) associated with a product, process or activity in a single carbon dioxide equivalent emission (CO2eq) figure. Derivation of carbon dioxide equivalent emissions is based on the concept of global warming potentials as specified by the International Panel on Climate Change (IPCC, 2001). The global warming potential of a gas is a measure of the relative potency of a mass of that gas as a GHG compared with an equal mass of carbon dioxide over a specific period of time. To quantify the lifecycle GHG benefits from bioethanol production and use compared with petrol production and use, the Calculator compares the fuels on the basis of energy content. It does so, on the basis of the lifecycle emissions per unit quantity (e.g. 1 tonne, 1 litre) of bioethanol, arising from feedstock cultivation through to final combustion in vehicles, compared with the lifecycle emissions for a quantity of petrol with equal energy on combustion. Issues relating to potential differences in vehicle conversion efficiency (fuel energy to mechanical energy; so called ‘tank-to-wheels’) are not dealt with except through the use of a conservative energy equivalence basis to the calculations. Carbon dioxide emissions resulting from the combustion of the biofuel are assumed to equal the carbon dioxide captured during crop growth and are therefore not included. Within the tool, the emission factors used are those adopted by the Low Carbon Vehicle Partnership study (LCVP, 2004). Similarly, the tool uses the LCVP emission factors and methodology for calculations of GHG credits. These factors and methods are fixed in the current version of the Calculator, but could be altered in future
17 versions given sufficient evidence that this was necessary. Details of emissions factors, credit allocation and emissions calculations are given below.
5.2 Agricultural Inputs The GHG emissions associated with production of fertilizers, seeds and pesticides (as active substance) are given in Table 2. All these factors will vary over time and with production methods and location. However, these values were chosen in the LCVP study as being representative of current production of these agricultural inputs in the UK or in countries which supply these inputs to the UK. Table 2: GHG emission factors for fertilizers, seeds and pesticides Agricultural Input
GHG Emissions (kg CO2eq/kg)
Nitrogen fertilizer (as N) Phosphate fertilizer (as P) Potash fertilizer (as K) Pesticides (as active ingredient) Seed material
6.69 0.71 0.46 5.41 0.87
The LCVP GHG emission factors are in turn derived from earlier work by Elsayed et al (2003) and Mortimer et al (2004). They represent the emissions of carbon dioxide, methane and nitrous oxide, converted to carbon dioxide equivalent emissions using 100-year global warming potentials for these gases of 1, 24.5 and 320 respectively. The nitrogen fertilizer emission factors are based on ammonium nitrate, which according to the 2002 edition of ‘British Survey of Fertilizer Practice’ is the most commonly used nitrogen fertilizer in the UK (DEFRA, 2003). The phosphate and potash fertilizer emission factors are similarly representative of products used in the UK. Pesticides include all insecticides, herbicides and fungicides and are reported as kg of ‘active substance’.
5.3 Effects of Straw Removal After harvest, wheat straw may be ploughed back into the fields or removed and used for fuelling a power plant or for other uses. Ploughing straw back into the soil after harvest reduces the need for fertilizers and improves soil quality. The amounts of additional fertilizer required as a result of straw removal will depend on local conditions and on the amount of straw removed. For the representative wheat cultivation chain studied by the LCVP, the N, P, and K fertilizer applications required per hectare, with and without straw removal, were as shown in Table 3 Straw removal can also have a significant impact on nitrous oxide (N2O) emissions from the fields. The processes involved in generation of these emissions are complex and still not thoroughly understood. At the current stage of development of the tool, the approach taken by Rickeard et al was adopted (LCVP, 2004). That is, N2O emissions are assumed to be proportional to the quantity of nitrogen applied. This is considered to be reasonable over the range of fertilizer application levels that may be expected, and the constant of proportionality used is 0.0236 kg of N2O emissions per
18 kg of nitrogen fertilizer (as N) applied. Very recent work appears to challenge this assumption, particularly in cooler temperate climates and further work is required to clarify the N2O emissions methodology. Table 3: Effects of straw removal on fertilizer requirements Fertilizer type N fertilizer (as N) P fertilizer (as P) K fertilizer (as K)
Fertilizer application, kg/ha all straw ploughed back all straw removed 185 253 41 53 46 164
In the Calculator, selection of either of the option buttons for “straw ploughed in” or “straw removed” has no effect on calculations other than through enabling adjustment of fertilizer application rates for the default cultivation conditions (as per Table 3) via the “Set Default Values” button. In a wheat-to-ethanol GHG calculator, it would be useful to be able to accept input data on the fate of straw and use this directly in calculations of nitrous oxide emissions from the land as well in calculations of credits for use of straw for purposes other than fuel for the bioethanol plant. However, this would require more information than is currently readily available. As indicated above, precise estimates of the effects of removal of different amounts of straw from the field on N2O emissions require better models of the N2O emission processes. For calculations of GHG emissions credits for straw, the amounts of straw removed, the uses to which it is put, and the GHG emissions associated with the displaced products, would have to be known. Site specific soil and climate information may also be important factors in estimating N2O emissions.
5.4 Fossil Fuels and Electricity For all consumption of fossil fuels and electricity from the grid, the GHG emission factors shown in Table 4 are used. Table 4: GHG emissions factors for fossil fuels and electricity
Diesel Gasoline Natural Gas (EU-mix) Grid Electricity (UK-mix)
GHG Emissions (kg CO2eq/GJ) 87.4 85.8 61 160
5.5 Transport Calculations of GHG emissions resulting from transport of wheat feedstock, straw fuel and ethanol product are based on the GHG emissions factors shown in Table 5.
19 Table 5: GHG emissions factors for freight transport Transport Mode Road Rail Air Sea
GHG Emissions Factor (kgCO2eq/t-km) 0.085 0.03 0.57 0.007
The road transport mode option assumes that fossil diesel is used. The GHG emissions factor is based on diesel consumption for road freight of 0.97 MJ/t-km (Concawe, 2003) and the GHG emissions factor for diesel burning of 87.4 kg CO2eq/GJ as given in Table 4. The diesel consumption for road freight includes an allowance for an empty return trip after delivery of wheat, straw or ethanol over the specified one-way distance. Transport by rail, sea and air transport were not considered in the LCVP study and the GHG emission factors for these modes of transport are taken from DEFRA (DEFRA, 2005). This reference does not specify inclusion of an empty return trip in GHG emissions factors, but the factors for rail and sea transport given by Defra are very similar to those in Concawe 2003, which does include empty return trips in its emissions factors. Therefore, the use of the Defra figures for rail, air and sea transport is considered reasonable at this stage of development of the Calculator.
5.6 Credits Wheat-to-ethanol production chains also produce a number of by-products and coproducts, some of which are valuable products in their own right. It is therefore essential to consider multiple products when allocating the total GHG emissions that are associated with a particular production chain. Currently, there is not an accepted best method of performing this allocation. In the Calculator, allocation by substitution is used following the recommendations of Rickeard et al (LCVP, 2004). In this method, the primary product is assigned the total GHG emissions minus credits equal to the GHG emissions avoided as a result of coproduct displacement of alternative products elsewhere.
5.6.1 Distillers Dark Grains and Solubles (DDGS) DDGS is a coproduct of all the wheat-to-ethanol production chains included in the Calculator. DDGS has value as an animal feed, and may also be used as a fuel for cofiring in coal power stations. The Calculator allows for a choice between these two options for the use of DDGS coproduct and then calculates credits for GHG emissions avoided through displacement of equivalent amounts of animal feed production elsewhere or electricity generation as per UK-grid. Based on data from the LCVP study, it is assumed that 0.39 tonne of DDGS (10% moisture) is produced for every tonne of wheat grain (dry basis) going into the ethanol plant. This ratio may change according to wheat and process characteristics, and future versions of the Calculator would allow variation of this parameter. DDGS could also be used to provide process energy and electricity in a similar way to the ‘straw-fired’ option discussed above, but this is not considered in this version of the Calculator.
20 As in the LCVP study, imported soya bean meal from the USA is chosen as the animal feed product that is substituted by DDGS in calculations of animal feed credits. Future versions of the Calculator would allow for a choice of different animal feed products substituted, but currently only limited data is available on lifecycle GHG emissions from production of other animal feed products that may be displaced by DDGS. Each kilogram of DDGS is considered to substitute for 0.78 kg of soya bean meal, on the basis of relative protein content (Concawe, 2003). Production in the USA and transport to the UK of each kilogram of soya bean meal result in emissions of 0.46 kg CO2eq. For DDGS used as fuel in co-firing for electricity production, a credit of 945 kg CO2eq per tonne of DDGS is applied. This is based on the assumptions that: •
DDGS (10% moisture) has a lower heating value of 18.2 GJ/t, the same as wheat grain on a dry basis.
•
DDGS is converted to electricity at the UK average rate of 0.325 gigajoule of electricity output per gigajoule of primary energy input.
•
The electricity generated from DDGS substitutes for other electricity generation with GHG emissions equal to the UK average of 160 kg CO2eq/GJe (Table 4).
It may be argued that electricity generated by the cofiring of DDGS with coal displaces marginal coal-based electricity generation, and that the calculations of GHG emission credits should be based on this coal-derived electricity rather than the UK grid average. This will need to be considered in future versions of the Calculator.
5.6.2 Surplus electricity Any surplus electricity produced by an ethanol plant (that is, any electricity that is generated but not used by the plant) is assumed to displace generation of an equal amount of grid-supplied electricity with GHG emissions equal to the UK electricity generation average of 160 kg CO2eq/GJe, and this value is used to calculate credits for those ethanol production chains which include generation of surplus electricity.
5.6.3 Set-aside, carbon dioxide and straw In the Calculator, all wheat for ethanol production is assumed to be grown on rotational set-aside, and a credit of 922 MJ/ha (equivalent to 25.8 l/ha of diesel fuel) is applied for avoidance of maintenance of set-aside land. As discussed in section 5.3 above, no credits are assigned for straw not used as fuel in the ethanol plant. Similarly, no credits are assigned for any carbon dioxide by-product that may be captured from the wheat-to-ethanol fermentation process. Most of the carbon dioxide that is produced and sold industrially originates as a by-product of other industrial operations, and if this CO2 was not captured, it would be vented to atmosphere. Thus, CO2 capture from bioethanol production would not result in a net displacement of CO2 emissions. If carbon dioxide is captured and stored indefinitely, then a CO2 credit would be appropriate. Future versions of the Calculator may therefore need to include such a credit.
21
6.
Default Bioethanol Production Chains
In order to illustrate typically expected inputs, yields and resultant GHG emissions of different bioethanol production chains, the Data Input Page of the Calculator provides the option to accept the input data adopted by the LCVP experts for each of the main sections of the production chain by clicking on an associated “Set Default Values” button. These default process characteristics are described below.
6.1 Basic wheat-to-ethanol pathway The values adopted by the LCVP study for the basic non-energy inputs and yields of the different processes in the bioethanol production chain are shown in Figure 10. 0.081 t Seed
Wheat production and supply 1.424 t straw
CULTIVATION AND HARVESTING 0.437 ha
J
3.499 t wheat (16% moisture content)
DRYING AND STORAGE 3.03 t dry wheat grain (3% moisture content)
TRANSPORT (road)
Ethanol production MILLING 10 t water
0.913 t CO2
HYDROLYSIS AND FERMENTATION
10 t alcohol (10% ethanol) + 1.14 t solids
DISTILLATION
DRYING
1.058 t distillate (94.5% ethanol)
DEHYDRATION
1 t bioethanol
Figure 10: Basic assumptions for default wheat to ethanol pathways (LCVP, 2004)
1.14 t DDGS 9.942 t waste water
22
6.2 Farming Inputs and Yields For calculation of default GHG emissions from the farming component of the bioethanol production chain, the values in Table 6 are used. Table 6: Default farming inputs and yields
Inputs
Straw ploughed back
All straw removed
Diesel fuel, l/ha
141
141
K fertilizer (as K), kg/ha
46
164
P fertilizer (as P), kg/ha
41
53
N fertilizer (as N), kg/ha
185
253
Pesticides (as active ingredient),
2
2
Seed material, kg/ha
185
185
Wheat grain, t/ha
8.0
8.0
Wheat Straw, t/ha
1.42
1.42
Yields
6.3 Pre-processing (Drying and Storage) For the default case, wheat grain is assumed to be harvested at 16%mass moisture and dried to 3%mass moisture before delivery to the ethanol plant. The drying and storage of the wheat consumes 18.5 litres of diesel fuel and 11.7 kWh of electricity per tonne of dried grain produced.
6.4 Transport to Processing In all default production chains, dried wheat grain is assumed to be transported by road in diesel-fuelled trucks over an average distance of 50 km from the farm to ethanol plant.
6.5 Processing The default processing plant yields 416 litres of anhydrous ethanol per tonne of dried wheat grain delivered to the plant. Additionally, 1.14 tonne of distiller’s dried grains and solubles is produced for every tonne of anhydrous ethanol produced. The entire production process at the plant requires 9.75 GJ of heat and 1.45 GJ (403 kWh) of electricity per tonne of anhydrous ethanol produced. The first energy supply option in the calculator simply generates the necessary heat using a natural-gas fired boiler and imports the necessary electricity from the grid. The other options use combined heat and power (CHP) equipment sized to match the heat requirements of the plant, and produce varying amounts of surplus electricity.
23 The LCVP study group used typical operating characteristics and actual data from similar equipment currently in operation to determine the fuel inputs and energy outputs of suitably sized combined heat and power generation systems. These default fuel inputs and surplus electricity outputs of the five energy supply options included in the Calculator are summarized in Table 7. Table 7: Default fuel inputs and surplus electricity outputs Fuel Inputs and Surplus Electricity Outputs Natural gas consumption, GJ/t eth Imported electricity, kWh/t ethanol Surplus electricity, kWh/t ethanol Straw fuel consumption, kg/l ethan
NG boiler + NG boiler + grid steam turbine 11.8 403 0 0
14.4 0 396 0
NG GT+ steam gen+ steam turbine 27.2 0 2525 0
NG GT+ fired steam gen+ steam turbine 18.2 0 1389 0
Straw boiler + steam turbine 0 0 575 1.13
For the straw-burning CHP option, the default characteristics involve the assumption that the quantity of straw available for fuel is equal to the total straw co-produced with the wheat grain being converted into ethanol. Therefore, 1.424 t of straw is burnt per tonne of ethanol produced, equating to 1.13 kg straw/l ethanol (Table 7). It is also assumed that the straw is transported by road in diesel-fuelled trucks an average distance of 50 km from the farm to ethanol plant.
6.6 Transport to End Use In all default production chains, ethanol is assumed to be transported by road in diesel-fuelled trucks over an average one way distance of 150 km from ethanol plant to fuel blending/distribution site.
24
7.
References
Bauen, A., Howes, J., Chase, A., Tipper, R., Inkinen, A., Lovell, J. and Woods, J. Feasibility Study on Certification for a Renewable Transport Fuel Obligation. Eds.: Archer, G. (Fuels Working Group). London, UK: LCVP. FWG-P-0507:1-80, 2005. http://www.lowcvp.org.uk/resources/agendasandminutes/working.cfm?catid= 3&catName=Fuels Canadian Pollution Prevention Information Clearinghouse (CPPIC). Glossary. Available at: www.ec.gc.ca/cppic/En/glossary.cfm EU- Commission of the European Communities. Directive 2003/30/EC - on the promotion of the use of biofuels or other renewable fuels for transport. Brussels, Belgium: DG Environment. 2003/30/EC:1-5, 2003. CONCAWE, EUCAR & JRC.. Well-to-Wheels analysis of future automotive fuels and powertrains in the European context. Version 1a. Appendix 1. European Commission. Brussels. 2003 CONCAWE, EUCAR & JRC. Well-to-Wheels analysis of future automotive fuels and powertrains in the European context. Version 1b. European Commission. Brussels 2004 Defra. Annexes to Guidelines for Company Reporting on Greenhouse Gas Emissions. 2005 http://www.defra.gov.uk/environment/business/envrp/gas/envrpgasannexes.pdf Defra. The British Survey of Fertiliser Practice. Fertiliser Use on Farm Crops Year 2002. ISBN 1-86190-128-3. p.65, 2003. Elsayed, M.A., Matthews, R. and Mortimer, N.D. Carbon and Energy Balances for a Range of Biofuel Options" Energy Technology Support Unit, Harwell, United Kingdom, Report B/B6/00784/REP, March 2003. ww.shu.ac.uk/rru/projects/biofuels/biofuels.html. GM & LBST. Report: GM Well-to-Wheel Analysis of Energy Use and Greenhouse Gas Emissions of Advanced Fuel/Vehicle Systems – A European Study. L-BSystemtechnik GmbH. Germany. 2002. Available at: www.lbst.de/gm-wtw GM & LBST.. Annex “Full Background Report – Methodology, Assumptions, Descriptions, Calculations, Results to the GM Well-to-Wheel Analysis of Energy Use and Greenhouse Gas Emissions of Advanced Fuel/Vehicle Systems – A European Study. L-B-Systemtechnik GmbH. Germany. 2002. Available at: www.lbst.de/gm-wtw IPCC. Climate Change 2001: The Scientific Basis. Eds.: Houghton, J.T., Ding, Y., Griggs, D.J., Noguer, M., van der Linden, P.J., Da, X., Maskell, K., and Johnson. C.A.. NY, USA.: Cambridge University Press; Working Group I, 2001. http://www.grida.no/climate/ipcc_tar/index.htm
25 IPIECA. Climate Change: A Glossary of Terms. 2nd Edition. International Petroleum Industry Environmental Conservation Association. London. 2000. ISO. ISO 14040: Environmental management - Life cycle assessment - Principles and framework. International Standards Organisation, Geneva, Switzerland. 1997. http://www.iso.org/iso/en/CatalogueDetailPage.CatalogueDetail?CSNUMBE R=23151 LCVP. Well-to-Wheel Evaluation for Production of Ethanol from Wheat. A Report by the Low Carbon Vehicle Partnership (LowCVP) Fuels Working Group. London. 2004. http://www.lowcvp.org.uk [see Rickeard et al. 2004, for more details]. Mortimer, N.D., Elsayed, M.A. and Horne, R. Energy and Greenhouse Gas Emissions for Bioethanol Production from Wheat Grain and Sugar Beet. Resources Research Unit of the School of Environment and Development, Sheffield Hallam University, UK. Report No. 23/1 for British Sugar, 2004. Mosier, A.R., Syers, J.K., Freney, J.R. Nitrogen Fertilizer: An Essential Component Of Increased Food, Feed, And Fiber Production. Book Chapter in: A.R. Mosier, J.K Syers And J.R. Freney (Eds). Agriculture And The Nitrogen Cycle: Assessing The Impacts Of Fertilizer Use On Food Production And The Environment. Scope Vol. 65, Island Press, Washington, D.C. Pp. 15. 2004. NREL. HOMER - The Micropower Optimization Model. Help. Golden Colorado, USA. 2003. Rickeard, D.J., Punter, G., Larivé, J.-F., Edwards, R., Mortimer, N.D., Horne, R., Bauen, A., and Woods, J. WTW Evaluation for Production of Ethanol from Wheat. London: LCVP. Pg: 1-39, 2004. Toyota Motor Corporation. Well-to-Wheel Analysis of Greenhouse Gas Emissions of Automotive Fuels in the Japanese Context. Well-to-Tank Report. 2004. Turley, D., McKay, H., and Boatman, N. Environmental Impacts of Cereal and Oilseed Rape Cropping in the UK. London, UK: HGCA. Research Report No: 54:1-124, 2005. Woods, J. and Bauen, A. Technology Status Review and Carbon Abatement Potential of Renewable Transport Fuels (RTF) in the UK. DTI; AEAT. B/U2/00785/REP URN 03/982: Pp 150, 2003. http://www.dti.gov.uk/energy/renewables/publications/pdfs/B200785.pdf
26
Definitions and terminology The following glossary of definitions and terminology has been derived from a series of existing glossaries1. Alternative Energy is the energy derived from non-fossil fuel sources. Alternative Transportation Fuel. Under the Alternative Fuels Act, 1995, alternative transportation fuel must include, but is not limited to, ethanol, methanol, propane gas, natural gas, hydrogen or electricity, and these must be used as a sole source of direct propulsion energy (see also Renewable Transport Fuel). Alternative Fuel Vehicle is a vehicle purchased or leased from an original equipment manufacturer (or converted in the aftermarket) that is capable of operating on an alternative transportation fuel. Flex-fuel and bi-fuel vehicles are also considered to be alternative fuel vehicle, as are vehicles that operate on blended fuels, when an alternative transportation fuel makes up at least fifty percent of the blend. Analysis the process of dividing up the landscape into its component parts to gain a better understanding of it. Anthropogenic Emissions is the emissions of greenhouse gases associated with human activities. These include burning of fossil fuels for energy, deforestation and land-use changes. Approach is the step-wise process by which landscape assessment is undertaken. Assessment is a term to describe all the various ways of looking at, analysing, evaluating and describing the landscape. Baseline is a projected level of future emissions against which reductions by project activities could be determined, or the emissions that would occur without policy intervention. Biofuel is a fuel produced from dry organic matter or combustible oils produced by plants. Examples of biofuel include alcohols (from fermented sugar), black liquor from the paper manufacturing process, wood and soybean oil. Biological Diversity is the variety of life and the natural processes of which living things are a part. This includes the living organisms, the genetic differences between them, and the communities in which they occur (Audubon Nature Institute). Biomass is the total dry organic matter or stored energy content of living organisms. Biomass can be used for fuel directly by burning it (e.g., wood), indirectly by fermentation to an alcohol (e.g., sugar) or extraction of combustible oils (e.g., soybeans). Carbon Cycle is the natural processes that govern the exchange of carbon (in the form of CO2, carbonates and organic compounds etc.) among the atmosphere, ocean 1
Adapted from 1) IPIECA. 2000. Climate Change: A Glossary of Terms. 2nd Edition; 2) NREL. 2002. HOMER - The Micropower Optimization Model. Help. Golden. CO; 3) Canadian Pollution Prevention Information Clearinghouse (CPPIC). Glossary. Available at: www.ec.gc.ca/cppic/En/glossary.cfm
27 and terrestrial systems. Major components include photosynthesis, respiration and decay between atmospheric and terrestrial systems (approximately 100 billion tonnes/year (Gt); thermodynamic invasion and evasion between the ocean and atmosphere, operation of the carbon pump and mixing in the deep ocean (approx. 90 billion tonnes/year). Deforestation and fossil fuel burning releases approximately 7 Gt into the atmosphere annually. The total carbon in the reservoirs is approximately 2000 Gt in land biota, soil and detritus, 750 Gt in the atmosphere and 38,000 Gt in the oceans. (Figures from IPCC WGI Scientific Assessment 1990.) Over still longer periods geological processes of outgassing, volcanism, sedimentation and weathering are also important. Carbon Dioxide, or CO2 is a naturally occurring gas. It is also a by-product of burning fossil fuels and biomass, as well as land-use changes and other industrial processes. It is the principal anthropogenic GHG that affects the earth’s temperature. It is the reference gas against which other GHGs are indexed and therefore has a ‘Global Warming Potential’ of 1. Carbon dioxide constitutes approximately 0.036 per cent of the atmosphere. The mass ratio of carbon to carbon dioxide is 12:44. Carbon Dioxide Fertilization is an enhancement of plant growth or yield as a result of an increase in the atmospheric concentration of CO2. Carbon emissions (t/yr) is the amount of carbon emitted annually by the power system. Carbon emissions result from the consumption of fuels (including biomass) and from the purchase of power from the utility grid. The annual carbon emission of a generator or boiler is equal to its annual fuel consumption multiplied by the fuel carbon content. The annual grid-related carbon emissions are equal to the total net grid energy purchased (which may be negative) times the grid carbon content. Note: This variable refers to carbon emissions, not carbon dioxide emissions. To calculate carbon dioxide emissions, multiply the carbon emissions by 3.67 (this assumes all carbon is released in the form of carbon dioxide). Carbon Intensity is carbon dioxide emissions per unit of energy or economic output. Carbon Intensity is a measure of the amount of greenhouse gas produced per unit of product over its lifecycle (or the major part of its lifecycle). Carbon intensity is normally expressed in units of CO2 equivalent emissions per unit of the product, taking into account other greenhouse gases such as methane and oxides of nitrogen that may be emitted (Bauen, et. al., 2005). Carbon Sequestration is the long-term storage of carbon or carbon dioxide in the forests, soils, ocean, or underground in depleted oil and gas reservoirs, coal seams, and saline aquifers. Examples include: the separation and disposal of CO2 from flue gases or processing fossil fuels to produce H2 and carbon-rich fractions; and the direct removal of CO2 from the atmosphere through land use change, afforestation, reforestation, ocean fertilization, and agricultural practices to enhance soil carbon. Carbon Sinks is a natural or man-made systems that absorb carbon dioxide from the atmosphere and store them. Trees, plants, and the oceans all absorb CO2 and, therefore, are carbon sinks. Carbon Tax is a tax placed on carbon emissions. It is similar to a BTU tax, except that the tax rate is based on the fuel’s carbon content. Climate is the average trend of weather, including its variability in a geographical region. The averaging period is typically several decades.
28 Climate Change (UNFCCC definition) is a change of climate which is attributed directly or indirectly to human activity that alters the composition of the global atmosphere and which is in addition to natural climate variability over comparable time periods. Combined cycle is an electricity generation where the waste heat of a gasturbine generator is used to heat water in a boiler to drive a steam-turbine generator, thereby increasing efficiency. Cogeneration is the use of waste heat from electricity generation, such as exhaust from gas turbines, for either industrial purposes or district heating. Coppicing is the traditional method of woodland management in which trees are cut down near to the ground to encourage the production of long, straight shoots that can be harvested. Distillers’ Dark Grains and Solubles or DDGS is a protein-rich residue/ by-product leaves after the wheat grain processing. Emissions (UNFCCC Definition) is the release of greenhouse gases and/or their precursors into the atmosphere over a specified area and period of time. Emissions are the substances released into the atmosphere or into water. In climate change, greenhouse gas emissions are the release of gases such as carbon dioxide, methane and nitrous oxide through natural and human activities. Emissions Cap is a mandated restraint, in a scheduled timeframe that puts a ‘ceiling’ on the total amount of anthropogenic greenhouse gas (GHG) emissions that can be released into the atmosphere. The Kyoto Protocol mandates caps on the GHG emissions released by Annex B, or developed, countries. Emissions Reduction Unit, or ERU is the ERU represents a specified amount of greenhouse gas emissions reductions achieved through a Joint Implementation project or as the unit of trade in greenhouse gas emissions trading systems. Emissions Trading is a market-based approach to achieving environmental objectives that allows those reducing greenhouse gas (GHG) emissions below what is required to use or trade the excess reductions to offset emissions at another source inside or outside the country. In general, trading can occur at the domestic, international and intra-company levels. Article 17 of the Kyoto Protocol, allows Annex B countries to exchange emissions obligations. Negotiations will determine the extent to which firms and others may be allowed to participate. International emissions trading constitutes one of the Kyoto Mechanisms, designed to provide Annex B countries cost-effective flexibility in reducing emissions to achieve their agreed commitments. Ethanol is a liquid that is produced chemically from ethylene or biologically from the fermentation of various sugars from carbohydrates found in agricultural crops and cellulosic residues from crops or wood. Depending on how it is produced, it can be used as a substitute for gasoline, and can result in significantly less greenhouse gas emissions than gasoline. It is also known as ethyl alcohol or grain alcohol. Fossil Fuels are the carbon-based fuels, including coal, oil and natural gas. Fuel carbon content (% by mass) is the carbon content of the fuel as a percent of its mass. This value is used to calculate the annual carbon emissions of the system.
29
Fuel Switching is a supplying energy services using different fuels. Often used to refer to actions that reduce CO2 emissions from electric utilities by switching from coal to natural gas. Global Warming is the view that the earth’s temperature is being increased, in part, due to emissions of greenhouse gases associated with human activities, such as burning fossil fuels, biomass burning, cement manufacture, cow and sheep rearing, deforestation and other land-use changes. Global Warming Potential, or GWP is a time dependent index used to compare the radiative forcing, on a mass basis, of an impulse of a specific greenhouse gas relative to that of CO2. Gases included in the Kyoto Protocol are weighted in the first commitment period according to their GWP over a 100-year time horizon as published in the 1995 Second Assessment Report of the IPCC. In that report, methane, for example has a radiative forcing that was estimated to be about 21 times greater than that of CO2, thus it has a GWP of 21. Greenhouse Effect is the trapping of heat by naturally occurring heat retaining atmospheric gases (water vapour, carbon dioxide, nitrous oxide, methane and ozone) that keeps the earth about 30° C (60° F) warmer than if these gases did not exist. Greenhouse Gases (GHG) are gases in the earth’s atmosphere that absorb and reemit infra-red radiation. These gases occur through both natural and humaninfluenced processes. The major GHG is water vapour. Other GHGs include carbon dioxide, nitrous oxide, methane, ozone and CFCs. GHG certification is a process by which a product or service is delivered with a formally declared carbon intensity, which is a measure of the amount of GHGs produced expressed in units of CO2 equivalent. The process is normally based upon a standardised method that makes use of a combination of direct information provision or measurements and assumptions taken from the scientific literature. The declared carbon intensity of each could be linked to the number of RTFO certificates issued (Bauen et. al., 2005). Intergovernmental Panel on Climate Change, or IPCC is a Panel established in 1988, by governments under the auspices of the World Meteorological Organization and the UN Environment Programme. It prepares assessments, reports and guidelines on the science of climate change, its potential environmental, economic and social impacts, technological developments, possible national and international responses to climate change and crosscutting issues. It provides advice to the UNFCCC’s Conference of the Parties. It is currently organized into 3 Working Groups which address: I) Science; II) Impacts, Adaptation and Vulnerability; and III) Mitigation; there is also a Working Group to address GHG Inventories. International Energy Agency, or IEA is a Paris-based organization formed in 1973 by the major oil-consuming nations to manage future oil supply shortfalls. Kyoto Lands. The Kyoto Protocol describes land use, land use change and forestry activities that require or allow the net GHG emissions from sinks to be accounted for by Parties in meeting their emission reduction commitments. The lands on which these activities take place are designated as Kyoto lands (as defined in the IPCC draft report on LULUCF).
30 Kyoto Protocol is the Protocol, drafted during the Berlin Mandate process, that, on entry into force, would require countries listed in its Annex B (developed nations) to meet differentiated reduction targets for their greenhouse gas emissions relative to 1990 levels by 2008–12. It was adopted by all Parties to the Climate Convention in Kyoto, Japan, in December 1997. Landscape is primarily the visual appearance of the land including its shape, form and colours. However, landscape is not purely a visual phenomenon. The landscape relies on a range of other dimensions including geology, landform, soils, ecology, archaeology, landscape history, land use, architecture and cultural associations. Land Cover is a combination of land use and vegetation that cover the land surface. Life Cycle is consecutive and interlinked stages of a product system, from raw material acquisition or generation of natural resources to the final disposal (ISO 14040). Life-Cycle Analysis is an analysis of the environmental impact of a product during the entirety of its lifecycle, from resource extraction to post-consumer waste disposal. It is a comprehensive approach to examining the environmental impacts of a product or package. Life-Cycle Assessment or LCA is a specific method for systematically identifying, quantifying and assessing inputs and outputs (i.e. sources of environmental impact) throughout a product's life cycle. It is one of a range of tools that support life cycle management, but is not a prerequisite for life cycle management (Environment Canada - Environmental Life Cycle Management: A Guide to Better Business Decisions). See also ‘Well-to-Wheel’ and ‘Well-to-Tank’ LCA. Life-Cycle Assessment or LCA is a process of evaluating the effects that a product has on the environment over the entire period of its life thereby increasing resourceuse efficiency and decreasing liabilities. It can be used to study the environmental impact of either a product or the function the product is designed to perform. LCA is commonly referred to as a “cradle-to-grave” analysis. LCA's key elements are: (1) identify and quantify the environmental loads involved; e.g. the energy and raw materials consumed, the emissions and wastes generated; (2) evaluate the potential environmental impacts of these loads; and (3) assess the options available for reducing these environmental impacts. Life cycle assessment (LCA) is: the overall process of assessing the life cycle impacts associated with a system, function, product or service. Sometimes considered to include the Initiation, Inventory, Impact Analysis and Improvement stages (SPOLD 93): •
• •
A concept and a method to evaluate the environmental effects of a product holistically, by analysing its entire life cycle. This includes identifying and quantifying a-energy and materials used and wastes released to the environment, assessing their environmental impact, and evaluating opportunities for improvement (CAN 94); Part of an overall life cycle assessment in which only the environmental consequences are considered (CML 95); Compilation and evaluation of the inputs, outputs and the potential environmental impacts of a product system throughout its life cycle (ISO 14040).
31 Life Cycle Impact Assessment is a phase of LCA aimed at understanding and evaluating the magnitude and significance of the potential environmental impacts of a product system (ISO 14040, ISO 97b). Methane, or CH4 is one of the six greenhouse gases to be included under the Kyoto Protocol, it has a relatively short atmospheric lifetime of 10± 2 years. Primary sources of methane are landfills, coal mines, paddy fields, natural gas systems and livestock. The SAR (1995) estimate of the Global Warming Potential of methane is 21, over a 100-year time horizon. See ‘Global Warming Potential’. Nitrous Oxide, or N2O is one of the six greenhouse gases to be curbed under the Protocol, it is generated by burning fossil fuels and the manufacture of fertilizer. It has a Global Warming Potential of 310 over a 100-year time horizon. See ‘Global Warming Potential’. Nitrous Oxide, or N2O is a colourless gas that occurs both naturally in the environment in plants and manure and from human-made sources such as chemical production and combustion. N2O is a greenhouse gas that remains in the atmosphere for long periods of time, absorbing heat and radiating it back to the earth's surface instead of allowing it to pass through into space. Ozone. Ozone (O3) is a greenhouse gas. In the troposphere, or lower part of the atmosphere, O3 can be a constituent of smog. It is created naturally and also by reactions in the atmosphere involving gases resulting from human activities, including NOx, or nitrogen oxides, from motor vehicles and power plants. The Montreal Protocol seeks to control chemicals which destroy ozone in the stratosphere (upper part of the atmosphere) where ozone absorbs ultra-violet radiation. Product Life Cycle is the summary of activities that go into making, transporting, using, and disposing of a product. To determine the environmental impacts of a particular product's life cycle, a lifecycle-analysis can be conducted on the activities, to identify, quantify and assess all inputs and outputs. Renewables are the energy sources that are constantly renewed by natural process. These include non-carbon technologies such as solar energy, hydropower and wind as well as technologies based on biomass. Life cycle analyses are required to assess the extent to which such biomass based technologies may limit net carbon emissions. Renewable Energy is the several energy sources that have little in common from a technology standpoint, but share one characteristic: they all produce electricity or thermal energy without depleting resources. Renewable energy sources include water, biomass, wind, solar, earth and waste stream energy. Renewable Transport Fuel is defined by the UK Energy Act 2004 as: i) biofuel, ii) blended biofuel; iii) any solid, liquid or gaseous fuel (other than fossil fuel or nuclear fuel) which is produced: a) wholly by energy from a renewable source; or b) wholly by a process powered by such energy; or iv) any solid, liquid or gaseous fuel which is of a description of fuel designated by an RTF order as renewable transport fuel ( see also: Alternative Transportation Fuel). Renewable Resource is the natural resources that are capable of regeneration. Renewable resources can essentially never be exhausted, usually because they are continuously produced (e.g., tree biomass, fresh water, and fish). Renewable resources are those natural resources that are naturally replenished, but whose
32 continued supply depends, in many cases, on proper management (e.g. tree biomass, fresh water, fish). Second Assessment Report, or SAR is a published by the IPCC in 1995 the SAR provided a comprehensive overview of the state of knowledge on climate change at that time. It contains the widely cited statement ‘the balance of evidence suggests that there is a discernible human influence on global climate’. The IPCC’s Third Assessment Report was finalised in 2001 (see below). Sequestration is an uptake of carbon dioxide from the atmosphere by plants and its subsequent storage as biomass. Semi-natural Vegetation is any type of vegetation that has been influenced by human activities, either directly or indirectly. Sinks (UNFCCC Definition) are any process or activity or mechanism which removes a greenhouse gas or a precursor from the atmosphere. Sulphur Dioxide or SO2 is a colourless gas with a pungent odour, irritates the upper respiratory tract in humans and leads to acidic deposition/acid rain. Originates from both anthropogenic (human) and natural sources and has been identified as one of the principal precursors to fine particulate matter. The main anthropogenic sources are from combustion in transportation, industry and the electric power generation sectors, whereas emissions from natural sources are mainly from volcanoes, marine bacteria and wetlands. Sustainability is the ability of an ecosystem to maintain ecological processes and functions, biodiversity, and productivity over time. Also a term used by governments to describe the efficient use of the earth's resources to ensure there will be adequate resources to support the economy and maintain a healthy environment for future generations to come. Sustainable Development is a Development that meets the needs of the present without compromising the ability of future generations to meet their own needs (World Commission on Environment and Development - the Brundtland Commission). Development is essential to satisfy human needs and improve the quality of human life. At the same time, development must be based on the efficient and environmentally responsible use of all of society's natural, human, and economic resources. Sustainable Transportation is an integrating economic, social and environmental considerations into decisions affecting transportation activity. A sustainable transportation system is one that is safe, efficient and environmentally responsible. System Boundary is a LCA term referring to then bounds set on a study in terms of what processes and activities will be analysed as part of the study. For example, in a study of a particular building all major materials may be within the system boundary, while minor material and worker travel may be excluded from the study and therefore left outside the system boundary. It is important to understand where people have set their system boundaries when comparing different LCA data. Third Assessment Report, or IPCC TAR is the third in a series of Assessment Reports prepared by the Intergovernmental Panel on Climate Change which review the existing scientific literature on the subject, finalized in 2001. It contains three main sections: Science; Impacts, Adaptation and Vulnerability; and Mitigation. It includes a 50- 80 page Synthesis Report, which will draw upon the three main
33 sections and other IPCC Special Reports to answer a number of policy-relevant scientific and technical questions (asked by UNFCCC SBSTA and refined by the IPCC Plenary). Each of the three main sections and the Synthesis Report will have a short Summary for Policy Makers. The information in the TAR will be considered by governments during UNFCCC negotiations. The Carbon Tax (£/t) is the cost penalty applied to the system for its total carbon emissions, expressed in dollars per tonne of carbon (not carbon dioxide). The System Fixed Capital Cost (£) is the capital cost that occurs at the start of the project regardless of the size or architecture of the power system. It is used to calculate the other annualized capital cost, so it affects the total net present cost of each system, but it affects them all by the same amount. It therefore has no effect on the system rankings. The System Fixed Operation and Maintenance Cost (£/yr) is the recurring annual cost that occurs regardless of the size or architecture of the power system. It is used to calculate the other annualized capital cost, so it affects the total net present cost of each system. But it affects them all by the same amount, so it has no effect on the system rankings. The Other O&M Cost (%/yr) is the system fixed O&M cost plus the cost of unmet load plus the cost of carbon emissions. The system fixed capital cost and the capital cost associated with any primary load efficiency measures are lumped together into the "other capital cost". UN Environment Programme, or UNEP is the UN agency, established in 1972, to coordinate the environmental activities of the UN. It aims to help reinforce and integrate the large number of separate environmental efforts by intergovernmental, non-govern- mental, national and regional bodies. UNEP has fostered the development of the UNFCCC and the Convention on Biological Diversity. UN Framework Convention on Climate Change, or UNFCCC is a treaty signed at the 1992 Earth Summit in Rio de Janeiro by more than 150 countries. Its ultimate objective is the ‘stabilization of greenhouse gas concentrations in the atmosphere at a level that would prevent dangerous anthropogenic [human-induced] interference with the climate system’. While no legally binding level of emissions is set, the treaty states an aim by Annex I countries to return these emissions to 1990 levels by the year 2000. The treaty took effect in March 1994 upon the ratification of more than 50 countries; a total of some 160 nations have now ratified. In March 1995, the UNFCCC held the first session of the Conference of the Parties (COP) the supreme body of the Convention in Berlin. Its Secretariat is based in Bonn, Germany. In the biennium 2000–01, its approved budget and staffing level are approximately US$12M annually with approximately 80 personnel. Used Oil is oil from industrial and non-industrial sources which has become unsuitable for its original purpose due to the presence of impurities or the loss of original properties. Well-to-Tank (WTT) LCA covers the full production and conversion part of the biofuel chain up to delivery of the end-fuel. This is notionally to the ‘tank’ of a vehicle but is often simplified to encompass delivery only to a point where the renewable fuel is treated in exactly the same manner as the reference fuel (e.g. petrol).
34 In this case ‘delivery’ is assumed to mean to the point of blending with the reference fuel or the ‘duty point’. Well-to-Wheel (WTW) LCA covers the entire production, conversion and use biofuel chain. It therefore includes the whole ‘Well-to-Tank’ component plus delivery to the garage forecourt, fuelling of the vehicle and final use in the vehicle.