Apalachicola River and shows high secondary produc- ... ty acid methyl esters were eluted from the plate and ..... microcolonies of anaerobic organisms live in.
APPLIED AND ENVIRONMENTAL MICROBIOLOGY, Jan. 1983, p. 58-63 0099-2240/83/010058-06$02.00/0 Copyright © 1983, American Society for Microbiology
Vol. 45, No. 1
Spatial Distribution of Biochemical Parameters Indicating Biomass and Community Composition of Microbial Assemblies In Estuarine Mud Flat Sediments THOMAS W. FEDERLE,' MEREDITH A. HULLAR,' ROBERT J. LIVINGSTON,' DUANE A. MEETER,2 AND DAVID C. WHITE'* Departments of Biological Science' and Statistics,2 Florida State University, Tallahassee, Florida 32306 Received 29 June 1982/Accepted 14 September 1982
The spatial distribution of communities was examined in estuarine mud flat sediments by the biochemical analysis of the lipids and lipid components extracted from the sediments. Total phospholipid was used as a measure of total biomass, and fatty acids were used as indicators of community composition. Comparisons were made among 2- by 2-m (location) and 0.2- by 0.2-m (cluster) sampling plots by using a nested analysis of variance to design an optimal sampling strategy to define the microbial content of a large, relatively homogenous area. At two of the three stations, a 2- by 2-m plot was representative of the station, but 0.2- by 0.2-m areas were in no case representative of the station. The biomass measured by the extractable phospholipid and the total lipid palmitic acid showed excellent correlation with the fatty acid "signatures" characteristic of bacteria, but showed a lower correlation with the long-chain polyenoic fatty acids characteristic of the microfauna. In the estuarine environment the greatest con- membranes contain phospholipids and the concentration of microorganisms is in the sedi- centration of phospholipids does not change ments, where many of the microbially mediated appreciably with different growth conditions (13, reactions of energy transformation and nutrient 14). Palmitic acid (16:0) is a major fatty acid in cycling occur. In any study of sediment microbi- nearly all microorganisms (3, 5, 8) and can also al activity or biomass, it is important to under- be utilized to give an estimate of the biomass (1, stand the spatial heterogeneity in the distribu- 12, 13). The extracted lipids can by hydrolyzed, tion of the microbial communities. Sediments fractionated, purified, and analyzed by capillary are a complex habitat at both the macro and gas-liquid chromatography. Certain components micro levels. Microbial measures in sediments of the lipid fraction are associated with subsets characteristically have large variances (6, 11) of the microbial community and can be used as which are related to patchiness in the distribu- lipid "signatures" to define this subset and tion of the microorganisms. To accurately repre- thereby gain insight into the community composent the microbiota of the sediments, a sampling sition (1, 2, 12, 13). The concept of the signature regime must minimize the problems associated lipids has been validated by manipulation of with this patchiness. microcosms with concurrent analysis of the The study of microbial communities in sedi- changes in morphology of specific portions of ments is complicated by the firm attachment of the communities in response to changes in light, microorganisms to sediment particles and the nutrients, and specific inhibitors and the effects inability of cultural methods to adequately enu- of grazing (White, in press). At the simplest level merate the wide variety of metabolically distinct it is possible to utilize the alkyl fatty acids to organisms (D. C. White, Symp. Soc. Gen. Mi- distinguish between the procaryotic and microbiol., in press). These problems have been croeucaryotic portions of the microbiota. The successfully overcome by using biochemical short odd and branched-chain fatty acids (e.g., methods, particularly by the extraction and anal- iso- and anteiso-15:0 and 15:0) are characteristic ysis of lipids and lipid components, which can be of a portion of the procaryotic organisms. The quantitatively recovered from the sediments. monoenoic fatty acid, 18:1w9, involves oxygen The lipids can be utilized as indicators of micro- in its synthesis, whereas the synthesis of 18:1X7 bial biomass and community structure. Phos- is carried out by the procaryotic anaerobic pathpholipid, measured as lipid phosphate, gives a way. The long-chain polyenoic fatty acids (>20 measure of the total cellular biomass since all carbons) are generally absent from bacteria and 58
VOL. 45, 1983
SPATIAL DISTRIBUTION AND COMMUNITY COMPOSITION
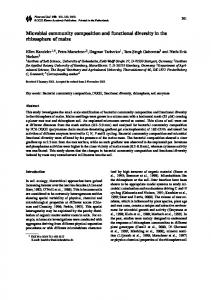
characteristic of microeucaryotic organisms. The positions of the unsaturation in the polyenoic fatty acids can help define the microfaunal or microfloral origin. Thus, the fatty acid profile can reflect changes and differences in the composition of a microbial community. This study employs these biochemical methods to study the spatial heterogeneity in the distribution of microbial communities in estuarine mud flats. The purpose was to determine how large an area must be sampled and analyzed adequately to represent the microbiota of a mud flat in its entirety. MATERIALS AND METHODS Study sites. Three estuarine mud flats were examined in this study and designated as stations ML, 3, and 5A. Station ML was located in Apalachee Bay (290 52' N, 840 25' W), and stations 3 and 5A (290 47' N, 840 55' W) were located in Apalachicola Bay off the northern panhandle of Florida. Station ML is characterized by high salinity and relatively low secondary productivity. Sediments in the area are sandy with depths ranging from 2 to 3 m. Station 3 is off the Apalachicola River and shows high secondary productivity with low salinity. This area is shallow (about 1 m) and receives considerable detrital input from the river. Station 5A is moderately productive with a salinity regime similar to that of station 3. However this shallow (1- to 2-m) mud flat receives drainage from upland swamps and is not directly influenced by the Apalachicola River in terms of detrital input. Thus station placement gave representative gradients of salinity and productivity. Details of these relationships are given by Livingston et al. (7). Sampling. At each station, tubular metal frames were anchored in the sediment, and a 2- by 2-m platform was suspended over the sediment surface. The platform contained a grid of sampling portals that allowed cores to be taken at exact locations in a designated pattern with minimal disturbance. Samples were taken with a 2-m-long coring device constructed from polyvinyl chloride pipe (3.2-cm diameter). The design was such that the lower 35 cm of core tube could be detached to access the surface sediments. Samples were taken in the pattern shown in Fig. 1. Platforms were placed at three locations at each station, and at each location three clusters of four adjacent cores were taken. All sampling was performed between 7 and 9 December 1981. The top 2 cm of the sediment was extruded with a plunger from each core tube, sieved with 2.5% saline through a 500- ±m screen into polypropylene centrifuge bottles, and preserved with 10o Formalin (final added concentration) as described previously (4). Before extraction of the lipids, the samples were centrifuged, and the sediment was resuspended and recentrifuged to remove the Formalin. Materials. Glass-distilled solvents were utilized (Burdick and Jackson, Muskegon, Mich.) or freshly distilled just before use in extractions or derivatizations. Lipid standards were purchased from Supelco, Inc. (Bellefonte, Pa.) or Applied Science Laboratories, Inc. (State College, Pa.). Lipid extraction. Centrifuged sediments were trans-
MARINE LAB STATL
59
APALACHICOLA STATION 3
/APALACHICOLA
/ STATION 5A
SOURCgS
OF
VARIATION
og-Q
0 0
000 : 0 0 00 0
00 0 0
0 0 0 0 0 0 0 00 00 00 0 000
o0 000 /'0 000 00o o 0 00 00
°
o00o o o00
2o2m
LOCATION
a. AMONG STATIONS
4 CORE
c. AMONG CLUSTERS
CLUSTER
AT A LOCATION d. AMONG CORES IN A CWSTER
b.
(3.2cm dameter CORE)
AMONG
LOCATIONS AT A STATION
FIG. 1. Diagrammatic representation of the experimental design and pattern of sampling.
ferred to tared stainless steel centrifuge bottles with 25 ml of buffer (0.01 M KH2PO4, 5.2 x 10⁻⁴ disodium EDTA), 75 ml of methanol, and 37.5 ml of chloroform. The bottles were sealed with Teflon-covered stoppers and shaken, and the mixture was allowed to stand for at least 2 h in a single phase. The mixture was separated into two phases with the addition of 37.5 ml of chloroform and 37.5 ml of water, and the bottles were centrifuged (9,000 x g, 15 min, 40C). The supernatant was transferred to a 250-ml separatory funnel, and the chloroform layer (containing the lipid) was recovered and dried. The sediment was dried at 100°C, and dry weight was determined gravimetrically. Lipid phosphate. Samples of the chloroform layer were dried and digested with perchloric acid, and phosphate was determined colorimetrically as described by White et al. (14). Fatty acids. Fatty acids were measured as their methyl esters as described by Bobbie and White (2). The chloroform layer was dried and subjected to acid methanolysis, and the resulting fatty acid methyl esters were purified by thin-layer chromatography and separated, identifed, and analyzed by high-resolution capillary gas-liquid chromatography. The hydroxy fatty acid methyl esters were eluted from the plate and quantified colorimetrically as described by Kates (9). Fatty acids are designated as number of carbon atoms: number of double bonds followed by the position of the double bond nearest the X (aliphatic) end of the molecule. The prefixes i and a refer to iso and anteiso branching. Statistical analysis. The data from each station were analyzed by using a three-level nested analysis of variance with Biomedical Computer program BMDP08V (Florida State University Computing Center).
RESULTS Comparison of sites. The microbiota at stations ML and 3 were very similar as indicated by the analysis of the fatty acids from the lipids (Table 1). The total biomass, measured as lipid phosphate and palmitic acid, was equal at the
60
APPL. ENVIRON. MICROBIOL.
FEDERLE ET AL.
TABLE 1. Grand means of the biochemical measures of the sedimentary microbiota and the significance levels of F values for differences among locations and among clusters at locations at each station Station 3 Station 5A Station ML Variation
Biochemical marker Xa
Among
locationsb NS NS NS NS NS NS NS NS NS NS
Among clusters'
X
Variation Among
Among
locations
clusters
NS NS 145 0.05 53.1 Lipid phosphate 0.10 NS 38.9 NS Total hydroxy fatty acids 14.9 0.05 NS 12.3 NS 3.2 i+ a 15:0 0.10 12.7 NS NS 8.7 15:0 0.05 NS 38.5 NS 17.3 16:0 0.05 9.6 NS NS 5.4 18:1X7 0.05 7.4 NS NS 2.6 18:1X9 0.01 NS 2.0 NS 0.6 18:2w6 NS NS 2.7 NS 2.9 20:4w6 0.05 5.7 NS NS 4.1 20:5X3 a Expressed as nanomoles per gram (dry weight) of sediment, n = 36. b Degrees of freedom, 2, 6; NS, not significant; 0.10, 0.05, and 0.01 indicate less c Degrees of freedom = 6, 27.
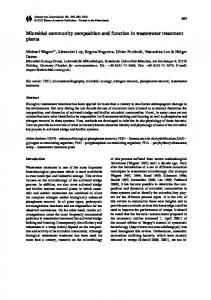
two stations, and the community structure reflected by the concentrations of the various fatty acids was nearly identical. In contrast, the microbiota at station 5A was quite different. There was nearly 3 times more biomass at this station compared with the others, and this higher biomass was reflected by increased concentrations of the hydroxy fatty acids and the bacterial fatty acids (i and a 15:0 and 15:0). The fatty acids that exhibited the least difference among stations were the long-chain polyenoic fatty acids (20:4w6 and 20:5X3) that are the signatures of the microeucaryotes. Comparison within sites. The nested analysis of variance allows the comparison of the locations at a station and the clusters at the locations to determine whether they are significantly different from each other (Table 1). A representative analysis of variance table from station ML for lipid phosphate with a more classical format and illustrating the variance at each hierarchical level is given in Table 2. In addition, the square roots of the estimated variance components expressed as percentages of the station mean (coefficients of variation) give rough estimates of the amount of variance at each level of the analysis (Fig. 2). At station ML, there were no significant differences among 2- by 2-m locations for any of the parameters measured. The concentration of lipid phosphate differed significantly from cluster to cluster within the locations, but no other significant differences among clusters were observed for the other parameters. The estimated variance components among locations were very small, ranging from 0 to 6% of the means. The variance components among clusters at locations were larger and more variable, and the variance components among cores in clusters
X
49.5 16.3 3.3 5.7 16.7 3.1 2.9 0.9 1.0 3.8
Variation Among Among locations clusters
0.10 NS 0.05 0.01 0.10 NS NS NS NS 0.10
NS NS NS NS NS NS NS NS NS NS
than or equal to P values.
were largest, ranging from 16 to 55% of the means. At station 5A, there were no significant differences among 2- by 2-m locations for any of the parameters. However, many parameters differed significantly from cluster to cluster including the fatty acids, i and a 15:0, 16:0, 18:1X7, 18:1w9, 18:2w6, and 20:5X3. The variance components among locations were negative, but among clusters at locations they ranged from 2 to 38% of the means. The largest variance components were among cores within clusters, ranging from 19 to 58% of the means. In contrast to the two previous stations, at station 3 significant differences among locations existed for two parameters, the fatty acids i and a 15:0 and 15:0, but no significant differences existed for any parameter among clusters within locations. The variance components among locations were relatively high, equalling up to 33% of the mean, but among clusters at locations they were small, ranging from 0 to 11% of the means. The variance components among cores within clusters were again the largest, ranging from 19 to 62% of the mean. Correlations between measures of biomass and community composition. Table 3 is a correlation matrix of the various biochemical markers of the microbiota at the three stations. The total biomass measured as lipid phosphate and palmitic acid was highly correlated with the fatty acids i and a 15:0, 15:0, the total hydroxy fatty acids, and 18:1M7, which are concentrated in the bacteria. The poorest correlations were between biomass (measured as the lipid phosphate and the ubiquitous fatty acid, palmitic acid) and the long-chain polyenoic fatty acids 20:4w6 and 20:503, which are the signatures of the microeucaryotes. These microeucaryote signatures cor-
VOL. 45, 1983
SPATIAL DISTRIBUTION AND COMMUNITY COMPOSITION
61
TABLE 2. Representative analysis of variance table for lipid phosphate at station ML Source of variance
Sum of squares
df
Mean square
F
Among locations (within station) Among clusters (within locations) Among cores (within clusters) a NS, Not significant.
326
1,656 2,303
2 6 27
163 276 85
0.59 3.24
related poorly with the hydroxy fatty acids and the short, odd-numbered bacterial fatty acids. DISCUSSION Distribution and sampling strategy. Natural populations exist in localized patches and rarely exhibit a random or uniform distribution in the environment. To characterize the microbiota over the extent of a habitat, the sample plot must be large enough to eliminate variations caused by this patchiness, but still small enough to be manageable. The use of biochemical methods 'SAI ION ML
Significance of F
Nsa P s 0.05
helps to eliminate the bias from incomplete release of organisms from the sediments, the necessity for growth (White, in press), and the variance created by subsampling homogenized sediment samples for enumeration (11). These methods also can be performed with a high level of reproducibility (2, 15) and generate a fingerprint of signatures that can be used to define the microbial community. The results of this study give indications of the strategy needed to optimally sample estuarine sediments to characterize the microbiota. Based
STATION 5A
STATION 3
LIPID P04
-OH FAME
0L
L
L
L AMONG
i+a 15:0
LOCATIONS AT STATIONS
L
15 0
L
IL[L
U 16:0
18:
LA tri,L
w
9
L
20;4wE
_
1820
AMONG CLUSTERS AT LOCATIONS
AMONG CORES IN CLUSTERS L
L
n
-
501t_LLL H FIG. 2. Square roots of the estimated variance components at each level of the analysis of the lipids expressed as a percentage of the grand means of the biochemical component of the sedimentary microbiota at three stations.
62
APPL. ENVIRON. MICROBIOL.
FEDERLE ET AL.
TABLE 3. Correlation matrix of biochemical markers of microbial biomass and community composition of the estuarine mud flat sediments at all three stations Biochemical marker
Lipid phosphate
OHFAa
0.804b 0.707 0.819 0.528 0.608 0.684 0.789 0.652 0.769 0.827 0.709 0.696 0.785 0.292 0.343 0.227 0.343 20:5X3 a Total hydroxy fatty acids. b Degrees of freedom, 106.
OHFA i + a 15:0 15:0 16:0 18:1X7 18:1w9 18:2w6 20:4w6
i + a 15:0
15:0
16:0
18:107
18:1w9
18:2w6
20:4w6
0.829 0.904 0.816 0.887 0.845 0.370 0.352
0.868 0.859 0.739 0.655 0.676 0.444
0.914 0.923 0.892 0.491 0.457
0.886 0.787 0.670 0.449
0.927 0.430 0.426
0.325 0.413
0.584
on the magnitude of the variance components, the greatest variances were among adjacent cores. However, this variance extended to larger areas of the plots. At two stations (ML and 5A), a 2- by 2-m plot gave an adequate representation of the microbiota, since no significant differences existed among locations. A smaller plot (0.2 by 0.2 m), represented by a cluster of cores, was insufficient to account for the variability at these stations, with significant differences existing among clusters at locations. At station 3, little variability was observed among clusters; however, significant differences existed among locations. At this station, a single 2by 2-m location would be insufficient to characterize the station. Although a single 2- by 2-m plot adequately represented the sediment microbiota at stations ML and SA, good experimental design would include the random sampling of multiple plots. Random sampling of four 1- by 1m plots or two 1.4- by 1.4-m plots would be more prudent than sampling a single 2- by 2-m plot. Litchfield et al. (6) compared viable counts of aerobic and anaerobic heterotrophic bacteria in 10-g subsamples of marine sediment taken from a single core. Although subsamples from the surface sediment exhibited similar bacterial densities, subsamples of the deeper sediments exhibited greater variation, indicating that the subsamples were inadequate to characterize the deeper sediments. No attempt was made to examine variation on a larger scale. Using cores that were homogenized by high-speed blending and subsampled before direct bacterial counts, Montagna (11) showed significant variation among subsamples, but not among cores, in marine sediments. Only four cores were examined, each with a total volume of 0.5 cm3. Since the variance among subsamples was significant, the ability to discriminate among cores was decreased. Based on the data from this experiment, one could optimize the cost-effectiveness of a future
sampling program. If costs could be assigned to sampling cores, clusters, and locations, the total sampling cost could be minimized subject to an upper bound on the variance of the grand mean (10). These data also could be used in designing test systems for extrapolating the fate and effects of xenobiotic chemicals from the laboratory to the field. For a test system to be valid, it should reflect the natural variability in the distribution of microbial communities in the field. The results of this experiment indicate that the size of the samples and the pattern in which they are taken are of significance. Biomass and community composition. The close relationship between the concentrations of the bacterial fatty acids (i and a 15:0 and 15:0) and total biomass indicates that bacteria account for the largest proportion of the biomass in the sediments. This is consistent with previous observations (2, 13, 14) and the fact that the majority of the habitats in sediments are anaerobic. The anaerobic subsurface areas are almost exclusively a procaryotic domain. In addition, microcolonies of anaerobic organisms live in anaerobic niches created by metabolic activity in the aerobic zones (13). The microeucaryotes have a more irregular distribution in the sediments. This is reflected in the lower correlation between total biomass and the microeucaryote signature fatty acids (20:4w6 and 20:5X3) as well as the higher variance in these measures among cores (Fig. 2). In summary, the following conclusions can be drawn concerning the distribution of microbial communities in estuarine sediments. (i) The variability in the distribution of microbial communities differed from station to station. (ii) Depending upon the station, a single 2- by 2-m plot was representative of the station; but in no case was a single 0.2- by 0.2-m plot representative of a station. (iii) At a minimum, a sampling area of sediment in excess of 0.04 m2 was needed to adequately represent the sedi-
VOL. 45, 1983
SPATIAL DISTRIBUTION AND COMMUNITY COMPOSITION
mentary microbiota of an estuarine mud flat with an area ranging from 25 to 50 hectares. (iv) The total biomass reflected the bacterial component more closely than the microeucaryotic components of the sediment. ACKNOWLEDGMENTS We gratefully acknowledge the excellent work of Duncan J. Cairns and William P. Greening, who collected the samples in the field, and Janet S. Nickels and Robert F. Martz, who performed the fatty acid analyses. This work was performed under contract NA81AA-D-0091 from the National Oceanic and Atmospheric Administration, Office of Sea Grant, Department of Commerce, funded by the U.S. Environmental Protection Agency, administered by the Gulf Breeze Environmental Research Laboratory, Gulf Breeze, Fla. LITERATURE CITED 1. Bobbie, R. J., J. S. Nickels, G. A. Smith, S. D. Fazio, R. H. Findlay, W. M. Davis, and D. C. White. 1981. Effect of light on the biomass and community structure of the estuarine detrital microbiota. AppI. Environ. Microbiol. 42:150-158. 2. Bobbie, R. J., and D. C. White. 1980. Characterization of benthic microbial community structure by high-resolution gas chromatography of fatty acid methyl esters. Appl. Environ. Microbiol. 39:1212-1222. 3. Erwin, J. A. 1973. Fatty acids in eukaryotic microorganisms, p. 41-143. In J. A. Erwin (ed.), Lipids and biomembranes of eukaryotic microorganisms. Academic Press, Inc., New York. 4. Federle, T. W., and D. C. White. 1982. Preservation of estuarine sediments for lipid analysis of biomass and community structure of microbiota. Appi. Environ. Microbiol. 44:1166-1169.
63
5. Lechevalier, M. P. 1977. Lipids in bacterial taxonomy-a taxonomist's view. Crit. Rev. Microbiol. 7:109-210. 6. Litchfield, C. D., J. B. Rake, J. Sindulis, R. T. Watanabe, and D. J. Stein. 1975. Optimization of procedures for the recovery of heterotrophic bacteria from marine sediments. Microb. Ecol. 1:1219-1233. 7. Livingston, R. J., P. S. SherIdan, N. G. McClane, F. G. Lewis m, and G. G. KobylHnski. 1977. The biota of Apalachicola Bay system: functional relationships, p. 75100. In R. J. Livingston and E. A. Joyce (ed.), Proceedings of the conference on the Apalachicola drainage system. Publication no. 26, Florida Department of Natural Resources, Marine Research Laboratory, Tallahassee, Fla. 8. Kates, M. 1964. Bacterial lipids. Adv. Lipid Res. 2:17-90. 9. Kates, M. 1977. Techniques of lipidology: isolation, analysis and identification of lipids. Elsevier-North Holland Publishing Co., New York. 10. Mendenhall, W. 1967. An introduction to linear models and the design and analysis of experiments. Wadsworth Publishing Co., Belmont, Calif. 11. Montagna, P. A. 1982. Sampling design and enumeration statistics for bacteria extracted from marine sediments. Appl. Environ. Microbiol. 43:1366-1372. 12. NickeLs, J. S., J. H. Parker, R. J. Bobble, R. F. Martz, D. F. Lott, P. H. Benson, and D. C. White. 1981. Effect of cleaning with flow-driven brushes on the biomass and community composition on the marine microfouling film on aluminium and titanium surfaces. Int. Biodeterioration Bull. 17:87-94. 13. White, D. C., R. J. Bobbie, J. D. King, J. S. Nickels, and P. Amoe. 1979. Lipid analysis of sediments for microbial biomass and community structure, p. 87-103. In C. D. Litchfield and P. L. Seyfried (ed.), Methodology for biomass determinations and microbial activities in sediments. Publication no. ASTM STP 673, American Society for Testing and Materials, Philadelphia. 14. White, D. C., W. M. Davis, J. S. Nickels, J. D. King, and R. J. Bobbie. 1979. Determination of the sedimentary microbial biomass by extractible lipid phosphate. Oecologia 40:51-62.