881
Ann. For. Sci. 62 (2005) 881–888 © INRA, EDP Sciences, 2005 DOI: 10.1051/forest:2005079
Original article
Biomass and composition of understory vegetation and the forest floor carbon stock across Siberian larch and mountain birch chronosequences in Iceland Bjarni D. SIGURDSSONa, Borgthor MAGNUSSONb, Asrun ELMARSDOTTIRb, Brynhildur BJARNADOTTIRa,c a
Icelandic Forest Research, Mogilsa, 116 Reykjavik, Iceland Icelandic Institute of Natural History, Reykjavik, Iceland c Department of Physical Geography and Ecosystem Analysis, Lund University, Sweden b
(Received 20 August 2004; accepted 27 May 2005)
Abstract – Changes in understory biomass, forest floor carbon (C) stock and vegetation composition were studied in six age-classes of Siberian larch (Larix sibirica) and two age-classes of native birch (Betula pubescens) in Iceland. The ground vegetation was less in the larch during the thicket stage and in the old-growth birch compared to a treeless pasture. Understory biomass was strongly related to canopy gap fraction across forest stands (P < 0.001), but not to soil pH or soil C/N ratio. Increased mass of dead wood and alterations in vegetation composition increased the forest floor C-stock of older forests. The forest floor had reached as high C-stock as the pasture’s ground vegetation in ca. 50 years in the managed larch plantations and in ca. hundred years in the unmanaged birch forest. This study clearly shows the importance of which time-step is used when changes in forest floor C-stocks are computed for afforestation areas. Betula pubescens / carbon sequestration / woody debris / Larix sibirica / understory Résumé – Biomasse et composition de la végétation de sous-bois, et stock de carbone du sol dans une chronoséquence de mélèze de Sibérie et de bouleau pubescent en Islande. Nous avons étudié en Islande les modifications de biomasse, de composition floristique, et de stock de carbone en sous bois dans des peuplements de mélèze de Sibérie correspondant à 6 classes d’âge, et dans des peuplements de bouleau pubescent correspondant à deux classes d’âge. En comparaison avec une pâture non boisée, la végétation au sol était moins développée dans le peuplement de mélèze au stade gaulis et dans celui de bouleau mature. La biomasse au sol était fortement corrélée à la fraction de trouées dans l’ensemble des peuplements (p < 0,001) mais ni au pH du sol ou au rapport C/N. Une quantité croissante de bois mort et des changements dans la composition floristique étaient à l’origine de la croissance des stocks de carbone au sol dans les peuplement âgés. La surface du sol était aussi riche en carbone que la végétation d’une pâture dès l’âge de 50 ans dans les plantations gérées de mélèze atteignant 50 ans environ et dans des peuplements spontanés de bouleau à 100 ans. Cette étude montre clairement l’importance du choix du pas de temps pour l’estimation des stocks de carbone au sol de peuplements forestiers. séquestration de carbone / débris ligneux / sous-bois
1. INTRODUCTION Iceland has only four native tree species, which are all deciduous. Of those, only mountain birch (Betula pubescens) forms extensive woodlands. Other tree species that are associated with the birch are tea-leaved willow (Salix phylicifolia), mountain ash (Sorbus aucuparia) and aspen (Populus tremula). The lack of native coniferous trees has been explained by a relative isolation in the middle of the N-Atlantic Ocean, which was an obstacle to colonization after last Ice Age [6, 31]. In 1899 the first coniferous plantation was established in Iceland with pine seedlings of different species (Pinus spp.). The first Siberian larch stand (Larix sibirica) was established in 1938 [5], but it is now the most planted coniferous species in Iceland.
Afforestation of treeless landscapes causes a net carbon (C) sequestration in biomass [12, 30, 34, 36]. This phenomenon was recently highlighted by the appearance of the Kyoto-protocol [35]. It allows industrialised countries to account for the C stored following afforestation since 1990 in their budget of national greenhouse gases [13, 35]. Increasing C-storage in biomass, and possibly soil, is an important part of Iceland’s climate strategy [16]. According to IPCC’s Good Practice Guidance [13], it is not enough to only monitor increases in C-stock of standing tree biomass, but changes in soil organic matter, litter, ground vegetation and dead wood should also be estimated. These additional C-stocks can, however, be excluded if scientific evidence shows that there is not a net loss of carbon from those [13]. In the present study we concentrated on the last two
* Corresponding author:
[email protected]
Article published by EDP Sciences and available at http://www.edpsciences.org/forest or http://dx.doi.org/10.1051/forest:2005079
882
B.D. Sigurdsson et al.
C-stocks, vegetation and dead wood, since no scientific information existed about the temporal changes of those in our forest ecosystems. The present extent of afforestation in Iceland is about five million seedlings per annum, where of the Siberian larch and the native birch account for ca. 60% in similar proportions [22]. In the most recent forestry-related legislation the future goal is set to increase woodland and forest cover to at least 5% of the lowland surface area during the next 40 years [2], which will double the present woodland cover. Future plans for large-scale afforestation have been criticised by their effects on soil properties and biodiversity of ground vegetation and animal life [33]. The effect of afforestation on the abundance and composition of the ground vegetation has not been studied extensively in Iceland. There are only a few studies that have touched upon these questions in plantations with exotic species [18, 24, 25, 28, 30]. There is also a limited knowledge about the ground vegetation in the native birch woodlands [3, 7, 10, 23, 25, 30, 31]. The present study was a part of a larger project named ICEWOODS and a Nordic Centre of Excellence, NECC, where the effects of afforestation on biodiversity and ecosystem function were studied [8, 26]. The specific goals of the present study were to quantify the long-term effects of the two most commonly used tree species in afforestation programs in Iceland on understory biomass, forest floor C-stock and vegetation composition (based on broad growth forms). 2. MATERIALS AND METHODS
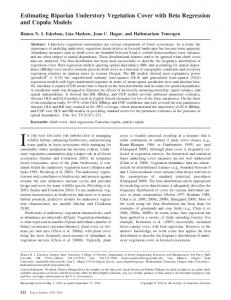
Figure 1. Location of the study sites in eastern Iceland. The treeless control site is denoted M, the planted larch age-sequence L0-L5 and the native birch age-sequence B1-B2. See Table I for further description of different forest stands.
2.1. Field sites and experimental set-up A chronosequence study was carried out in eastern Iceland, between 65° 06’–65° 19’ N and 14° 56’–14° 82’ W and ca. 60–90 m a.s.l. (Fig. 1). The area contains Iceland’s largest remains of the native mountain birch woodland, Hallormsstadarskogur. At present, the area is a mixture of treeless pastures used for sheep grazing, mature mountain birch forest and younger birch stands that have regenerated naturally where fencing has provided protection from grazing. Also, there are some planted forests of introduced species, mainly Siberian larch, established by the Iceland Forest Service in the 20th century. The mean annual temperature (1961–1990) of a synoptic station at Hallormsstaður is 3.4 °C and mean annual precipitation is 738 mm (The Icelandic Meteorological Office, pers. comm.). The mean 24-h temperature varies between 10.2 °C in July to –1.6 °C in January and mean maximum daytime temperatures are 12.4, 14.1 and 13.4 °C in June, July and August, respectively. A chronosequence is a common way to evaluate the effects of landuse change on ecosystems (e.g., [34, 36]). Often this method offers the only practical way to study changes that may take decades or even centuries to occur. It is, however, rarely possible to find sites that are comparable in all ways except age, and this problem usually increases with the size of the study area and the time that the chronosequence is expected to capture. In the present study, two native birch and six managed Siberian larch forests of different age, as well as grazed open pasture on comparable land, were selected within a relatively small and homogenous area (Fig. 1). All age-classes had more than 4 ha of forest or pasture cover, except L4 (Tab. I). The largest age-class covered ca. 60 ha. To get comparable conditions, as large areas as possible were selected and five to eight randomly placed 100 m2 main-plots were used as sample replicate within each age-class of forest or pasture.
All the stands were growing on the same soil type, andosol [4]. The larch stands and the younger birch stand were grazed heathland pastures prior to afforestation. The area containing the older birch stand (B2) and the oldest larch stand (L5) was protected from livestock grazing in 1905–1907. At that time, L5 was a treeless pasture [19], but had partly been colonised by native birch when it was planted by Siberian larch in 1952 (S. Blondal, pers. comm.). L5 had been thinned ca. 10 years before measurements took place. The older birch forest, B2, was already in place when the area was protected, and is one of few remains of the ancient birch woodlands that are believed to have covered as much as 25% of Iceland’s surface at the time of settlement in the 9th century AD (e.g., [31]). All sites, except B2, were probably deforested a few hundred years after human settlement in Iceland.
2.2. Sampling scheme and measurements Sampling was carried out in early August 2002, except at L0, which was sampled in early August 2003. Five 2 × 50 m main-plots were established at random locations at each site, except at L0, where eight main-plots were established. A 33 × 50 cm subplot was placed at four random locations within each main-plot, except in L0, where five locations were sampled per main-plot. Forest floor compartment is defined as the sum of the woody debris above the litter layer and the aboveground part of the understory vegetation. On each subplot, all living plants < 1.3 m in height and all woody debris (dead twigs) above the litter layer were collected. In addition, coarse woody debris (> 2 cm diameter) found on the main-plot was recorded and its mass estimated from its volume. The samples were stored in sealed plastic bags at –18 °C until further processing took place.
VC
Heath
Birch
Birch
Larch
Larch
Larch
Larch
Larch
Larch
A
M
B1
B2
L0
L1
L2
L3
L4
L5
7.3
3.2
9.5
7.2
4.6
60.4
6.1
5.1
7.4
Area ha
1952
1966
1983
1984
1990
1992
< 1905
> 1979
–
Estab.
50
36
20
19
12
10
97
22
–
Age years
17.1 ± 1.0
14.5 ± 1.0
15.0 ± 0.7
14.6 ± 0.6
14.8 ± 0.5
–
17.7 ± 1.0
15.5 ± 0.5
14.1 ± 0.7
C:N ratio
6.9 ± 0.1
6.6 ± 0.1
6.9 ± 0.0
6.7 ± 0.1
7.1 ± 0.0
–
6.6 ± 0.1
6.8 ± 0.1
7.1 ± 0.1
pH
1120 ± 97
2220 ± 287
2300 ± 202
3066 ± 392
2280 ± 265
2338 ± 173
2667 ± 633
2200 ± 153
–
DS No. ha–1
0.0
0.1 ± 0.1
0.1 ± 0.0
0.1 ± 0.0
0.1 ± 0.0
0.0
3.4 ± 0.6
2.7 ± 0.5
–
NS No. tree–1
14.7 ± 0.5
10.4 ± 0.1
6.8 ± 0.2
6.5 ± 0.3
3.9 ± 0.3
2.4 ± 0.2
7.8 ± 0.2
3.4 ± 0.2
–
Hd m
19.2 ± 0.6
12.3 ± 1.6
6.8 ± 0.3
6.6 ± 0.4
2.5 ± 0.4
0.9 ± 0.2
5.7 ± 0.3
1.5 ± 0.4
–
DBH cm
34.1 ± 2.5
33.4 ± 2.3
11.6 ± 1.4
13.2 ± 1.8
1.8 ± 0.6
0.3 ± 0.1
17.1 ± 1.9
1.4 ± 0.6
–
BA m2 ha–1
Table I. Short description of the eight study sites in the ICEWOODS project in eastern Iceland. A = Abbreviation, VC = Vegetation class, Estab. = Year of plantation (larch) or protection from sheep grazing (birch), C:N ratio = Carbon:Nitrogen ratio of mineral soil at 10–30 cm depth, pH = acidity of mineral soil at 10–30 cm depth, DS = Stand density of dominant species, NS = Number of secondary stems, Hd = Mean dominant height, DBH = Main stem mean diameter at breast height (1.3 m) of the dominant species, BA = Basal area of all trees at DBH. Mean ± SE, n = 5–8.
Effects of afforestation on ground vegetation 883
884
B.D. Sigurdsson et al.
Each sample, except for L0 and L2, was divided into five different growth forms or classes: (a) bryophytes, (b) pteridophytes (seedless vascular plants), (c) monocots, (d) dicots and (e) dead twigs (< 2 cm diameter). Different classes from each main-plot were dried separately at 80 °C for 48 h and weighed. For L0 and L2 bulk vegetation samples from each main-plot were dried and weighed.
2.3. Soil sampling and analysis A soil corer was used to sample mineral soil (10–30 cm) from the harvest sub-plots (20 samples per site and depth). Samples were dried at 80 °C for 48 h and analysed at the Centre of Chemical Analyses (Efnagreiningar Keldnaholti), ICETEC, Reykjavik, Iceland. Total N was analysed by Kjeldahl wet combustion on Tecator Kjeltec Auto 1030 Analyzer. Total C was analysed by dry combustion on Leco CR12 Carbon Analyzer and the soil pH was measured by an electrode (Orion model 920 A) in a soil/water mixture of 1:1.
2.4. Canopy gap fraction Gap fraction of overstory trees was measured with a pair of LAI2000 Plant Canopy Analyzers (LI-COR Inc., Lincoln, Nebraska) in early August. One instrument was placed in a clearing and the other was used to take readings of sky brightness every 2 m along each 50 m main-plot in all the forest age-classes (n = 5–8). Measurements were made during an overcast day, sensor heads always faced north and a 180° lens cap was used.
Figure 2. (a) Mass (g DM m–2) of ground vegetation at a treeless pasture (M, cross-hatched bar) and along a chronosequence of native birch (B, grey bars) and managed larch plantations (L, black bars) in eastern Iceland. (b) Dead twigs above the actual litter layer and coarse woody debris. See Table I for further description. Bars indicate average values (S.E.) of n = 5.
2.5. Conversion of dry mass to carbon content Carbon concentration of different understory classes was determined in an earlier study [29, 30], where dry mass C-fraction of bryophytes was 31%, grasses, forbs and horsetails 40%, dwarf shrubs 49%, dead twigs 50% and trees 51%. These concentrations were used to convert the measured biomass and dead mass components to Cstock in the current study.
2.6. Statistical analysis Regression analysis was used to study the relationship between gap fraction and ground vegetation biomass and gap fraction and vegetation composition (SAS system 9.1.3, SAS Institute Inc., Cary, NC, USA).
3. RESULTS 3.1. Forest characteristics Forest characteristics, such as stand density, dominant height, mean diameter at breast height (DBH) and basal area (BA), are shown in Table I. Both managed Siberian larch forests and unmanaged birch forests had similar stand densities, except the thinned L5, which had lower stand density than the rest. The two birch forests had more secondary stems than the larch forests. DBH and BA were not much different between the youngest forests (B1, L0 and L1) or the two middle-aged larch forests (L2 and L3). B2 had similar DBH and BA as L2, but L4 and L5 had higher DBH and BA than the rest. Dominant height showed similar trends (Tab. I). 3.2. Chemical properties The mineral soil C:N ratio generally increased with forest age (Tab. I). Both the oldest larch and birch forests had higher
C:N ratio than the pasture and the younger forests (Tab. I). The pH of the mineral soil ranged between 6.6 and 7.1. The pasture, L1 and L5 were not much different and had the highest pH. The old birch forest (B2), L2 and L4 had the lowest pH (Tab. I). 3.3. Biomass of ground vegetation The biomass of ground vegetation of the treeless pasture did not differ much from the two youngest larch forests (L0, L1; Fig. 2a). The ground vegetation in the three middle-aged larch forests (18–37 years) was only 20–37% that of the pasture. These forests had similar stocking as the young larch forests, but their dominant height and BA was higher (Tab. I). In the 50 year old, thinned, larch forest (L5) the biomass of ground vegetation did not differ much from the pasture, L0 nor L1. The unmanaged birch stands showed a negative trend in ground vegetation biomass with forest age, increasing dominant height, DBH and basal area (Fig. 2a and Tab. I). 3.4. Canopy gap fraction and ground vegetation There was a strong relationship between the biomass of the ground vegetation and the measured tree canopy gap fraction of different unthinned sites (r2 = 0.68, Fig. 3), and there was no significant difference between birch and larch forests in this respect. The already thinned L5 did, however, not fall on the same line as the other sites, and was subsequently excluded from the analysis. When the youngest larch stand (most recently grazed) and the grazed pasture (L0 and M) were excluded, the relationship became even stronger, with 89% of the variability in the ground vegetation biomass across birch and larch forests explained by the change in canopy gap fraction (data not shown).
Effects of afforestation on ground vegetation
885
3.6. Ground vegetation composition
Figure 3. The relationship between ground vegetation biomass and forest gap fraction in treeless pasture (square), larch plantations (triangles) and birch woodlands (circles) of different age. The thinned L5 stand was not included in the correlation analysis. Error bars indicate S.E. of n = 5 or 8.
The ground vegetation composition, here described with different growth forms, changed as an area was protected from grazing and turned into managed larch forest or unmanaged birch woodland (Fig. 4). Bryophytes (mosses) decreased significantly as larch or birch forests became older and darker (Tab. II). The relative quantity of pteridophytes, notably the horsetail (Equisetum pratense) and monocots (grasses and sedges), increased significantly (P < 0.009) as the gap fraction decreased in the larch forests (Tab. II). The thinning of L5 had, however, apparently reversed many of the changes observed in the darkest larch forests. The proportion of bryophytes increased and fraction of monocots and pteridotphytes was reduced in L5 compared to L4 (Fig. 4). A similar reduction in bryophytes and monocots was observed in the birch forests as in the larch plantations. The main difference between the two forest types was the dominance of dicots in the ground flora of the birch forests (Fig. 4). 3.7. Carbon stocks of the forest floor
3.5. Mass of dead twigs and coarse woody debris As the forests became older the amount of dead twigs lying on the forest floor increased. In B1 and B2 this added 11% and 51% to the ground vegetation biomass. Similarly, the increase was 8%, 97%, and 71% in the 18, 37 and 50 year old larch forests, respectively (Fig. 2b). Fallen dead trees and coarser branches (CWD, > 2 cm diameter) added 70% to the mass of ground vegetation and dead twigs in B2, 398% in L4, but only 4% in the thinned L5. In L5, naturally fallen trees had been removed at thinning ca. 10 years earlier and most of the thinning residuals had been overgrown by litter and ground vegetation, so relatively little CWD was recorded there (Fig. 2b).
Changes in plant growth forms altered the relationship between C-stock and forest age, compared to what was observed between age and biomass (Figs. 2a and 5). Ground vegetation in the managed forests accumulated carbon first after protection from grazing and afforestation, but as soon as the forest approached canopy closure there was a net loss of carbon from this compartment (Fig. 5). However, after ca. 50– 60% thinning (to 1 100 trees ha–1) the C-stock in ground vegetation of L5 had increased again and there was a net gain of carbon in this compartment compared to the treeless pasture (Fig. 5). The increasing C-stock in dead twigs, fallen branches and trees (CWD) resulted in an accumulation of 8.3 g C m–2 yr–1 over the 50 years in the larch plantations (Fig. 5). The same compartments in the unmanaged birch forest accumulated
Figure 4. The relative proportions of four different ground vegetation classes along a chronosequence of (a) larch and (b) birch stands in eastern Iceland. The reference (age 0) is the treeless pasture (M), which is comparable to land before forest establishment. The classes were dicots (D), monocots (M) pteridophytes (P) and bryophytes (B), which are indicated by different patterns within bars. Each bar is an average from 20 subplots within each site.
886
B.D. Sigurdsson et al.
Table II. Results from a regression analysis across the eight study sites in the ICEWOODS project in eastern Iceland on the relationship between tree canopy gap fraction and relative species composition. Data are shown in Figure 4. Main plot averages from each age-class were used for the regression analysis (n = 5–8). Monocots
Dicots
–0.40
0.08
Pteridophytes Bryophytes
All data Slope
–0.22
0.53
Intercept
0.33
0.33
0.16
0.18
R2
0.29
0.01
0.20
0.27
< 0.001
0.62
0.004
< 0.001
–0.75
0.55
–0.43
0.63
ANOVA All forests Slope Intercept
0.41
0.22
0.21
0.16
R2
0.34
0.10
0.25
0.14
< 0.001
0.07
0.002
0.03
Slope
–0.88
0.53
–0.55
0.89
Intercept
0.51
0.05
0.28
0.15
R2
0.42
0.19
0.32
0.25
ANOVA
0.002
0.05
0.009
0.03
ANOVA Larch forests
4. DISCUSSION 4.1. Effects of afforestation on the ground vegetation biomass and composition Both larch and the native birch caused a decline in the ground vegetation biomass of an open heathland pasture after canopy closure (Fig. 2). The decline was more pronounced under the ca. 20 year old larch stands than under birch at same age (L2 and L3 vs. B1). The birch was, however, more slow-growing than the larch, and had not reached the same stage in the stand development (the thicket stage, cf. [21]) and dominant height was ca. 50% less for the birch at that age (Tab. I). During the thicket stage, pteridophytes and monocots became co-dominant in the ground vegetation under the larch stands, and bryophytes and dicots were reduced (Fig. 4 and Tab. II). Similar temporal shifts towards pteridophytes during the thicket stage were observed when heathlands were afforested by coniferous trees in Britain [21]. 4.2. Why does the ground vegetation biomass change?
1.1 g C m–2 yr–1 over ca. 100 years (Fig. 5). The dead compartments, fallen twigs, branches and trees, had relatively smaller effect on the C-balance in the native forest than in the managed forest (Fig. 5).
Changes in ground vegetation biomass have most often been linked to competition with the overstory trees for light, soil water or nutrients [1]. Among those environmental factors, light obstruction by tree canopy has been shown to be the main driving factor in most northern forest ecosystems [9, 17, 21, 32]. All those authors recognise that more open canopy (less shade) leads to both increased ground vegetation biomass and diversity. The light availability at ground level, measured as canopy gap fraction, was the factor that correlated best with the
Figure 5. The annual change in forest floor carbon stock (ground vegetation, dead twigs and coarse woody debris) following natural regeneration by birch or afforestation by larch in eastern Iceland. The reference (age 0) was a treeless pasture, which was comparable to the land used for afforestation. Coarse woody debris found in L4 was added to the stock found at L5, where it had been manually removed at thinning ca. 10 years earlier.
Effects of afforestation on ground vegetation
observed changes in ground vegetation biomass and composition in the present study (Fig. 3 and Tab. II). Gonzalez-Hernandez et al. [11] also found canopy gap fraction to give the best correlation with ground vegetation biomass in Galician woodlands. There does not seem to be any difference between the native unmanaged birch forest and the unthinned larch plantations in the observed relationship between canopy gap fraction and ground vegetation biomass (Fig. 3). The oldest Siberian larch forest had been thinned ca. 10 years earlier and still had higher gap fraction than the middle-aged unthinned larch forests. It also had more biomass stored in ground vegetation than the younger forests (Figs. 2 and 3). We conclude that it is the shade, not a change in the soil chemistry (Tabs. I and II), which drives the changes in ground vegetation in the coniferous plantations in eastern Iceland. 4.3. Forest management and ground vegetation composition Forest management and canopy development is known to influence ground vegetation biomass and species composition [17, 20]. In Iceland it is common practice to plant larch at a density of 2 500 to 4 000 seedlings per hectare [5]. This is a much higher planting density than is usually found in larch plantations in e.g. Sweden or Finland, where it is customary to plant ca. 1 600 seedlings per hectare [15]. With the high initial densities, canopy closure usually occurs in about 15 years, followed by the first thinning at age of ca. 30 years and with at least two additional thinnings during a rotation of 80–120 years [5]. The stand density at final harvest should be 400–600 trees per hectare [5]. It is noteworthy that changing the planting density to what is customary in commercial larch plantations in Scandinavia, and with proper thinning regime, the temporal negative effects on the ground flora could be largely avoided. This should at least be considered where recreation and maintenance of biodiversity are among the goals of an afforestation program.
887
4.5. Carbon balance of ground vegetation and dead wood The present study clearly shows the importance of which time-step is used when changes in ground vegetation C-stock are reported (Fig. 5). When the time-step was 10 years, the Cstock in ground vegetation increased following afforestation by as much as 6.4 g C m–2 yr–1, probably because of more plant biomass accumulated following protection from sheep grazing. When the time-step was 20 years, both managed and unmanaged forests lost 5–7 g C m–2 yr–1 (included their thicket stage). As both forest types grew older, the C-stock in ground vegetation approached or exceeded the amount observed in the treeless heathland pasture (Fig. 5). For the managed larch forest this happened sooner because of mechanical thinning (ca. 40 years), but for the unmanaged birch forest this may take longer time. Dead twigs and coarse woody debris are important for the C-balance of the forest floor in both forest types, but do not change the temporary reduction during the thicket stage (Fig. 5). The forest floor C-stock in CWD, amounted to 37 and 103 g C m–2 in B2 and the oldest unthinned larch forest (L4), respectively. These stock values are relatively low compared to Russian boreal forests, where the regional average CWDstocks are 100–700 g C m–2 [14]. This ecosystem component is often an important C-stock in boreal forest ecosystems, but generally missing in national inventory data [12, 13]. Acknowledgements: This project was funded by the Icelandic Research Council (RANNIS) and the Icelandic Agricultural Productivity Fund, as a part of a larger research project, ICEWOODS and a Nordic centre of excellence, NECC (www.necc.nu). We would like to thank Lárus Heidarsson, Inga Dagmar Karlsdóttir, Erla Guðjónsdóttir, Anna Kristín Björnsdóttir and the staff of the Hallormsstadur Forest Service station for helping in the field and in the laboratory and to Bjarki Th. Kjartansson for making the site map.
REFERENCES 4.4. C-stock on forest floor compared to soil C-stock The forest floor above the actual litter layer consists of living vegetation, dead twigs and coarse woody debris. All these compartments have C-stocks that change through the forest succession (Fig. 5). The C-stock in ground vegetation varied between 40–260 g C m–2 in the managed larch forests and between 90 and 180 g C m–2 in the unmanaged birch forest, and it was 190 g C m–2 in the treeless pasture (Fig. 5). Dead twigs and coarse woody debris added 110 and 270 g C m–2 to the forest floor Cstock in B2 and L5, respectively. The observed forest floor Cstock values were low compared to published values for soil C-stocks in the area. A near-by treeless pasture and a 32-yearold Siberian larch forest contained 760 and 840 g C m–2 in the top 30 cm in the soil and another 80 and 250 g C m–2 in fine and coarse roots, respectively [30]. Hence, the forest floor Cstock, presented here, only was at maximum ca. 7% of the Cstock in soil. The relative size of this compartment is also only ca. 5–10% compared to C-stock in living trees in 30–50 year old larch and birch forests [30]. Never the less, it is important to include the changes in this compartment when site carbon balance is estimated [12, 13, 30].
[1] Anderson L.J., Brumbaugh M.S., Jackson R.B., Water and treeunderstory interactions: a natural experiment in a savanna with oak wilt, Ecology 82 (2001) 33–49. [2] Anonymous, Log um andshlutabundin skograektarverkefni (Laws on Regional Afforestation Programs), 1999, 4 p. (in Icelandic). [3] Aradottir A.L., Thorsteinsson I., Sigurdsson S., Distribution and characteristics of birch woodlands in north Iceland, in: Wielgolaski F.E. (Ed.), Nordic Mountain Birch Ecosystems, Paris & The Parthenon Publishing Group, New York, London, 2001, pp. 51–61. [4] Arnalds O., Hallmark C.T., Wilding L.P., Andisols from four different regions of Iceland, Soil Sci. 59 (1995) 161–169. [5] Blondal S., Snorrason A., The role of Larix in Icelandic forestry, in: Proceedings from a Symposium on Ecology and Management of Larix Forests. General Technical Report INT, INT-GTR-319, 1995, pp. 220–226. [6] Bradshaw R.H.W., The origins and dynamics of native forest ecosystems: background to the use of exotic species in forestry, Icel. Agric. Sci. 9 (1995) 7–15. [7] Einarsson E., Grimstorfa. Arsrit Skograektarfelags Islands, 1979, pp. 9–12 (in Icelandic). [8] Elmarsdottir A., Sigurdsson B.D., Halldorsson G., Nielsen O.K., Magnusson B., Ahrif skograektar á lifrikid (Effects of afforestation
888
B.D. Sigurdsson et al.
on the biosphere), in: Proceedings from Radunautafundur, 2003, pp. 107–111 (in Icelandic).
[22] Petursson J.G., Skograektarstarfid arid 2000. Tolulegar upplysingar, Skograektarritid, 2 (2002) 82–84 (in Icelandic).
[9] Engelmark O., Sjöberg K., Andersson B., Rosvall O., Ågren G.I., Baker W.L., Barklund P., Björkman C., Despain D.G., Elfving B., Ennos R.A., Karlman M., Knecht M.F., Knight D.H., Ledgard N.J., Lindelöw Å., Nilsson C., Peterken G.F., Sörlin S., Sykes M.T., Ecological effects and management aspects of an exotic tree species: the case of lodgepole pine in Sweden, For. Ecol. Manage. 141 (2001) 3–13.
[23] Ragnarsson H., Steindorsson S., Grodurrannsoknir i Hallormsstadaskogi (Investigation on the Vegetation of Hallormstada Forest), Arsrit Skograektarfelags Islands, 1963, pp. 32–59 (in Icelandic, English summary).
[10] Glawion R., Progressive und regressive Sukzessionen des isländischen Birkenwaldes. Berichte aus der Forschungsstelle Nedri As Hveragerði (Island), 47, 1986, 53 p. (in German, English summary). [11] Gonzalez-Hernandez M.P., Silva-Pando F.J., Casal-Jimenez M., Production patterns of understory layers in several Galician (NW Spain) woodlands: seasonality, net productivity and renewal rates, For. Ecol. Manage. 109 (1998) 251–259. [12] IPCC (Intergovernmental Panel on Climate Change), Special Report on Land Use, Land Use Change and Forestry, Cambridge University Press, Cambridge, UK, 2000, 377 p. [13] IPCC, Good Practice Guidance for Land Use, Land-Use Change and Forestry, IPCC National Greenhouse Gas Inventories Programme, Institute for Global Environmental Strategies, Kanagawa, Japan, 2003, 694 p. [14] Krankina O.N., Harmon M.E., Kukuev Y.A., Treyfeld R.F., Kashpor N.N., Kresnov V.G., Skudin V.M., Protasov N.A., Yatskov M., Spycher G., Povarov E.D., Coarse woody debris in forest regions of Russia, Can. J. For. Res. 32 (2002) 768–778. [15] Martinsson O., Lärken - ett specialträdslag, Skogsbruket 10 (2001) 10–11 (in Swedish). [16] Ministry for the Environment, Stefnumotun Rikisstjornar Islands um radstafanir til að standa við skuldbindingar loftslagssamningsins og Kyoto-bokunarinnar, Umhverfisraduneytid, Reykjavik, 2003, 5 p. (in Icelandic). [17] Nygaard P.H., Ødegaard T., Sixty years of vegetation dynamics in a south boreal coniferous forest in southern Norway, J. Veg. Sci. 10 (1999) 5–16. [18] Oskarsson U., Framvinda grodurs, jardvegs og jardvegsdyra i ungum lerkiskogum i nagrenni Hallormsstadar (Succession of vegetation, soil and soil invertebrates in young larch plantations [Larix Mills]), Arsrit Skograektarfelags Islands,1984, pp. 32–44 (in Icelandic, English summary). [19] Palsson G., Hallormsstadur og Hallormsstadaskogur. 25 ara minningarrit Skograektarinnar, Skograekt rikisins, Reykjavik, 1931, 83 p. (in Icelandic). [20] Peek J.M., Korol J.J., Gay D., Hershey T., Overstory-understory biomass changes over a 35-year period in southcentral Oregon, For. Ecol. Manage. 150 (2001) 267–277. [21] Peterken G.F., Ecological effects of introduced tree species in Britain, For. Ecol. Manage. 141 (2001) 31–42.
[24] Sigurjonsdottir S., Vegetasjons- og Jordsmonnutvikling i Lerkeskoger på Öst-Island. M.Sc. thesis, Institutt for skogfag, Norges landbrukshögskole, Ås, Norway, 1996, 55 p. (in Norwegian). [25] Sigurdardottir R., Effects of Different Forest Types on Total Ecosystem Carbon Sequestration in Hallormsstaður Forest, Eastern Iceland, Ph.D. thesis, Faculty of the Graduate School, Yale University, 2000, 193 p. [26] Sigurdsson B.D., Bjarnadottir B., Beinar maelingar a kolefnisbindingu skograektarsvaeda (Direct estimates of carbon sequestration by afforestation), Procedings from Fraedathing landbunadarins 2004, pp. 269–272 (in Icelandic). [27] Sigurdsson B.D., Snorrason A., Carbon sequestration by afforestation and revegetation as a means of limiting net-CO2 emissions in Iceland, Biotechnol. Agron. Soc. Environ. 4 (2000) 303–307. [28] Sigurdsson B.D., Aradottir A.L. Strachan I.B., Cover and canopy development of a newly established poplar plantation in south Iceland, Icel. Agric. Sci. 12 (1998) 35–46. [29] Snorrason A., Jonsson T.H., Svavarsdottir K., Gudbergsson G., Traustason T., Rannsoknir á kolefnisbindingu raektadra skoga á Islandi, Skograektarritid, 1 (2000) 71–89 (in Icelandic). [30] Snorrason A., Sigurdsson B.D., Gudbergsson G., Svavarsdottir K., Jonsson T.H., Carbon sequestration in forest plantations in Iceland, Icel. Agric. Sci. 15 (2002) 79–91. [31] Steindorsson S., Grodur a Islandi (Vegetation of Iceland) Almenna bokafelagid, Reykjavik, Iceland, 1964, 186 p. (in icelandic). [32] Stone W.E., Wolfe M.L., Responses of understory vegetation to variable tree mortality following a mountain pine beetle epidemic in lodgepole pine in Utah, Vegetatio 122 (1996) 1–12. [33] Thorhallsdottir T.E., Asynd landsins, Proceedings from Radanautafundur, 2001, pp. 77–85 (in Icelandic). [34] Trotter C., Tate K., Scott N., Townsend J., Wilde H., Lambie S., Maren M., Pinkney T., Afforestation/reforestation of New Zealand marginal pasture lands by indigenous shrublands: the potential for Kyoto forest sinks, Ann. For. Sci. 62 (2005) 865–871. [35] UNFCCC (United Nations Framework Convention on Climate Change), The Kyoto Protocol - to the Convention on Climate Change, UNEP/IUC/98/9, UNEP/IUC, Geneva Executive Center, Geneva, Switzerland, 1998, 34 p. [36] Zerva A., Mencuccini M., Carbon stock changes in a peaty gley soil profile after afforestation with Sitka spruce (Picea sitchensis), Ann. For. Sci. 62 (2005) 873–880.