Hindawi Publishing Corporation International Journal of Forestry Research Volume 2016, Article ID 5812043, 8 pages http://dx.doi.org/10.1155/2016/5812043
Research Article Biomass and Soil Carbon Stocks in Wet Montane Forest, Monteverde Region, Costa Rica: Assessments and Challenges for Quantifying Accumulation Rates Lawrence H. Tanner,1 Megan T. Wilckens,1 Morgan A. Nivison,1 and Katherine M. Johnson2,3 1
Environmental Science Systems, Le Moyne College, Syracuse, NY 13214, USA Monteverde Institute, Monteverde, Puntarenas, Costa Rica 3 Phinizy Center for Water Sciences, Augusta, GA 30906, USA 2
Correspondence should be addressed to Lawrence H. Tanner;
[email protected] Received 22 November 2015; Revised 31 January 2016; Accepted 10 February 2016 Academic Editor: Piermaria Corona Copyright © 2016 Lawrence H. Tanner et al. This is an open access article distributed under the Creative Commons Attribution License, which permits unrestricted use, distribution, and reproduction in any medium, provided the original work is properly cited. We measured carbon stocks at two forest reserves in the cloud forest region of Monteverde, comparing cleared land, experimental secondary forest plots, and mature forest at each location to assess the effectiveness of reforestation in sequestering biomass and soil carbon. The biomass carbon stock measured in the mature forest at the Monteverde Institute is similar to other measurements of mature tropical montane forest biomass carbon in Costa Rica. Local historical records and the distribution of large trees suggest a mature forest age of greater than 80 years. The forest at La Calandria lacks historical documentation, and dendrochronological dating is not applicable. However, based on the differences in tree size, above-ground biomass carbon, and soil carbon between the Monteverde Institute and La Calandria sites, we estimate an age difference of at least 30 years of the mature forests. Experimental secondary forest plots at both sites have accumulated biomass at lower than expected rates, suggesting local limiting factors, such as nutrient limitation. We find that soil carbon content is primarily a function of time and that altitudinal differences between the study sites do not play a role.
1. Introduction Modeling of the anthropogenic climate change anticipated in the coming decades requires a thorough understanding of the carbon cycle, in particular, the sources and sinks of carbon that are exchangeable on short (decadal) time scales and the rates of exchange. Multiple studies have estimated both the reservoirs and fluxes of carbon from terrestrial and marine reservoirs [1]. Tropical forests are major sinks for atmospheric carbon, accounting for as much as 37% of the terrestrial carbon sequestered in above-ground biomass and soil [2]. The Amazon forest alone, for example, is estimated to contain from 150 to 200 GtC in biomass and soil [3], equal to approximately one-quarter of the total atmospheric reservoir. Early studies of carbon cycling recognized the importance of
land-use changes, deforestation and afforestation in particular, and attendant fluctuations in the above-ground biomass carbon in contributing to variations in the atmospheric reservoir. Disturbance of tropical forests by land-use change and deforestation has been estimated to account for as much as 23% of anthropogenic carbon emissions [4]; most of these emissions (75%) were estimated to derive from the loss of above-ground biomass. Fewer studies have examined the potential changes in soil carbon that accompany land-use changes. Rhoades et al. [5], for example, estimated that conversion of tropical forest to pasture led to a decrease in soil carbon of 18% to 20%. More recently, Dieleman et al. [6] found the difference in soil carbon between mature tropical forest and pasture to be as much as 40%, but most of the difference was concentrated in
2 the top 10 to 15 cm. Unfortunately, our knowledge of carbon flux rates in tropical systems remains limited as various studies have produced contradictory results; for example, Hughes et al. [7] documented that the carbon stored in aboveground biomass increases predictably with the age of the forest but saw no significant change in soil carbon, a finding echoed by the study of Markewitz et al. [8] but contrary to the results of Bautista-Cruz and del Castillo [9]. Clearly, a more complete understanding of the rates of change of these carbon stocks will be required to track accurately the changes in the global carbon cycle. Additionally, predicting changes in the size of these carbon reservoirs in the future will demand knowledge of how these fluxes will vary as a response to ongoing and anticipated climate change. This study attempts to resolve some of the issues involved in the study of carbon flux rates in tropical forests. Specifically, by comparing the carbon stocks, both above-ground biomass (AGBcarbon ) and soil organic carbon, of maturedisturbed forest, experimental secondary forest plots, and cleared land at two forest reserves in the Monteverde cloud forest region, we attempt to resolve the apparent contradictory results in studies of changes in soil carbon with time. Furthermore, one of the challenges in assessing the effectiveness of reforestation at sequestering carbon in tropical forests is that many tropical tree species lack annual growth rings, making precise age measurements problematic in the absence of historical records [10]. We demonstrate herein that carbonstock data may be useful in approximating the age of tropical forests not otherwise documented.
2. Materials and Methods 2.1. Study Location. Much of Costa Rica’s mature forest was cleared during the twentieth century, primarily for agricultural land-use and timber. An estimated 106 hectares of forest were cleared just during the 1950s [11], and by 1983 only 26% of the original forest cover of the country remained [12]. Fortuitously, a significant portion of this land has been reforested in recent decades through government intervention, including establishment of an extensive national park system and payments to landowners for environmental services. Consequently, ca. 25% of the total land area of the country is now protected in some way and net forest area is now estimated to increase by ca. 35,000 ha per year [12]. In addition to enhanced ecosystem services (e.g., watershed and biodiversity protection), an important result of this change is that there are now numerous areas of secondary forest of varying age throughout the country available for examination of the rates of forest regrowth in secondary ecological succession. The Monteverde region is known for the cloud forests on the western slopes of the Cordillera de Tilar´an. Leeward cloud forests (sensu Lawton and Dryer [14]), are tropical montane evergreen forests that obtain significant moisture from fog drip. In Costa Rica, they occur on the Pacific-facing slopes of the Cordillera de Tilar´an where trade winds are forced above the lifting condensation point. The climate of the region is characterized by three seasons: a wet season from May to October; a transitional misty-windy season from
International Journal of Forestry Research
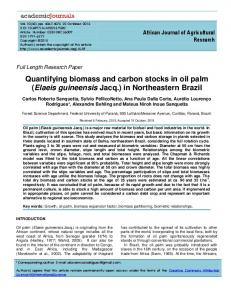
Figure 1: Location of the study area in the Monteverde region of Costa Rica. Sampling was conducted at the Monteverde Institute (MVI) and La Calandria (LC). Capitol city of San Jose shown in inset for reference, along with borders of Nicaragua (NC) and Panama (PN). Adapted from Google Earth® imagery (satellite image acquisition 03/2002).
November to January; and the dry season from February to April [14]. Even during the dry season, fog drip keeps the soils continuously moist. In the Monteverde region, these soils, which formed on rhyolites, are classed as Typic Dystrandepts [15]. The Monteverde Institute, a community-based research and educational endeavor that operates in collaboration with a consortium of scientific and educational institutions, is located ca. 2 km southeast of the center of the village of Santa Elena, Puntarenas Province (Figure 1). The Monteverde Institute (MVI) administers 15 hectares in cooperation with the Fundacion Conservacionista Costarricense, and is located within the ca. 9,000 hectare Monteverde Reserve complex. The land cover includes a mix of pasture, secondary forest plots of various ages, and mature forest at a mean elevation of ca. 1490 m in the lower cloud forest, or lower montane wet forest zone [16]. The climate at this location is characterized by a mean annual temperature (MAT) of 18.5∘ C and ca. 2500 mm mean annual precipitation (MAP) [17]. La Calandria is a private reserve including a lodge and biological field station currently administered by a local hotel (Pension Santa Elena), with conservation efforts coordinated by the Fundacion Conservacionista Costarricense. The reserve is located ca. 1.7 km southwest of the Santa Elena village center and consists of 27 hectares of mixed forest type, at a mean elevation of 1240 m in the premontane wet forest, or rain shadow forest zone [16]. There are no precise climatological data for this location, but based on an adiabatic lapse rate of 5.4∘ C km−1 [18], we estimate a MAT of 19.6∘ C. MAP at this elevation is estimated at 2100 to 2500 mm yr−1 [19]. In both areas, the mature forest is characterized by a discontinuous upper canopy, in which the taller trees are 15 m to 40 m tall, a well-developed sub-canopy, abundant vines and lianas, and epiphytes are common but not abundant [20]. Common species in the forest at the two sites include species include: multiple species of Cinnamomum, Ocotea and Persea; Hampea appendiculata, Citharexylum caudatum, Hasseltia floribunda, Roupala glaberrima and Viburnum costaricanum
International Journal of Forestry Research
3
Table 1: Summarized data for AGB calculations for Monteverde Institute (MVI) and La Calandria (LC). Measurements of stem dbh calculated as number of stems in size class per hectare. AGB for mature and secondary forest presented as oven-dried biomass calculated by equation of Brown [13] in units of metric tons (=Mg) per hectare (t ha−1 ). AGBcarbon is biomass carbon in t ha−1 . Site MVI LC
≥20 340 467
Mature dbh ≥50 160 100
AGB ≥70 60 0
Mature 457 ± 108 159 ± 23.7
(W. Haber and E. Cruz, pers. com.). Both locations exhibited similar numbers of trees per hectare and a mix of large diameter (>50 cm) upper canopy and smaller lower canopy and understory trees. The oldest forest stands are considered disturbed-mature forest indicating a period of uninterrupted growth of at least 30 years. The secondary forests in this study are experimental plots of mixed native species (listed below) planted in grids on cleared plots, with other species allowed to recolonize between the seedlings. Bordering the forests are clear-cut fields and lawns with densely rooted grasses. Grasscutting (of the lawns) and active grazing by livestock prevent reforestation. 2.2. Study Methods. The sampling and measurements were conducted during the dry season month of January, 2014. In each of the three sampling environments (mature forest, experimental secondary forest, grassy clearing) we established multiple 100 m2 (10 m by 10 m) sampling plots (locations recorded by GPS). At MVI, sampling was conducted for five 100 m2 plots for each land cover type. At La Calandria, each environment was represented by three 100 m2 plots. Above-ground biomass in each plot was recorded by measuring the breast-height diameter (dbh = 1.3 m above base) of all woody stems 1.0 cm or greater diameter (including vines and lianas), totaling ca. 100 stems per plot (=104 stems ha−1 ). To avoid error induced by uncertainty in height measurement, we calculated biomass with a height-independent algorithm developed by Brown [13] for broadleaf moist tropical forests; AGB = 𝑒(−2.134+2.53 ln(dbh)) . This equation (Eq. 3.2.4 of [13]) is particularly useful for the plots we sampled because it yields a high 𝑟2 over a wide range of stem diameters. The dbh data for each plot were divided into 5-cm size classes (1–5, 6–10, 11–15, etc.) and the AGB calculated for the midpoint of each class, multiplied by the number of stems in the class. The oven-dried biomass thus calculated was multiplied by 0.48 to convert to carbon weight [21]. The results for the plots for each environment type were averaged to calculate a mean AGBcarbon in units of metric tons of elemental carbon per hectare (tC ha−1 = Mg C ha−1 ). Within each 100 m2 plot, five soil cores were drilled, one at each corner and one in the center, to a depth of 30 cm using a hand auger with a 2-cm internal diameter. The characteristics (grain size and color using standard Munsell soil color designations) of the core were recorded and the core divided into 10-cm segments (0–10, 11–20, 21– 30). Bulk density was calculated from the oven-dried weight of a soil core cylinder of 1 cm diameter by 1 cm height. Aggregate samples from each of the sample intervals were
Secondary 5.2 ± 1.7 23.4 ± 10.2
AGBcarbon Mature Secondary 219.4 ± 51.8 2.5 ± 0.8 76.3 ± 11.3 11.2 ± 4.9
used to measure mean bulk density values for soils in the forest and clearing locations. In the laboratory, individual soil samples were dried, homogenized, sieved with a 2mm screen to remove larger rocks and root fragments, and the sub-2 mm fraction pulverized in a ball mill. From each processed sample, 0.1 to 0.125 g was drawn for analysis with a Leco TruSpec CN® by combustion in a pure O2 atmosphere at 950∘ C. The weight percent carbon was calculated from the composition of the evolved gases as measured by an infrared cell. Soil carbon stocks were calculated using values of 0.7, 0.75 and 0.8 g cm−3 for the 0–10, 11–20 and 21–30 cm intervals, respectively, in the forest soils, and 0.9, 0.95 and 1.0 g cm−3 for the same intervals in the clearings; these values are consistent with those found in other studies of lower montane forest soils [5]. The statistical significance of the differences in the biomass and soil carbon results between the three environments was tested by one-way ANOVA using SigmaStat software manufactured by Systat Software, Inc. Differences of significance were defined at the level of 𝑝 < 0.05.
3. Results and Discussion 3.1. Aboveground Biomass 3.1.1. Mature Forest. At both locations, the forest is characterized by a partially open upper canopy, and well-developed lower canopy and understory. The mean number of stems measured (dbh > 1 cm) was similar for both sites, although slightly higher at La Calandria, where the plots averaged 107 stems per 100 m2 , compared to MVI where we measured an average of 91 stems per plot. At MVI, the mature forest plots contained a mean of 1.6 trees with dbh > 50 cm, equivalent to 160 ha−1 , and 0.6 trees with dbh > 70 cm, or 60 ha−1 (Table 1). At La Calandria, the mature forest plots contained a mean of 1.0 trees per plot with dbh > 50 cm per plot, equivalent to 100 trees ha−1 , and no trees with dbh > 70 cm. If all trees of medium size (dbh > 20 cm) or larger size are considered, the MVI plots contained the equivalent of 340 trees ha−1 , compared to 467 ha−1 in the La Calandria plots. The number of taller trees (>20 m), estimated by inclinometer measurement. was greater at La Calandria where plots averaged almost five trees (ca. 500 ha−1 ) with height > 20 m, compared to an average of just over one tree (ca. 100 ha−1 ) per plot at MVI. The differences in AGB and AGBcarbon between MVI and La Calandria are significant (𝑝 < 0.05) for both mature and secondary forest sites (Table 1). The mature forest at
4
International Journal of Forestry Research
Table 2: Soil carbon data and carbon stocks for mature and secondary forest and clearings at Monteverde Institute (MVI) and La Calandria (LC), with mean Csoil % (first line) and soil carbon stock calculated as described in text in tC ha−1 (second line) for each 10 cm increment in soil for each site. Bottom line is total carbon stock (soil carbon plus AGBcarbon ) for each setting tC ha−1 . Interval
MVImature 20.5 ± 2.8 143.5 ± 19.6 13.0 ± 1.4 97.5 ± 10.5 7.7 ± 1.6 61.6 ± 12.8 302.6 ± 42.9 522.0 ± 94.7
0–10 10–20 20–30 Total Csoil Total C
LCmature 14.8 ± 1.3 103.6 ± 9.1 11.1 ± 0.8 83.3 ± 6.0 6.9 ± 0.9 55.2 ± 7.2 242.1 ± 22.3 318.4 ± 33.6
MVIsecondary 10.2 ± 1.2 71.4 ± 8.5 7.6 ± 2.4 57.0 ± 18 4.7 ± 0.5 37.6 ± 4.0 166.0 ± 30.5 168.5 ± 31.3
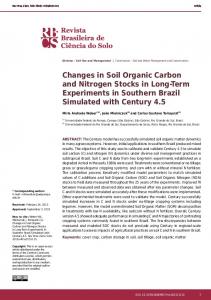
300 250
(tC ha−1 )
200 150 100 50 0
MVIm
MVIs
LCm MVIc Sample site
LCs
LCc
AGB Soil
Figure 2: Summary plot of carbon stocks measured in this study, expressed in tC ha−1 for both AGB and Csoil with bar for positive standard error. Locations indicated: MVIm = MVI mature forest; MVIs = MVI secondary forest; MVIc = MVI clearing; LCm = La Calandria mature forest; LCs = La Calandria secondary forest; and LCc = La Calandria clearing.
MVI holds an average AGB of 457 ± 108 t ha−1 (219.4 ± 51.8 tC ha−1 when converted to AGBcarbon ), compared to AGB of 159 ± 23.7 t ha−1 (76.3 ± 11.3 tC ha−1 ) at La Calandria (Table 1, Figure 2). The overall difference between these two sites is controlled by the greater abundance of trees with large diameters, due to the exponential relationship between tree diameter and mass. As reflected in the measures of standard error, the variation in AGB between individual plots was much greater at MVI, reflecting the uneven distribution of trunk diameters; that is, large (>50 cm) and very large (>70 cm) diameter trees are very unevenly distributed in the MVI plots compared to the more uniform distribution at La Calandria. 3.1.2. Secondary Forest. The plots studied here are experimental plots of seedling trees planted in a gridded pattern on cleared land that had been forested previously. Other vegetation was allowed to regrow between the planted trees resulting in dense ground layer vegetation. The MVI plots
LCsecondary 9.3 ± 0.7 65.0 ± 4.9 6.3 ± 0.8 47.4 ± 6.0 5.5 ± 0.5 44.0 ± 4.0 156.4 ± 11.0 167.6 ± 15.9
MVIclear 8.2 ± 1.4 73.8 ± 12.6 5.3 ± 1.4 50.4 ± 13.3 4.1 ± 0.2 41 ± 2.1 165.2 ± 27.9 165.2 ± 27.9
LCclear 7.0 ± 0.4 63.0 ± 3.6 5.5 ± 0.2 52.3 ± 1.9 5.3 ± 2.8 53.0 ± 3.0 168.3 ± 8.5 168.3 ± 8.5
were established in 2008 as the Rachel Crandell Preserve and measured for this study in 2014. The planted trees in the MVI plots included Ocotea monteverdensis, Ocotea whitei, Ocotea floribunda, Cinnamomum triplinerve and Citharexlum costaricanum. These had a maximum diameter of 6.5 cm (for an individual stem) and a maximum height of 5 m. Vegetation growing between the planted trees was generally 50 cm, and a consistent occurrence of trees with dbh > 70 cm [24]. Hence, the age of the MVI forest is very likely greater than the 50 years suggested by strict application of the accumulation rate of 4.9 tC ha−1 yr−1 [23], and potentially greater than 80 years. The difference in AGBcarbon in the mature forests at MVI and La Calandria is striking (219.4 tC ha−1 compared to 76.3 tC ha−1 ) and is clearly a function of forest age, as demonstrated by the difference in tree size. The age of the mature forest at La Calandria is unknown, but given the
6 frequency of trees with dbh > 50 cm, and the complete lack of trees with dbh > 70 cm, we can state unequivocally that it is younger than the MVI forest, although likely older than 50 years [24]. The younger age explains the lower frequency of large upper canopy trees at La Calandria, with a consequent more open canopy, and the greater frequency of medium size (dbh 20 to 50 cm) trees with greater height than at MVI. This does little to constrain the age of the La Calandria forest more precisely, however. If we arbitrarily accept a minimum age of 80 years for the mature forest at MVI, the resulting carbon accumulation rate is 2.75 tC ha−1 yr−1 . Applying this rate to the La Calandria data would suggest a forest age of only 30 years, which is inconsistent with the trunk diameters, as noted above [24]. However, various studies have noted that rates of biomass accumulation during reforestation can vary greatly depending on numerous factors, many related to previous land-use [25]. For example, a study by Uhl et al. [26] found that carbon accumulation rates on reforested pasture varied by more than an order of magnitude depending on the duration and intensity of grazing. As these factors may vary greatly on relatively small spatial scales, AGB accumulation rates from prior studies may not be useful for constraining forest age There is no ambiguity in regard to the age of the experimental secondary forest plots at the two locations. The plots at La Calandria contained 13-year-old trees at the time of measurement. Thus these plots were just over twice the age of the plots at MVI when measured but contained more than fourfold AGBcarbon . The MVI secondary plots accrued carbon at a mean rate of just over 0.4 tC ha−1 yr−1 through the first six years. By contrast, the La Calandria secondary plots added carbon at a mean rate of almost 0.9 tC ha−1 yr−1 . Both accumulation rates we measured in the secondary forests are much lower than those observed in previous studies of carbon accumulation in tropical secondary forests, for example, the aforementioned rate of 4.9 tC ha−1 yr−1 measured in Peruvian cloud forests [23], a rate of 5.5 tC ha−1 measured in the Amazonian Basin [27], or the hypothetical rate suggested above for the MVI mature forest of 2.75 tC ha−1 . We speculate, therefore, that reforestation on these plots is limited by some factor, such as nutrient availability, resulting from prior landuse [25], or nutrient limitation of the rhyolitic material. 3.3.2. Soil Carbon. The soil carbon stock at the MVI mature forest site is higher relative to the La Calandria mature forest (although not at the level of significance of 𝑝 < 0.05), with most of the difference in the upper 10 cm. The difference in soil carbon between the MVI and La Calandria mature forest sites might be expected, given the higher AGBcarbon and presumed greater forest age at MVI, if the premise of increasing Csoil with time is accepted. Bautista-Cruz and del Castillo [9] measured Csoil accumulation rate of 4.3 tC ha−1 yr−1 in the upper 20 cm during the initial years of secondary succession in a cloud forest in southern Mexico, while Silver et al. [28] measured an increase of just 1.3 tC ha−1 yr−1 in wet tropical secondary forests of the Amazon Basin. A lower rate, as found in the latter study [28], is more consistent with the observed
International Journal of Forestry Research difference between the MVI and La Calandria soils if the age assessment based on tree diameter is correct. As mentioned above, however, previous studies [7, 8] have shown little or no increase in soil carbon stocks during reforestation, contra the studies cited above. Schedlbauer and Kavanagh [29], for example, concluded from a study of secondary wet forests in Costa Rica that Csoil does not increase with age. Similarly, Martin et al. [2] found only a very weak relationship between soil carbon recovery and time in tropical secondary forests. Regardless of age, moreover, a higher soil carbon content might be expected at MVI due to its higher elevation and consequent higher moisture and lower temperature, both of which retard the decomposition of the soil organic matter, as noted by Dieleman et al. [6] and Salinas et al. [30]. We compared Csoil of the clearings and the secondary and mature forests at each location in an attempt to discern the dynamics of the soil carbon accumulation at both locations. We found Csoil from the clearings at MVI identical to the clearings at La Calandria. Furthermore, at both MVI and La Calandria, clearing Csoil is statistically indistinguishable from Csoil secondary forest plots. At both MVI and La Calandria, however, the difference in Csoil between the secondary plots and the mature forest are statistically significant, with the greatest increase concentrated in the uppermost 10 cm, thus indicating that Csoil is increasing with time in the forests at both sites. Moreover, the lack of difference in Csoil between MVI and La Calandria for both clearings and secondary forest plots demonstrates that altitude-associated climate differences do not play a significant role here. Thus, we conclude that the difference in Csoil in the mature forests at MVI and La Calandria is a function primarily of the difference in age between the sites. At La Calandria, for example, the difference in soil carbon stocks between mature and secondary forest is 86 tC ha−1 . If hypothetically this represents 40 to 50 years of accumulation, the accumulation rate is 1.72 to 2.15 tC ha−1 yr−1 , not an unreasonable range of values in comparison to the values obtained in the studies cited above. Moreover, an accumulation rate within this range would also be consistent with an age for the mature forest at MVI that is several decades older than the La Calandria forest.
4. Conclusions This study measured above-ground biomass and in soil carbon stocks in clearings, experimental secondary forest plots, and mature forests at two locations in the Monteverde region. At a first approximation, the obvious result is that deforestation results in the loss of hundreds of tons of above-ground biomass carbon per hectare and that complete recovery of the lost carbon requires many decades, as numerous previous studies have shown. Additionally, a substantial portion of the soil carbon is lost during deforestation. Perhaps more significantly, this study demonstrates some of the challenges and limitations in determining rates of change in tropical forest carbon stocks: in particular, the lack of complete historical data and the inability to apply dendrochronology forces estimation of forest age based on the distribution of large trees. At the Monteverde Institute
International Journal of Forestry Research (MVI), AGBcarbon stock for the mature forest measured in this study is similar to other measurements of mature tropical montane forest biomass carbon in Costa Rica, as well as other wet montane tropical forests. The combination of historical records and the distribution of large trees suggests a mature forest age likely greater than 80 years. Based on the difference in tree size and AGBcarbon between MVI and La Calandria, we estimate an age difference of the forests of at least 30 years. The biomass of the secondary forest plots at both locations is anomalously low, however, and indicates very low rates of biomass accumulation in comparison to the rates seen in other studies of tropical montane forests. Hence, we suggest some inhibiting factor is limiting forest regrowth, perhaps soil nutrient content depleted through land-use changes or inherited from a low-nutrient parent. Consequently, the rates of biomass carbon accumulation found in this study may not be widely applicable. Although the La Calandria site is located at a lower elevation than MVI and experiences a slightly warmer and drier climate, the nearly identical soil carbon stocks in the secondary forest plots and clearings suggests that climate is not sufficiently different between the sites to explain the difference in the mature forest carbon stocks. Rather, continuous accumulation of soil carbon over a period of three to four decades satisfactorily explains the difference in the size of the soil carbon stocks. The rates of soil carbon accumulation observed here are consistent with other studies conducted in montane and tropical forests, in contrast to the above-ground biomass results, and support the conclusion of some studies that soil carbon increases over time during reforestation in wet montane forests.
Conflict of Interests The authors declare that there is no conflict of interests regarding the publication of this paper.
Acknowledgments This study was made possible by grants from Le Moyne College’s Student Research Fund to Morgan A. Nivison and Megan T. Wilckens and the Faculty Research & Development Fund to Lawrence H. Tanner. The authors are grateful for the support of Debra Hamilton at MVI, which was essential to this project.
References [1] P. Bousquet, P. Peylin, P. Ciais, C. Le Quere, P. Friedlingstein, and P. P. Tans, “Regional changes in carbon dioxide fluxes of land and oceans since 1980,” Science, vol. 290, no. 5495, pp. 1342–1346, 2000. [2] P. A. Martin, A. C. Newton, and J. M. Bullock, “Carbon pools recover more quickly than plant biodiversity in tropical secondary forests,” Proceedings of the Royal Society B, vol. 280, 2015. [3] T. R. Feldspausch, J. Lloyd, S. L. Lewis et al., “Tree height integrated into pantropical forest biomass estimates,” Biogeosciences, vol. 9, no. 8, pp. 3381–3403, 2012.
7 [4] J. M. Mellilo, R. A. Houghton, D. W. Kicklighter, and A. D. McGuire, “Tropical deforestation and the global carbon budget,” Annual Review of Energy and the Environment, vol. 21, pp. 293–310, 1996. [5] C. C. Rhoades, G. E. Eckert, and D. C. Coleman, “Soil carbon differences among forest, agriculture, and secondary vegetation in lower montane Ecuador,” Ecological Applications, vol. 10, no. 2, pp. 497–505, 2000. [6] W. I. J. Dieleman, M. Venter, A. Ramachandra, A. K. Krockenberger, and M. I. Bird, “Soil carbon stocks vary predictably with altitude in tropical forests: implications for soil carbon storage,” Geoderma, vol. 204-205, pp. 59–67, 2013. [7] R. F. Hughes, J. B. Kauffman, and V. J. Jaramillo, “Biomass, carbon, and nutrient dynamics of secondary forests in a humid tropical region of Mexico,” Ecology, vol. 80, no. 6, pp. 1892–1907, 1999. [8] D. Markewitz, E. Davidson, P. Moutinho, and D. Nepstad, “Nutrient loss and redistribution after forest clearing on a highly weathered soil in Amazonia,” Ecological Applications, vol. 14, no. 4, pp. S177–S199, 2004. [9] A. Bautista-Cruz and R. F. del Castillo, “Soil changes during secondary succession in a tropical montane cloud forest area,” Soil Science Society of America Journal, vol. 69, no. 3, pp. 906– 914, 2005. [10] K. J. Anchukaitis and M. N. Evans, “Tropical cloud forest climate variability and the demise of the Monteverde golden toad,” Proceedings of the National Academy of Sciences of the United States of America, vol. 107, no. 11, pp. 5036–5040, 2010. [11] A. Ramirez, “Ecological research and the Costa Rican park system,” Ecological Applications, vol. 14, no. 1, pp. 25–27, 2004. [12] R. Blasiak, “Ethics and Environmentalism: Costa Rica’s Lesson,” United Nations University, 2011, http://ourworld.unu.edu/en/ ethics-and-environmentalism-costa-ricas-lesson. [13] S. Brown, “Estimating biomass and biomass change of tropical forests: a primer,” FAO Forestry Paper 134, Food and Agriculture Organization of the United Nations, Rome, Italy, 1997, http://www.fao.org/docrep/w4095e/w4095e00.htm. [14] R. O. Lawton and V. J. Dryer, “The vegetation of the monteverde cloud forest reserve,” Brenesia, vol. 18, pp. 101–116, 1980. [15] E. D. Vance and N. M. Nadkarni, “Microbial biomass and activity in canopy organic matter and the forest floor of a tropical cloud forest,” Soil Biology and Biochemistry, vol. 22, no. 5, pp. 677–684, 1990. [16] G. V. N. Powell and R. D. Bjork, “Habitat linkages and the conservation of tropical biodiversity as indicated by seasonal migrations of three-wattled bellbirds,” Conservation Biology, vol. 18, no. 2, pp. 500–509, 2004. [17] N. Nadkarni and N. Wheelwright, Monteverde: Ecology and Conservation of a Tropical Cloud Forest, Oxford University Press, 2000. [18] M. S. Lachniet and W. P. Patterson, “Oxygen isotope values of precipitation and surface waters in northern Central America (Belize and Guatemala) are dominated by temperature and amount effects,” Earth and Planetary Science Letters, vol. 284, no. 3-4, pp. 435–446, 2009. [19] J. Kricher, Tropical Ecology, Princeton University Press, 2011. [20] N. M. Nadkarni, T. J. Matelson, and W. A. Haber, “Structural characteristics and floristic composition of a Neotropical cloud forest, Monteverde, Costa Rica,” Journal of Tropical Ecology, vol. 11, no. 4, pp. 481–495, 1995.
8 [21] R. Condit, Methods for Estimating Above-Ground Biomass of Forest and Replacement Vegetation in the Tropics, Center for Tropical Forest Science Research Manual, Smithsonian Tropical Research Institute, 2008. [22] D. V. Spracklen and R. Righelato, “Tropical montane forests are a larger than expected global carbon store,” Biogeosciences, vol. 11, no. 10, pp. 2741–2754, 2014. [23] I. Oliveras, C. Girardin, C. E. Doughty et al., “Andean grasslands are as productive as tropical cloud forests,” Environmental Research Letters, vol. 9, no. 11, 2014, http://iopscience.iop.org/ article/10.1088/1748-9326/9/11/115011. [24] S. T. O’Brien, S. P. Hubbell, P. Spiro, R. Condit, and R. B. Foster, “Diameter, height, crown, and age relationships in eight neotropical tree species,” Ecology, vol. 76, no. 6, pp. 1926–1939, 1995. [25] K. D. Holl and R. A. Zahawi, “Factors explaining variability in woody above-ground biomass accumulation in restored tropical forest,” Forest Ecology and Management, vol. 319, pp. 36– 43, 2014. [26] C. Uhl, R. Buschbacher, and E. A. S. Serrao, “Abandoned pastures in eastern Amazonia. I. Patterns of plant succession,” Journal of Ecology, vol. 76, no. 3, pp. 663–681, 1988. [27] T. R. Feldpausch, M. A. Rondon, E. C. M. Fernandes, S. J. Riha, and E. Wandelli, “Carbon and nutrient accumulation in secondary forests regenerating on pastures in central Amazonia,” Ecological Applications, vol. 14, no. 4, pp. S164–S176, 2004. [28] W. L. Silver, R. Ostertag, and A. E. Lugo, “The potential for carbon sequestration through reforestation of abandoned tropical agricultural and pasture lands,” Restoration Ecology, vol. 8, no. 4, pp. 394–407, 2000. [29] J. L. Schedlbauer and K. L. Kavanagh, “Soil carbon dynamics in a chronosequence of secondary forests in northeastern Costa Rica,” Forest Ecology and Management, vol. 255, no. 3-4, pp. 1326–1335, 2008. [30] N. Salinas, Y. Malhi, P. Meir et al., “The sensitivity of tropical leaf litter decomposition to temperature: results from a largescale leaf translocation experiment along an elevation gradient in Peruvian forests,” The New Phytologist, vol. 189, no. 4, pp. 967– 977, 2011.
International Journal of Forestry Research
Journal of
Journal of
Waste Management
Hindawi Publishing Corporation http://www.hindawi.com
The Scientific World Journal Volume 2014
International Journal of
Ecology
Environmental and Public Health
Hindawi Publishing Corporation http://www.hindawi.com
Volume 2014
Scientifica Hindawi Publishing Corporation http://www.hindawi.com
Volume 2014
Hindawi Publishing Corporation http://www.hindawi.com
Volume 2014
Hindawi Publishing Corporation http://www.hindawi.com
Volume 2014
Journal of
Ecosystems
International Journal of
Oceanography Hindawi Publishing Corporation http://www.hindawi.com
Hindawi Publishing Corporation http://www.hindawi.com
Volume 2014
Volume 2014
Submit your manuscripts at http://www.hindawi.com Journal of
International Journal of
Marine Biology
Atmospheric Sciences Hindawi Publishing Corporation http://www.hindawi.com
International Journal of
Journal of
Biodiversity Hindawi Publishing Corporation http://www.hindawi.com
Geological Research Volume 2014
Hindawi Publishing Corporation http://www.hindawi.com
Volume 2014
Journal of Computational Environmental Sciences
Journal of
Earthquakes Hindawi Publishing Corporation http://www.hindawi.com
Hindawi Publishing Corporation http://www.hindawi.com
Volume 2014
Volume 2014
Hindawi Publishing Corporation http://www.hindawi.com
Volume 2014
International Journal of
Forestry Research Hindawi Publishing Corporation http://www.hindawi.com
Volume 2014
Geophysics International Journal of
Hindawi Publishing Corporation http://www.hindawi.com
Volume 2014
Applied & Environmental Soil Science Hindawi Publishing Corporation http://www.hindawi.com
Journal of
Climatology Volume 2014
Hindawi Publishing Corporation http://www.hindawi.com
Volume 2014
Advances in
Environmental Chemistry
Advances in
Meteorology Hindawi Publishing Corporation http://www.hindawi.com
Volume 2014
Volume 2014
Hindawi Publishing Corporation http://www.hindawi.com
Volume 2014