SILVA FENNICA
Silva Fennica 43(4) research articles www.metla.fi/silvafennica · ISSN 0037-5330 The Finnish Society of Forest Science · The Finnish Forest Research Institute
Biomass Equations for Scots Pine and Norway Spruce in Finland Jaakko Repola
Repola, J. 2009. Biomass equations for Scots pine and Norway spruce in Finland. Silva Fennica 43(4): 625–647. In this study, biomass equations for the above- and below-ground tree components of Scots pine (Pinus sylvestris) and Norway spruce (Picea abies [L.] Karst.) were developed. The models were based on 908 pine trees and 613 spruce trees collected in 77 stands located on mineral soil, and represented a wide range of stand and site conditions in Finland. The whole data set consisted of three sub data sets: 33 temporary sample plots, five thinning experiments, and the control plots of 39 fertilization experiments. The biomass equations were estimated for the individual tree components: stem wood, stem bark, living and dead branches, needles, stump, and roots. In the data analysis, a multivariate procedure was applied in order to take into account the statistical dependence among the equations. Three multivariate models for above-ground biomass and one for below-ground biomass were constructed. The multivariate model (1) was mainly based on tree diameter and height, and additional commonly measured tree variables were used in the multivariate models (2) and (3). Despite the unbalanced data in terms of the response variables, the statistical method generated equations that enable more flexible application of the equations, and ensure better biomass additivity compared to the independently estimated equations. The equations provided logical biomass predictions for a number of tree components, and were comparable with other functions used in Finland and Sweden even though the study material was not an objective, representative sample of the tree stands in Finland. Keywords tree biomass, biomass equations, pine, spruce Addresses Finnish Forest Research Institute, Rovaniemi Research Unit, P.O. Box 16, FI-96301 Rovaniemi, Finland E-mail
[email protected] Received 11 September 2008 Revised 15 May 2009 Accepted 1 July 2009 Available at http://www.metla.fi/silvafennica/full/sf43/sf434625.pdf
625
Silva Fennica 43(4), 2009
1 Introduction There is a current need for reliable biomass estimates for total tree and individual tree components such as stem wood, stem bark, living and dead branches, foliage, stump and roots. Because direct measurement of the tree biomass, usually expressed as dry weight, is not feasible in practise, biomass estimates are commonly obtained with regression models which, in turn, are based on easily measurable tree variables. Biomass models should meet specific requirements before they can be used in forest management planning systems and forest biomass inventories at the national scale (Kärkkäinen 2005). First of all, the models have to produce reliable biomass estimates applicable over the whole country. Secondly, the biomass models should be based on the variables that are normally measured in forest inventories, or which can be estimated easily and reliably from inventory data. Thirdly, the models should be based on the same sample trees in order to give a reliable depiction of the interrelationship between the individual tree components. In addition, one desirable feature of the tree components equations is biomass additivity, i.e. that the sum of the predictions for the tree component equals the prediction for the whole tree (Kozak 1974, Cunia and Briggs 1984, Parresol 1999, 2001). Furthermore, the model should be formulated such that the models can be applied flexibly, for example they can be calibrated to a new stand with the help of the biomass measurements (Repola 2008). Several studies on pine and spruce biomass have been published in the Nordic countries, but only a few functions have been published that fulfil the above requirements. In Sweden, Marklund (1988) published biomass functions for different above- and below-ground tree components that were based on a large and representative material from the Swedish national forest inventory. These functions are commonly used in Scandinavia and, according to Kärkkäinen (2005), they are also applicable in Finland. In Finland, Hakkila’s (1979, 1991) functions have also often been applied for predicting stem and crown biomass. However, the functions for crown biomass are primarily applicable to trees in logging removals, and not to the whole growing stock. Hakkila’s (1979) dry weight tables for pine and spruce stems provide estimates 626
research articles
of stem biomass including bark as a function of tree diameter, height, and taper class. Repola et al. (2007) published general biomass equations in which the biomass of the above-ground and of the below-ground tree components are modelled mainly on the basis of the same sample trees. Functions for the below-ground biomass components of pine and spruce have been published by Hakkila (1972), Finér (1991) and Repola et al. (2007) in Finland, and by Marklund (1988) and Petersson (2006) in Sweden. These commonly used biomass functions are primarily applicable for trees growing on mineral soil but, according to Kärkkäinen (2005), both Marklund’s (1988) and Hakkila’s (1979, 1991) functions can also be applied for trees growing on peatlands. Biomass equations for trees growing on peatland sites in Finland, based on a more limited material, have been published by Finér (1989, 1991) and Laiho (1997). The reliability and applicability of biomass equations depends on the study material and also on how efficiently the study material is utilized in the model estimation. The biomass of the individual tree components usually varies from stand to stand, and they are more strongly correlated within stands than between stands (Repola 2008). In addition, the biomass components of the tree are not independent, which means that there is statistical correlation among the biomass components in the same tree, i.e. the errors in the different equations are correlated (contemporaneous correlation). The hierarchically structured data and contemporaneous correlation have frequently been ignored in the model estimation, which means a loss of precision of the parameter estimates (Parresol 1999, 2001, Repola 2008). The hierarchically structured data can be analysed by the generalized least squares (GLS) estimation method, which permits analysis of the between-stand and within-stand variation (Claesson et al. 2001, Repola et al. 2007, Repola 2008). Contemporaneous correlation can be taken into account by using a multivariate procedure, i.e. by constructing a set of linear or non-linear models, the parameters of which are estimated simultaneously (linear or non-linear seemingly unrelated regression) (Zellner 1962, Parresol 1991 and 2001, Carvalho et al. 2003, Bi et al. 2004, Návar et al. 2004, Repola 2008). The multivariate procedure has also been used to ensure biomass additivity
Repola
Biomass Equations for Scots Pine and Norway Spruce in Finland
by estimating across-equation correlation at the tree level, and by setting linear restrictions on the regression coefficients (across-equation constraints) (Parresol 1991 and 2001, Carvalho et al. 2003, Bi et al. 2004, Návar et al. 2004). Repola (2008) developed multivariate mixed models, in which the across-equation correlations were estimated at both the stand and tree levels, thus illustrating the statistical dependence among the tree components at both the stand and tree levels. This procedure enabled information to be effectively transferred from one equation to another, which allowed flexible model calibration to a new stand by utilizing the across-equation covariances of the random stand parameters (see Lappi 1991, Repola 2008). The aim of this study is to develop biomass equations for above- and below-ground tree components of Scots pine and Norway spruce by applying a multivariate procedure that effectively utilizes the information of the biomass data as well as the information produced by national forest inventories. The purpose is to determine the advantages of applying the multivariate procedure instead of estimating the models independently using data with unbalanced response variables, i.e. in the case when not all the biomass components have been measured on all the sample trees.
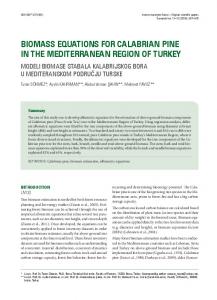
2 Material and Methods 2.1 Material The study material consisted of a total of 44 Scots pine (Pinus sylvestris), and 34 Norway spruce (Picea abies [L.] Karst.) stands. The stands were located on mineral soil sites representing a large part of Finland (Fig. 1). The average annual effective temperature sum (dd, > 5 °C) varied between
Pine Spruce
Fig. 1. Location of the study stands.
705 and 1385 dd (Table 1). The stands were even-aged, and ranged from young to mature growing stock (Table 1). The spruce stands were growing on fertile or highly fertile sites, and the pine stands on dry to fertile sites. The whole data set consisted of three sub data sets: 33 temporary sample plots, five thinning experiments, and the control plots of 39 fertilization experiments. The temporary plots were established in five of the Finnish Research Institute’s research areas, located in different parts of Finland. Four temporary plots, selected from young to mature stands, were established in each research area. The temporary plots were located subjectively in representative parts of the stands.
Table 1. Range of stand characteristics by tree species.
Number of stands
Scots pine Norway spruce
44 34
Temp. sum, dd
T, year
G, m2 ha–1
D, cm
H, m
705–1314 715–1385
13–145 18–161
1.0–32.5 2.2–48.1
3.7–32.4 4.2–35.0
3.2–26.4 3.3–31.4
dd = cumulative annual temperature sum with a threshold of +5 °C, T = stand age (at stump height), G = stand basal area, D = mean diameter at breast height (weighted with tree basal area), H = mean height (weighted with tree basal area)
627
Silva Fennica 43(4), 2009
research articles
All the sample plots were circular plots with a 7-meter radius in young stands, and a 15-meter radius in more advanced stands. The thinning experiments, which were located in pure pine or spruce stands, consisted of plots with different thinning intensities. Unthinned, moderately and heavily thinned plots were selected in each experiment. The plots were rectangular or square shaped, ranging in size from 1000–1600 m2, and in a 5-m-wide buzzer zone (see Mäkinen et al. 2004). Trees growing in the buffer zone of the plots were selected as sample trees, and the trees located within a 7-meter radius around the sample trees were mapped. The control plots in the fertilization experiments used in this study belonged to three different series of long-term fertilization experiments. The oldest experiments, five pine and six spruce stands varying from the first-thinning to finalcutting stage, were established during the period 1958–1965. They belong to a large experiment series, which was established to quantify the impact of the main nutrients (N, P, K and Ca) on soil properties and tree growth (see Kukkola et al. 1983). The second category of experiments was established between 1977–1986 in first thinning stage to quantify the impact of whole-tree
harvesting on loss of nutrients and growth. The treatments were conventional and whole-tree harvesting with or without fertilization (see Jacobson et al. 2000). On some of the experiments also a treatment of double residues was included. Four pine and six spruce stands were used in this study. The third series of experiments consisted of 13 pine and 5 spruce stands. It was established 1990–1993 in middle aged stands to study the possibilities to prevent or alleviate forest decline caused by air pollutants or other factors and thus to promote the health of trees (see Saarsalmi et al. 2004). The experimental design of the fertilization experiments was factorial in the case of the first experiment series and randomized blocks for the other two. The size of the rectangle or square shaped plot varied from 625–900 m2. Only the sample trees from the unfertilized plots were selected to the study material. 2.2 Sample Trees The sample trees, in most cases 4–5 trees per plot, represented the whole growing stock, but were selected randomly by weighting by tree size, i.e. the trees were selected with a probability
Table 2. Number of sample trees per experiment.
Scots pine Norway spruce Total
Total
Temporary plot
Thinning experiment
Fertilization experiment
908 613 1521
78 67 145
36 24 60
794 522 1316
Table 3. Sample tree characteristics. Variable
Scots pine Mean Std Range
Norway spruce Mean Std
Range
Diameter, cm Height, m Age a) Crown ratio (0–1) Radial growth b), cm Bark thickness c), cm
13.1 11.2 56 0.55 0.54 1.5
17.9 15.9 52 0.68 0.76 1.1
1.7–41.7 2.1–35.0 15–164 0.21–0.98 0.07–2.48 0.2–4.1
a) Age
5.3 4.0 23.7 0.12 0.33 1.1
1.5–35.8 2.0–28.6 11–146 0.18–0.90 0.04–2.03 0.1–7.4
7.2 6.0 21.7 0.13 0.41 0.63
measured at stump height, b) breast height radial increment during the last five years, c) double bark thickness at breast height.
628
Repola
proportional to d 2 (d = breast height diameter). The total number of sample trees was 908 for pine and 613 for spruce (Table 2). Damaged trees were not accepted as sample trees. The majority of the sample trees were from the control plots of the fertilization experiments (Table 2). The diameter and age distribution of the sample trees was broad, the diameter ranging from 1.5 to 35.8 cm and from 1.7 to 41.7 cm for pine and spruce, respectively (Table 3).
Biomass Equations for Scots Pine and Norway Spruce in Finland Table 4. Number of measured biomass components by tree species.
Stem wood Stem bark Living branch Dead branch Needles Stump Roots: > 2–5 cm > 1 cm
Scots pine
Norway spruce
626 311 892 847 892 36 35 6
366 170 611 609 611 31 31 5
2.3 Biomass Measurements and Estimation for the Sample Trees The biomass was estimated by individual tree components; stem wood, stem bark, living and dead branches, needles, stump and roots. The branch biomass included both branch wood and bark, and the living branch biomass included cones. Not all the biomass components were measured on all the sample trees (Table 4). The biomass measurements and estimation methods for the tree components have been described in more detail in previous studies (see Repola et al. 2007, Repola 2008). The field measurements on the fertilization experiments were carried out between 1983 and 2003, and on the thinning experiments and temporary sample plots between 2001 and 2003. Tree age, height, living crown length, stem diameter and bark thickness at six points along the stem, and diameter increment during the last five years, were measured on each sample tree. The living crown was divided into four sections of equal length, and one living sample branch was selected subjectively from each section to represent the average-sized (diameter and height) branch of the crown section. One dead sample branch per tree was taken from the lowest crown section. The fresh weight of all remaining living and dead branches in each section was determined in the field. The moisture content of the sample branches was measured in the laboratory. The needle and branch biomass of the tree was estimated by means of a stratified ratio estimator (Cochran 1977, Parresol 1999). Stem wood biomass was calculated by multiplying the stem volume by the average stem wood density. Stem volume, both under-bark and
over-bark, was calculated by applying Laasasen aho’s (1982) taper curve equations calibrated with the diameter and bark thickness measurements made at six points along the stem. Wood density (kg m–3) of the sample tree was measured on two sample disks taken at breast height and at a height of 70%. The average wood density was determined by utilizing, in addition to the basic density measurement of two sample disks, an equation for the vertical dependence of wood density (Repola 2006) and the stem taper curve (see Repola et al. 2007 and Repola 2008). The biomass of the stem bark was obtained from the average bark density and bark volume of the tree. Bark volume was calculated as the difference between the under-bark and over-bark stem volume. The average bark density was obtained from the mean of the bark density of the two sample disks. The stump and root biomass were measured on a sub-sample of the trees on the temporary plots. Stump biomass included both above- and belowground portions, and stump height was on average 1% of tree height. The minimum determined coarse root diameter varied from 2–5 cm depending on tree diameter. In addition, the root biomass was also determined on roots with a diameter larger than 1 cm on some of the trees (Table 4). The fresh weight of the stump and roots were determined in the field. One sample (stump sector) was taken from the stump and two root discs for moisture content determination. The stump and root biomasses of the tree were estimated by applying ratio estimation methods. First, simple regression equations (1) and (2) 629
Silva Fennica 43(4), 2009
research articles
were constructed for the dependence of > 1 cm root biomass on the biomass of coarse roots (2–5 cm). The > 1 cm root biomass was then predicted for the whole root material by applying Eqs. (1) and (2). Scots pine y = 0.103 + 1.525x
R2 = 0.99, σˆ = 1.471 kg
(1)
Norway spruce y = 0.842 + 1.306x
R2 = 0.99, σˆ = 2.332 kg
(2)
where y is the > 1 cm root biomass and x the coarse root biomass. 2.4 Statistical Method The basic assumption in the model approach was that the biomasses of tree components on the same stand and in the same tree are dependent. This meant statistical dependence among the equations, i.e. the errors of the individual equations are correlated. Multivariate procedures with random parameters were applied to take into account the across-equation correlation at both the stand and tree level. Equations for stem wood, stem bark, needles, living and dead branches and total above-ground tree biomass were compiled. Equations for below-ground biomass components were estimated for stump and roots (> 1 cm). The equations for individual tree components and total above-ground biomass were first fitted independently (single models), and a set of linear models was then constructed to form a multivariate linear model. The parameters of the multivariate models were estimated simultaneously. The compiled multivariate model was written as: y1ki = b1x1ki + u1k + e1ki y2 ki = b 2 x 2 ki + u2 k + e2 ki ynki = b n x nki + unk + enki where y1ki , y2ki… ynki = dependent variables of biomass component 1, 2, ... n for tree i in stand k n = number of biomass components
630
(3)
x1ki, x2ki… xnki = vectors of independent variables for tree i in stand k = vectors of fixed effects parameters b1, b2… bn u1k, u2k… unk = random effects for stand k e1ki, e2ki…enki = random effects for tree i in stand k (residual error)
The covariance components, cov(uj,k,uj+1,k) and cov(ej,ki,ej+1,ki), which depicted the dependence among the random effects of biomass components j, were estimated for both the stand and tree level. All the random parameters (u1k, u2k… unk) of the same stand are correlated with each other, and the residuals errors (e1ki, e2ki…enki) of the same tree are correlated. The random parameters and residuals errors are assumed to be uncorrelated, and also assumed to be identically distributed Gaussian random variables with a expected value of 0. In addition, the random parameters are also assumed to have different variances. The material had a hierarchical, 2-level (temporary plots) and 3-level (thinning and fertilization experiments), structure. To define the model we treat the study site as a 2-level unit (between sites) and the tree (within site) as a 1-level unit. In order to simplify the structure of the data the plot level was ignored in the fertilization experiments. In the thinning experiments, the plots were assumed to be independent, i.e. treated as if they were from the different stands. LME procedures of R software were used to estimate the multivariate models. The LME procedure was a suitable tool for multivariate analysis in our case because it uses observations that have incomplete responses. The biomass equations have a multiplicative model form. Logarithmic transformation was used to obtain homoscedasticity of the variance, and to transform the equation to a linear form. When applying the fixed part of the equations, a variance correction term, σ u2 + σ e2 / 2 (where σ u2 = var(uk) and σ e2 = var(eki)), should be added to the intercept in order to correct for the bias due to the logarithmic transformation. This correction factor tended to lead to overestimation of the biomass of dead branches due to the large value of the variance, σ u2 + σ e2 . More robust correction term (c) was calculated from the data using the formula c = ∑ y / ∑ eln( yˆ), where y is the measured biomass of the dead branches and yˆ is the fixed
(
(
)
)
Repola
prediction for dead branches. The prediction can then be retransformed with the correction term as follows: y = c ⋅ eln( yˆ) (Snowdon 1991).
Biomass Equations for Scots Pine and Norway Spruce in Finland
Multivariate Model 1a Scots pine Above-ground biomass equations for pine (Table 5):
3 Results 3.1 Multivariate Models Multivariate models were constructed separately for the above-ground and below-ground biomass. Owing to the different number of observations of the above- and below-ground components, the model parameters of these components could not be estimated simultaneously. The multivariate model for above-ground biomass contained the equations for stem wood, stem bark, needles, living and dead branches and total tree biomass. The multivariate model for below-ground biomass included stump and roots with diameter > 1 cm. Three multivariate models for above-ground biomass and one for below-ground biomass were constructed for both pine and spruce. Multivariate models (1) were mainly based on tree diameter at breast height (d) and tree height (h) (Eqs. 4–19). Multivariate models (2) contained, in addition to diameter and height, tree age at breast height (t13) and crown variables as independent variables (see Appendix, Eqs. A1–A12). Multivariate models (3) were based, in addition to the previously mentioned variables, on bark thickness (bt) and radial increment during the last five years (i5) (see Appendix, Eqs. A13–A24). Only variables measured in the national forest inventory were used in model formulation. The most significant independent variable, diameter at breast height, was expressed as an approximation of the stump diameter, dS = 2 + 1.25d (Laasasenaho 1982), which can be interpreted as a transformation rather than an estimate of stump diameter. This was done in order to obtain a model that is also valid for trees with a height under 1.3 m. The best transformation of dS was dS / (dS + n), where n is a constant determined by the grid search method (See Marklund 1988, Repola 2008). A similar transformation, in addition to ln(h), also proved to be a usable expression of tree height.
Stem wood: ln( yki ) = b0 + b1
dSki hki + b2 (dSki + 14) (hki + 12)
(4)
+u k + eki Stem bark: ln( yki ) = b0 + b1
dSki + b2 ln(hki ) + u k + eki (dSki + 12)
(5)
Living branches: ln( yki ) = b0 + b1
dSki hki + b2 (dSki + 12) (hki + 12)
(6)
+u k + eki Needles: ln( yki ) = b0 + b1
dSki hki + b2 + u k + eki (7) (dSki + 6) (hki + 1)
Dead branches: ln( yki ) = b0 + b1
dSki + u k + eki (dSki + 16)
(8)
Total (above-ground): ln( yki ) = b0 + b1
dSki hki + b2 (dSki + 12) (hki + 20)
(9)
+u k + eki
Multivariate Model 1b Below-ground biomass equations for pine (Table 6): Stump: ln( yki ) = b0 + b1
dSki + u k + eki (dSki + 12)
(10)
dSki + u k + eki (dSki + 15)
(11)
Roots >1 cm: ln( yki ) = b0 + b1
631
Silva Fennica 43(4), 2009
research articles
Table 5. The parameter estimates of multivariate model 1a. For the fixed parameters the standard error is given in parentheses. Variances and correlations of random stand parameters (unk) and residual errors (enki), and the empirical correction factor (c) for dead branches models, are given.
Fixed b0 b1 b2 Random var(uk) var(eki) u2k u3k u4k u5k u6k e2ki e3ki e4ki e5ki e6ki c
Stem wood
Stem bark
Living branches
Needles
Dead branches
Total
Eq. 4
Eq. 5
Eq. 6
Eq. 7
Eq. 8
Eq. 9
N = 626 –3.721 (0.032) 8.103 (0.106) 5.066 (0.107)
N = 311 –4.548 (0.111) 7.997 (0.402) 0.357 (0.086)
N = 892 –6.162 (0.090) 15.075 (0.260) –2.618 (0.284)
N = 892 –6.303 (0.524) 14.472 (0.350) –3.976 (0.789)
N = 847 –5.201 (0.172) 10.574 (0.293) -
N = 285 –3.198 (0.038) 9.547 (0.107) 3.241 (0.116)
0.002 0.009 u1k 0.187 –0.082 –0.213 –0.513 0.394 e1ki 0.261 0.171 0.078 0.039 0.747
0.015 0.061 u2k
0.041 0.089 u3k
0.109 0.118 u4k
0.253 0.362 u5k
0.009 0.010 u6k
–0.051 –0.465 0.341 0.233 e2ki
0.767 –0.082 0.830 e3ki
–0.410 0.498 e4ki
–0.193 e5ki
e6ki
0.244 0.011 0.119 0.476
0.295 0.152 0.655
–0.110 0.322
Table 6. The parameter estimates of multivariate model 1b. For the fixed parameters the standard error is given in parentheses. Variances and correlations of random stand parameters (unk) and residual errors (enki) are given.
Fixed b0 b1 Random var(uk) var(eki) corr(u1k, u2k) corr(e1ki, e2ki)
Stump
Roots > 1 cm
Eq. 10
Eq. 11
N = 36 –6.753 (0.190) 12.681 (0.312)
N = 36 –5.550 (0.178) 13.408 (0.315)
0.010 0.044 –0.296
0 .000 0.079
0.241 0.911
Multivariate Model 1c Norway spruce Above-ground biomass equations for spruce (Table 7): Stem wood: ln( yki ) = b0 + b1
dSki (dSki + 14)
+ b2 ln(hki ) + b3hki + + u k + eki Stem bark: ln( yki ) = b0 + b1
dSki + b2 ln(hki ) + u k + eki (13) (dSki + 18)
Living branches: ln( yki ) = b0 + b1
dSki hki + b2 (dSki + 13) (hki + 5)
+u k + eki
632
(12)
(14)
Repola
Biomass Equations for Scots Pine and Norway Spruce in Finland
Needles: dSki hki ln( yki ) = b0 + b1 + b2 (dSki + 10) (hki + 1) +u k + eki
(15)
Dead branches: ln( yki ) = b0 + b1
dSki + ln(hki ) (dSki + 18)
+u k + eki
(166)
Total (aboveground): ln( yki ) = b0 + b1
dSki + b2 ln(hki ) (dSki + 20)
+ u k + eki
(17)
Multivariate Model 1d Below-ground biomass equations for spruce (Table 8): Stump: ln( yki ) = b0 + b1
dSki + u k + eki (dSki + 26)
(18)
dSki + u k + eki (dSki + 24)
(19)
Roots >1 cm: ln( yki ) = b0 + b1
where yki = biomass of the tree component or total biomass for tree i in stand k, kg dSki = 2 + 1.25 dki (dki = tree diameter at breast height for tree i in stand k), cm hki = tree height for tree i in stand k, m
3.2 Comparison among Multivariate Models (1), (2) and (3) Multivariate models (1) (2) and (3) were not directly comparable because they were based on a different number of observations as a consequence of missing measurements of independent variables. In general, in all the equations the between-stand variance was clearly lower than
the within-stand variance, and the addition of independent variables to the equation reduced the between-stand variance more than the withinstand variance (Tables 5–8, A1–A4). The addition of tree age (t13) to Eqs. (A1) and (A7) for stem biomass based on diameter and height reduced the total error variance by 17% and 34% for pine and spruce, respectively. Adding radial growth (ig5) decreased the total error variance by a further 6% and 10% for pine and spruce, respectively. The equation for stem bark biomass had a similar form in multivariate models (1) and (2). Adding bark thickness (bt) as an independent variable improved bark equations (A14) and (A20) by decreasing the total error variance by 10% for both pine and spruce. Crown variables significantly improved the equations for crown components. Crown length (cl) in needle equations (A4) and (A10) decreased the total error variance by 41% and 45%, and between-stand variance even by 71% and 74% for pine and spruce, respectively. Similarly, the addition of crown length to the equations for living branches (A3) and (A9) decreased the total error variance by 36% and 29% for pine and spruce, respectively. The total error variance deceased by about 7–22% more when variables depicting tree growth rate (i5 and d / t13) were added to the equations for living branches and needles (A15), (A16), (A21) and (A22). The total error variance was considerable in the dead branch equations based on tree diameter or diameter and height (Eqs. 8, 16, A5, A11). The total error variance decreased by 21–23% after adding more independent variables (t13, cl, cr, i5) to Eqs. (A17) and (A23). The equation for the total above-ground biomass for spruce, based on tree height and diameter, was only slightly improved by adding crown ratio (cr) to Eq. (A12). Similarly, using crown ratio as an independent variable improved the equation for total biomass of pine (A6) by reducing the total error variance only by 11%. The total error variance for pine was further decreased by 32% when tree age (t13), radial growth (i5), and bark thickness (bt) were used as independent variables, in addition to tree diameter and height, in Eq. (A18).
633
Silva Fennica 43(4), 2009
research articles
Table 7. The parameter estimates of multivariate model 1c. For the fixed parameters the standard error is given in parentheses. Variances and correlations of random stand parameters (unk) and residual errors (enki), and the empirical correction factor (c) for dead branches models, are given.
Fixed b0 b1 b2 b3 Random var(uk) var(eki) u2k u3k u4k u5k u6k e2ki e3ki e4ki e5ki e6ki c
Stem wood
Stem bark
Living branches
Needles
Dead branches
Total
Eq. 12
Eq. 13
Eq. 14
Eq. 15
Eq. 16
Eq. 17
N = 366 –3.555 (0.067) 8.042 (0.183) 0.869 (0.056) 0.015 (0.003)
N = 170 –4.548 (0.103) 9.448 (0.589) 0.436 (0.123) -
N = 611 –4.214 (0.128) 14.508 (0.417) –3.277 (0.425) -
N = 611 –2.994 (0.634) 12.251 (0.400) –3.415 (0.929) -
N = 609 –4.850 (0.261) 7.702 (0.924) 0.513 (0.220) -
N = 166 –1.808 (0.050) 9.482 (0.243) 0.469 (0.052) -
0.009 0.009 u1k –0.191 –0.454 –0.736 0.416 0.158 e1ki 0.267 0.101 0.060 0.055 0.574
0.023 0.041 u2k
0.039 0.081 u3k
0.107 0.089 u4k
0.367 0.352 u5k
0.006 0.013 u6k
0.483 0.604 –0.161 0.270 e2ki
0.864 –0.745 0.566 e3ki
–0.753 0.406 e4ki
–0.476 e5ki
e6ki
0.285 –0.003 0.055 0.458
0.284 –0.093 0.683
–0.054 0.431
Table 8. The parameter estimates of multivariate model 1d. For the fixed parameters the standard error is given in parentheses. Variances and correlations of random stand parameters (unk) and residual errors (enki) are given.
Fixed b0 b1 Random var(uk) var(eki) corr(u1k, u2k) corr(e1ki, e2ki)
634
Stump
Roots > 1 cm
Eq. 18
Eq. 19
N = 31 –3.964 (0.248) 11.730 (0.575)
N = 31 –2.294 (0.336) 10.646 (0.575)
0.065 0.058 0.130 0.155
0.105 0.114
0.031 1.343
3.3 Correlation between the Equations The equations for biomass components were not independent, i.e. correlation (across-equation correlation) was detected between the random parameters at both the stand and tree levels (residual error). In general, the across-equation correlation at the stand level was higher than that at the tree level. The stand level random parameter of needles and dead branches showed negative correlation in all the multivariate models of pine and spruce (Tables 5, 7, A1–A4). This means that, in the stands where the needle biomass was tended to be overestimated, the dead branch biomass was, in turn, underestimated. The highest correlations between the aboveground biomass components of spruce occurred between the needles and living branches as well
Repola
as with stem bark, for which the random parameters at the stand level had positive correlation in all the multivariate models: they varied from 0.501 to 0.864. The random stand parameter of living and dead branches showed negative correlation, which varied from –0.403 to –0.745 (Tables 7, A2, A4). In the pine models the correlation between the random stand parameter of the biomass components was lower than that in the spruce models. The highest correlation, from –0.428 to –0.683, occurred between stem wood and dead branches (Table 5, A1, A3). The tree level errors were not systematically correlated among the tree components, and no correlations over 0.400 were detected. The random error of the total tree biomass was highly correlated with the other tree components, especially with the stem wood biomass of living branches. The random parameters of the stump and roots equations were poorly correlated at both the stand and tree level (Table 6, 7). 3.4 Biomass Additivity A desirable feature of tree components equations is that the sum of predictions for the individual tree components equals the prediction for the whole tree (Parresol 1999). The sum of predictions for the tree components equalled the prediction for the total tree biomass relatively well, especially for pine. When applying multivariate models for pine (1a) and (3a), the sum of the tree components resulted in an average of 0.2% and 1.1% lower tree biomass compared to the prediction for the total tree equations (9) and (A18). In multivariate model (2a) the tree component equations produced, on the average, 1.2% higher tree biomass compared to the prediction for the total tree equation (A6). The tree component equations for spruce produced, on the average, 2.3%, 3.7% and 4.5% lower tree biomass compare to the predictions for total tree equations in multivariate models (1c), (2b) and (3b), respectively. Although biomass additivity was not totally ensured in the multivariate models, the multivariate procedure gave better results compared to the independently (single models) estimated equations. When the equations in multivariate models (1), (2) and (3) were estimated independently the tree component
Biomass Equations for Scots Pine and Norway Spruce in Finland
equations produced, on the average, 0.1%, 2.2% and 4.7% higher tree biomass prediction for pine, and 4.6%, 5.4% and 6.7% lower tree biomass predictions for spruce compared to the predictions of the total tree equations. 3.5 Comparison with Other Functions The predictions given by multivariate models (1a), (1b), (1c) and (1d) were compared with the results obtained with other functions commonly used in Finland (Hakkila 1979, 1991, Marklund 1988, Petersson 2006). The reference functions for the above-ground tree components were based on tree diameter and height, and the functions for the below-ground tree components on tree diameter. Sample trees from the 9th Finnish National Forest Inventory (NFI9, 1996–2003) data were used as the test material. Stem biomass estimates, including stem wood and bark, given by the different equations were relatively similar for trees with a diameter > 30 cm. For larger trees multivariate models (1a) and (1c) yielded lower stem biomass values for both pine and spruce than those given by Marklund’s (1988) and Hakkila’s (1979) functions (Figs. 2 and 3). The comparisons were made for functions in which only the variation in stem form, caused by varying breast height diameter and height, was taken into account. All the equations yielded relatively similar predictions of the living crown biomass for trees with a diameter under 30 cm, but for larger trees Hakkila’s (1991) functions clearly gave the largest living crown biomass for both pine and spruce (Figs. 2 and 3). Multivariate models (1a) and (1c) and Marklund’s (1988) functions gave a relatively similar prediction, especially for spruce throughout the diameter range. The stump and root biomass obtained with the different equations were relatively similar and logical when the minimum root diameter was taken into account. Multivariate models (1b) and (1d) mainly followed a logical pattern throughout the diameter range, especially for spruce, compared to Swedish (Marklund 1998, Petersson 2006) functions (Figs. 2 and 3). Hakkila’s (1972) functions produced the lowest stump and root biomass for both pine and spruce. The estimates 635
Silva Fennica 43(4), 2009
research articles
1000
800
900
Model 1 Marklund Hakkila
700 600
700
Stem, kg
Stem, kg
500 400 300
0 0
10
20
30
40
50
60
d, cm
10
20
30
40
50
60
40
50
60
d, cm Model 1 Marklund Hakkila
600 500
Living crown, kg
250
0
700
Model 1 Marklund Hakkila
300
Living crown, kg
400
100
350
200 150
400 300 200
100
100
50
0 0
10
20
30
40
50
60
20
30
Model 1 > 1cm Marklund > 5cm Hakkila > 5cm Petersson > 0.5cm
400
Stump and roots, kg
250
10
500
Model 1 > 1cm Marklund > 5cm Hakkila > 5 cm Pettersson > 0.5cm
300
0
d, cm
d, cm
350
Stump and roots, kg
500
200
100
0
600
300
200
0
Model 1 Marklund Hakkila
800
200 150 100
300
200
100
50 0
0
0
10
20
30
40
50
60
d, cm
Fig. 2. The expected pine biomass in the Finnish NFI data predicted using different biomass functions.
636
0
10
20
30
40
50
60
d, cm
Fig. 3. The expected spruce biomass in the Finnish NFI data predicted using different biomass functions.
Repola
for below-ground biomass are not directly comparable because the minimum root diameter varies among the studies. In our study, root biomass was determined up to a diameter of 1 cm, and in Hakkila’s (1972) and Marklund’s (1988) study up to a diameter of over 5 cm. Petersson’s functions included roots down to a diameter of 0.5 cm.
4 Discussion In this study biomass equations were developed for the above- and below-ground tree components of Scots pine and Norway spruce. The equations were based on the same material, and mainly also on the same model formulation, which was used in a previous study (See Repola et al. 2007). Furthermore, multivariate models (2a) and (2b) included the equations for stem wood and total above-ground biomass, based on the combination of the independent variables, which were not presented in a previous study (Repola et al. 2007). In this study the equations were estimated by applying the multivariate procedure instead of estimating the equations independently, while ignoring the dependence among the biomass of the tree components of the same stand or tree. The multivariate procedure proved to be an efficient method for the model estimation despite the unbalanced data in terms of the response variables, i.e. in the case when not all the biomass components were measured on all the sample trees. Based on the verified statistical dependence among the biomass equations (across-equation correlations), especially at the stand level, the multivariate procedure had a number of advantages compared to the independently estimated equations. First, the across-equation correlations of the random parameters enable information to be transferred from one equation to another, which is especially useful in calibrating the model for a new stand (Lappi 1991, Repola 2008). The biomass prediction can be calibrated to a given stand by utilizing the across-equation correlations of random stand parameters and measurements of other biomass components (Lappi 1991, Repola 2008). Second, the covariance matrix of the fixed parameters in the multivariate models also produced across-equation covariance of the fixed
Biomass Equations for Scots Pine and Norway Spruce in Finland
parameters. It is possible, using these covariances, to calculate the prediction reliability, for example the confidence interval for any combination of the biomass components. This information is not available for independently estimated equations. Third, the multivariate model usually produces more reliable parameter estimates when contemporaneous correlations occur (Parresol 1999 and 2001, Repola 2008). This advantage was, however, of only minor importance in this study because the multivariate procedure only slightly changed the parameter estimates and produced slightly more reliable parameter estimates (not presented) (Repola 2008). In addition, although biomass additivity was not totally ensured in the multivariate models, they gave better results compared to the independently (single models) estimated equations. In the multivariate procedure, biomass additivity can be ensured by setting across-equation constraints and by constructing a total tree equation such that it is a function of all the independent variables used in the tree component equations (Briggs 1984, Parresol 1999, Carvalho et al. 2003, Bi et al. 2004, Návar et. al. 2004). Due to problems in the model estimation for unbalanced data (unbalanced response variables) the structure of the models had to be simplified, and the additivity procedure was not applied. In addition, the additivity procedure would have resulted in a complex total tree equation with several transformations of breast height diameter and height. Because of additivity restriction, the inherent equations for total tree biomass (log transformed) could not be linearized and thus it could not be estimated by the linear estimation method. Despite this, the summed predictions of the individual tree components corresponded, on the average, relatively well to the prediction for the whole tree by applying the constructed multivariate models for pine especially. Because all the biomass components were not measured on all the sample trees, the equations for the total tree biomass were clearly based on a lower number of observations compared to the equations for the biomass of individual tree components, and this partly caused shortcomings in terms of biomass additivity. When assessing the reliability of the predicted biomass value, statistical errors in the dependent variable caused by the measurements and sub637
Silva Fennica 43(4), 2009
sampling should not be ignored (Paressol 1999). Determination of the dependent variables (biomass of tree components or total tree biomass) was not based on direct measurements, but on sub-sampling. Small samples were selected from the tree components by a specific procedure and information about the samples was then used to estimate the biomass of the entire tree component. This process of determining the biomass produces an error in the biomass estimates of the tree components (Paressol 1999, 2001). This source of statistical error was not analyzed nor taken into account in the model estimation, because the error of the biomass estimates was difficult to determine confidently. For example, estimates of the variance of branch biomass could not be calculated because the branch biomass of the sample tree was based on the subjectively selected branches and small sample size (one branch per stratum). In any case, this type of error is not a problem in the linear model if the error is uncorrelated with the independent variables (Paressol 2001). In order to obtain reliable biomass estimates at the national scale (large scale), the biomass models should be based on a representative sample of the stands in which the results are to be applied (Paressol 1999). The equations developed in our study were based on subjectively selected plots and experiments, which may restrict the applicability of the equations. Due to the lack of representative material, the equations based only on tree diameter, are not presented here (except for some tree components), and some notations and recommendations for suitable applications of the models need to be set. In general, the biomass equations are applicable to all growing stock over a large part of Finland. The equations are valid over a wide diameter range up to 35 and 42 cm, and also produce logical predictions for larger trees when the equations are extrapolated. The validity of the equations is uncertain in the northernmost parts of Finland and on peatlands. There is a risk of biased predictions if multivariate models (1a) and (1c) are applied to stands where the distribution of the tree characteristics deviates from that of the study material. This risk can be decreased by applying multivariate models (2a), (2b), (3a) or (3b) to stands on mineral soil and peatlands. For crown components, i.e. living branches and needles, the most applicable and stable pre638
research articles
diction was obtained by applying multivariate models (2a) and (2b) based on diameter, height and crown length. The crown length significantly diminished the between-stand error variance for both pine and spruce, which implies significantly reliable predictions for the stand-level crown biomass. This will also improve the prediction for energy wood stocks, which was the most unreliable when Marklund’s (1988) equation based on diameter and height was applied (Kärkkäinen 2005). Multivariate models (3a) and (3b) produced the most reliable prediction in the study material, but adding variables depicting the tree growth rate as independent variables increased the multicollinearity of the independent variables which, in turn, subsequently increased the risk of a biased prediction in the combination of independent variables that were poorly represented in the study material. Application of multivariate models (1a) and (1c) based only on tree diameter and height can lead to biased predictions for the crown components in northern Finland and on peatlands, especially on undrained mires, where the diameter-height relationship deviates from that of the study material. In these cases a low height to diameter ratio obviously produces overestimates for living branches and needles due to the negative parameter estimates of tree height. The tree needle biomass varies between seasons and it is at its highest, especially for pine, at the end of the growing season before dead needles are shed (Jalkanen 1986). For spruce the dynamics of needle fall is more irregular (Gruber 1990). In this study the biomass samples were collected during autumn, when a part of dead needles have already been shed. In addition, the number of needle sets varies from year to year in both pine and spruce (Jalkanen et al. 1995, Levanič et al. 2006). In this study, the field measurements were carried out between 1983 and 2003, when the risk of biased predictions caused by the between-year variation is minor compared to the situation when the needle equation is based only on field measurements conducted in one year only. Stem wood biomass consisted of two components: stem volume and average wood density of the stem. The usability of the models depended on how these components were depicted in the models. Growth rate is highly (negatively) correlated with wood density in conifers (Mergen et
Repola
al. 1964, Hakkila 1979, Saranpää 1983, MacPeak et al. 1990, Mäkinen and Uusvaara 1992), and stem volume with the tree dimensions: diameter, height and stem taper (Laasasenaho 1982). The variation in wood density caused by the variation in growth rate was taken into account in multivariate models (2a), (2b), (3a) and (3b) by using the interaction between tree diameter and the agedepicting growth rate as independents variables. Because this variation was ignored in multivariate models (1a) and (1c), multivariate models (2a), (2b), (3a) and (3b) are more applicable. In turn, only the variation in stem form caused by tree height was taken into account in the multivariate models. Also the variation in diameter- and height-independent stem form (stem tapering) has a strong influence on stem biomass (Hakkila 1979). The upper stem diameter (diameter at a height of 6 meters) was not used as an independent variable, because otherwise the equations would have been valid only for trees with a height over 6 m. The equations for stem wood biomass are now valid for trees of all sizes, as well as for trees with a height under 6 m. When the upper diameter, such as the diameter at a height of 6 meters is measured, the stem biomass can be calculated more reliably by applying an applicable volume function (Laasasenaho 1982) and the models for average wood density (Repola et. al 2007). Stem volume can be converted into biomass by multiplying the predicted stem density by the volume. All the above-ground tree components were relatively well represented in the material. In contrast, the below-ground biomass equations were based on a relatively deficient material. In addition, the biomass of >1 cm roots was measured on six pine and five spruce trees, and for the rest of the root material it was estimated using simple regression. These facts should be kept in mind when applying the model for root biomass, especially for trees with a diameter of > 25 cm, and for trees growing on peatlands where the root biomass is usual higher than that on mineral soil (Hakkila 1972, Marklund 1988). Despite the deficient material, the equations produced logical predictions for the below-ground biomass compare with the functions of Marklund (1988) and Petersson (2006). The biomass equations are applicable over a wide range of stand and site conditions in Finland. Due
Biomass Equations for Scots Pine and Norway Spruce in Finland
to the applied statistical method the multivariate models enable more flexible application of the equations, and ensure biomass additivity better than the equations presented earlier (Repola et al. 2007). Furthermore, multivariate models (2a) and (2b) included the equations for stem wood and total above-ground biomass, based on a combination of the independent variables, which were not earlier presented (see Repola et al. 2007).
Acknowledgements I thank Dr. Risto Ojansuu for helpful advice throughout the study. I am grateful to Mikko Kukkola for providing the study material and John Derome for revising the language. I thank also Pekka Välikangas and other staff in Salla Experimental Office for carrying out the field and laboratory works. Anonymous referees made valuable comments on the manuscript.
References Claesson, S., Sahlén, K. & Lundmark, T. 2001. Func tions for biomass estimation of young Pinus sylvestris, Picea abies and Betula spp. from stands in northern Sweden with high stand densities. Scandinavian Journal of Forest Research 16: 138–146. Cunia, T. & Briggs, R.D. 1984. Forcing additivity of biomass tables: some empirical results. Canadian Journal of Forest Resources 14: 376–384. Finér, L. 1989. Biomass and nutrient cycle in fertilized and unfertilized pine, mixed birch and pine and spruce stands on drained mire. Acta Forestalia Fennica 208. 63 p. — 1991. Effect of fertilization on dry mass accumulation and nutrient cycling in scots pine and on an ombrotrophic bog. Acta Forestalia Fennica 208. 63 p. Gruber, F. 1990. Branching system, needle fall and needle density of Norway spruce. Contributiones Biologiae Arborum 3. 136 p. Hakkila, P. 1972. Mechanization harvesting of stumps and roots. Communicationes Instituti Forestalis Fenniae 77(1). 71 p. — 1979. Wood density surveys and dry weight tables
639
Silva Fennica 43(4), 2009 for pine, spruce andbirch stems in Finland. Communicationes Instituti Forestalis Fenniae 96(3). 59 p. — 1991. Crown mass of trees at the harvesting phase. Folia Forestalia 773. 24 p. Jakobson, S., Kukkola, M., Mälkönen, E. & Tveite. B. 2000. Impact of whole tree harvesting and compensatory fertilization on growth of coniferous thinning stands. Forest Ecology and Management 129: 41–51. Jalkanen, R. 1986. Lophodermella sulcigena on Scots pine in Finland. Communicationes Instituti Forestalis Fenniae 136. 41 p. — , Aalto T. & Kurkela, T. 1995. Development of needle retention in Scots pine (Pinus sylvestris) in 1957–1991 in northern and southern Finland. Trees (10): 125–133. Kärkkäinen, L. 2005. Evaluation of performance of tree-level biomass medels for forestry modelling and analyses. Finnish Forest Research Institute, Research Papares 940. 123 p. Kozak, A. 1970. Methods of ensuring biomass additivity of biomass components by regression analysis. Forest Chronology 46(59): 402–404. Kukkola, M. & Saramäki, J. 1983. Growth response in repeatedly fertilized pine and spruce stands on mineral soils. Communicationes Instituti Forestalis Fenniae 114. 55 p. Laasasenaho, J. 1982. Taper curve and volume functions for pine, spruce and birch. Communicationes Institute Forestalis Fenniae 108. 74 p. Laiho, R. 1997. Plat biomass dynamics in drained pine mires in southern Finland. Implications for carbon and nutrient balance. The Finnish Forest Research Papers 631:1–53. Levanič, T., Jalkanen, R., Gričar, J., Gagen. M. & Oven, P. 2006. Use of different growth parameters of Norway spruce (Picea abies (L.) Karst.) to study tree response to climatic. Zbornik gozdarstva in laserstva 80: 97–109. MacPeak, M.D., Burkart, L.F. & Weldon, D. 1990. Comparison of grade, yield, and mechanical properties of lumber produced from young fast-grown and old slow- grown planted slash pine. Forest Products Journal 40 (1), 11–14. Mäkinen, H. & Uusvaara, O. 1992. Effect of fertilization on the branchiness and wood quality on Scots pine. Folia Forestalia 801. 23 p. — & Isomäki, A. 2004. Thinning intensity and growth of Norway spruce in Finland. Forestry 77(4).
640
research articles Marklund, G. 1988. Biomass functions for pine, spruce and birch in Sweden. Swedish University of Agricultural Sciences. Department of Forest Survey Report 45. 71 p. Mergen, F., Burley, J. & Yeatman, C.W. 1964. Variation in growth characteristics and wood properties of Norway Spruce. Tappi 47(8): 499–504. Parresol, B.R. 1999. Assessing tree and stand biomass: a review with examples an critical comparisons. Forest Science 45(4): 573–593. — 2001. Additivity of nonlinear biomass equations. Canadian Journal of Forest Research 31: 865– 878. Petersson, H. 1999. Biomassafunktioner för trädfraktioner av tall, gran och björk i Sverige. Arbetsrapport 59 1999. 31 p. — 2006. Functions for below-ground biomass of Pinus sylvestris, Picea abies, Betula pendula and Betula pubescens in Sweden. Scandinavian Journal of Forest Research 21(7): 84–93. Repola, J. 2006. Models for vertical wood density of scots pine, norway spruce and birch stems, and their application to determine average wood density. Silva Fennica 40(4): 673–685. — 2008. Biomass equations for birch in Finland. Silva Fennica 42(4): 605–624. — , Ojansuu, R. & Kukkola, M. 2007. Biomass functions for Scots pine, Norway spruce and birch in Finland. Working Papers of the Finnish Forest Research Institute 53. 28 p. Saarsalmi, A., Mälkönen, E. & Kukkola, M. 2004. Effect of wood ash fertilization on soil chemical properties and stand nutrient status and growth of some coniferous stands in Finland. Scandinavian Journal of Forest Research 19(3): 217–233 Saranpää, P. 1983. The influence of basic density and growth ring width on the impact strength of spruce wood from south and north Finland. Silva Fennica 17(4): 381–388. Snowdon, P. 1991. A ratio estimator for bias correction in logarithmic regressions, Canadian Journal of Forest Research 21: 720–724. Zellner, A. 1962. An efficient method of estimating seemingly unrelated relations and tests for aggregation bias. Journal of the American Statistical Association 57: 348–367. Total of 33 references
Repola
Biomass Equations for Scots Pine and Norway Spruce in Finland
Appendix
Multivariate Model 2a Scots pine Above-ground biomass equations for pine (Table A1): Stem wood: ln( yki ) = b0 + b1
dSki hSki + b2 + b3 ln(t13 ki ) + u k + eki (dSki + 14) (hSki + 10)
( A1)
dSki + b2 ln(hki ) + u k + eki (dSki + 12)
( A 2)
Stem bark: ln( yki ) = b0 + b1
Living branches: ln( yki ) = b0 + b1
dSki hki + b2 + b3 ln(clki ) + u k + eki (dSki + 12) (hki + 8)
( A3)
dSki hki + b2 + b3 ln(clki ) + u k + eki (dSki + 4) (hki + 1)
( A4)
dSki + u k + eki (dSki + 16)
( A5)
dSki hki + b2 + b3crki + u k + eki (dSki + 12) (hki + 24)
( A6)
Needles: ln( yki ) = b0 + b1 Dead branches: ln( yki ) = b0 + b1 Total: ln( yki ) = b0 + b1
Multivariate Model 2b Norway spruce Above-ground biomass equations for spruce (Table A2): Stem wood: ln( yki ) = b0 + b1
dSki d + b2 ln(hki ) + b3hki + b4 Ski + + u k + eki t13 (dSki + 12)
( A 7)
dSki + b2 ln(hki ) + u k + eki (dSki + 18)
( A8)
Stem bark: ln( yki ) = b0 + b1
Living branches: ln( yki ) = b0 + b1
dSki hki + b2 + b3 ln(clki ) + u k + eki (dSki + 14) (hki + 5)
( A9)
641
Silva Fennica 43(4), 2009
research articles
Needles: ln( yki ) = b0 + b1
dSki hki + b2 + b3 ln(clki ) + u k + eki (dSki + 4) (hki + 1)
( A10)
dSki + ln(hki ) + u k + eki (dSki + 18)
( A11)
Dead branches: ln( yki ) = b0 + b1
Total (above-ground): ln( yki ) = b0 + b1
dSki + b2 ln(hki ) + b3crki + uk + eki (dSki + 20)
( A12)
Multivariate Model 3a Scots pine Above-ground biomass equations for pine (Table A3): Stem wood: ln( yki ) = b0 + b1
dSki hki + b2 + b3t13 ki + b4ig 5 ki + u k + eki (dSki + 9) (hki + 16)
( A13)
dSki d + b2 ki + b3bt ki + u k + eki (dSki + 8) t13 ki
( A14)
Stem bark: ln( yki ) = b0 + b1
Living branches: ln( yki ) = b0 + b1
dSki hki + b2 + b3 ln(ig 5 ki ) + b4 ln(clki ) + u k + eki (dSki + 10) (hki + 4)
( A15)
dSki hki + b2 + b3 ln(ig 5 ki ) + b4 ln(clki ) + u k + eki (dSki + 6) (hki + 1)
( A16)
dSki + b2 ln(clki ) + b3 ln(ig 5ki ) + b4t13 ki + u k + eki (dSki + 16)
( A17)
Needles: ln( yki ) = b0 + b1 Dead branches: ln( yki ) = b0 + b1
Total (above-ground): ( yki ) = b0 + b1
642
dSki hki + b2 + b3i5 ki + b4t13 ki + b5bt ki + u k + eki (dSki + 12) (hki + 18)
( A18)
Repola
Biomass Equations for Scots Pine and Norway Spruce in Finland
Multivariate Model 3b Norway spruce Above-ground biomass equations for spruce (Table A4) Stem wood: ln( yki ) = b0 + b1
dSki + b2 ln(hki ) + b3hki + b4t13 ki + b5i5 ki + u k + eki (dSki + 12)
( A19)
dSki + b2 ln(hki ) + b3bt ki + u k + eki (dSki + 16)
( A20)
Stem bark: ln( yki ) = b0 + b1
Living branches: ln( yki ) = b0 + b1
dSki hki d + b2 + b3crki + b4 ki + b5i5 ki + u k + eki (dSki + 18) (hki + 2) t13ki
( A 21)
dSki + b2 crki + b3 ln(i5 ki ) + u k + eki (dSki + 12)
( A22)
dSki + b2 ln(crki ) + b3crki + b4 ln(i5 ki ) + u k + eki (dSki + 14)
( A 23)
Needles: ln( yki ) = b0 + b1 Dead branches: ln( yki ) = b0 + b1
Total (above-ground): ln( yki ) = b0 + b1
dSki + b2 ln(hki ) + b3crki + uk + eki (dSki + 20)
( A24)
where yki = biomass component or total biomass for tree i in stand k, kg dSki = 2 + 1.25 dki (dki = tree diameter at breast height for tree i in stand k), cm hki = tree height for tree i in stand k, m clki = length of living crown for tree i in stand k, m t13ki = tree age at breast height for tree i in stand k btki = double bark thickness at breast height for tree i in stand k, cm i5ki = breast height radial increment during the last five years for tree i in stand k, cm ig5ki = cross-sectional area increment at breast height during the last five years for tree i in stand k, cm2
643
Silva Fennica 43(4), 2009
research articles
Table A1. The parameter estimates of multivariate model 2a. For the fixed parameters the standard error is given in parentheses. Variances and correlations of random stand parameters (unk) and residual errors (enki), and the empirical correction factor (c) for dead branches models, are given.
Fixed b0 b1 b2 b3 Random var(uk) var(eki) u2k u3k u4k u5k u6k e2ki e3ki e4ki e5ki e6ki c
644
Stem wood
Stem bark
Living branches
Needles
Dead branches
Total
Eq. A1
Eq. A2
Eq. A3
Eq. A4
Eq. A5
Eq. A6
N = 594 –4.018 (0.030) 8.358 (0.099) 4.646 (0.008) 0.041 (0.008)
N = 311 –4.695 (0.108) 8.727 (0.395) 0.228 (0.084) -
N = 856 –5.166 (0.084) 13.085 (0.246) –5.189 (0.259) 1.110 (0.050)
N = 856 –1.748 (0.476) 14.824 (0.431) –12.684 (0.723) 1.209 (0.062)
N = 847 –5.318 (0.173) 10.771 (0.295)
N = 249 –3.416 (0.039) 9.555 (0.098) 3.592 (0.116) 0.395 (0.030)
0.001 0.008 u1k –0.278 0.246 0.167 –0.683 0.495 e1ki 0.207 0.178 0.105 0.029 0.766
0.014 0.057 u2k
0.020 0.063 u3k
0.032 0.093 u4k
0.265 0.347 u5k
0.008 0.009 u6k
0.338 –0.284 0.433 0.314 e2ki
0.284 0.171 0.842 e3ki
–0.405 0.472 e4ki
–0.036 e5ki
e6ki
0.199 0.163 0.128 0.439
0.269 0.216 0.613
0.136 0.401
0.276 0.913
Repola
Biomass Equations for Scots Pine and Norway Spruce in Finland Table A2. The parameter estimates of multivariate model 2b. For the fixed parameters the standard error is given in parentheses. Variances and correlations of random stand parameters (unk) and residual errors (enki), and the empirical correction factor (c) for dead branches models, are given.
Fixed b0 b1 b2 b3 b4 Random var(uk) var(eki) u2k u3k u4k u5k u6k e2ki e3ki e4ki e5ki e6ki c
Stem wood
Stem bark
Living branches
Needles
Dead branches
Total
Eq. A7
Eq. A8
Eq. A9
Eq. A10
Eq. A11
Eq. A12
N = 366 –4.000 (0.060) 8.881 (0.203) 0.728 (0.056) 0.022 (0.003) –0.273 (0.040)
N = 170 –4.437 (0.101) 10.071 (0.588) 0.261 (0.123) -
N = 603 –0.085 (0.570) 15.222 (0.753) –14.446 (1.020) 1.273 (0.076) -
N = 609 –5.317 (0.235) 6.384 (0.886) 0.982 (0.207) -
-
N = 603 –3.023 (0.121) 12.017 (0.403) –5.722 (0.401) 1.033 (0.071) -
-
N = 166 –2.141 (0.073) 9.074 (0.250) 0.570 (0.056) 0.403 (0.059) -
0.003 0.008 u1k –0.149 –0.055 –0.313 0.087 0.595 e1ki 0.231 0.210 0.091 0.052 0.576
0.019 0.039 u2k
0.017 0.068 u3k
0.028 0.087 u4k
0.263 0.356 u5k
0.006 0.013 u6k
0.059 0.501 0.088 0.064 e2ki
0.531 –0.412 0.500 e3ki
–0.461 0.229 e4ki
–0.141 e5ki
e6ki
0.286 0.084 0.048 0.434
0.361 –0.015 0.757
0.058 0.391
0.086 1.208
645
Silva Fennica 43(4), 2009
research articles
Table A3. The parameter estimates of multivariate model 3a. For the fixed parameters the standard error is given in parentheses. Variances and correlations of random stand parameters (unk) and residual errors (enki), and the empirical correction factor (c) for dead branches models, are given.
Fixed b0 b1 b2 b3 b4 b5 Random var(uk) var(eki) u2k u3k u4k u5k u6k e2ki e3ki e4ki e5ki e6ki c
646
Stem wood
Stem bark
Living branches
Needles
Dead branches
Total
Eq. A13
Eq. A14
Eq. A15
Eq. A16
Eq. A17
Eq. A18
N =589 –4.590 (0.046) 8.520 (0.119) 5.013 (0.110) 0.002 (0.000) 0.002 (0.000) -
N = 274 –5.565 (0.165) 9.691 (0.252) –0.444 (0.103) 0.068 (0.014) -
N = 791 –4.833 (0.122) 13.126 (0.297) –4.808 (0.304) 0.098 (0.019) 0.727 (0.048) -
N = 791 –2.209 (0.512) 9.347 (0.425) –6.364 (0.784) 0.309 (0.023) 0.611 (0.065) -
N = 665 –5.798 (0.199) 17.820 (0.739) –0.738 (0.139) –0.461 (0.056) –0.017 (0.002) -
N = 251 –3.259 (0.040) 9.337 (0.110) 3.265 (0.122) 0.124 (0.011) 0.001 (0.000) –0.006 (0.003)
0.001 0.008 u1k –0.075 0.550 0.441 –0.428 0.852 e1ki 0.155 0.183 0.091 0.136 0.712
0.008 0.058 u2k
0.018 0.059 u3k
0.027 0.082 u4k
0.140 0.345 u5k
0.003 0.009 u6k
0.452 –0.223 0.472 0.307 e2ki
0.351 0.104 0.882 e3ki
–0.519 0.520 e4ki
–0.202 e5ki
e6ki
0.256 0.171 0.154 0.435
0.395 0.237 0.669
0.192 0.425
0.343 0.918
Repola
Biomass Equations for Scots Pine and Norway Spruce in Finland Table A4. The parameter estimates of multivariate model 3b. For the fixed parameters the standard error is given in parentheses. Variances and correlations of random stand parameters (unk) and residual errors (enki), and the empirical correction factor (c) for dead branches models, are given.
Fixed b0 b1 b2 b3 b4 b5 Random var(uk) var(eki) u2k u3k u4k u5k u6k e2ki e3ki e4ki e5ki e6ki c
Stem wood
Stem bark
Living branches
Needles
Dead branches
Total
Eq. A19
Eq. A20
Eq. A21
Eq. A22
Eq. A23
Eq. A24
N = 365 –3.950 (0.060) 8.534 (0.203) 0.743 (0.055) 0.022 (0.003) 0.001 (0.000) –0.071 (0.017)
N = 164 –4.626 (0.100) 9.638 (0.591) 0.266 (0.117) 0.084 (0.027) -
N = 567 –3.950 (0.301) 12.014 (0.315) –1.296 (0.464) 1.528 (0.116) –0.461 (0.121) 0.112 (0.046)
N = 584 –4.258 (0.154) 9.200 (0.163) 0.967 (0.118) 0.287 (0.024) -
N = 166 –2.037 (0.072) 9.146 (0.227) 0.543 (0.050) 0.296 (0.059) -
-
N = 580 –0.140 (1.429) 11.293 (0.374) 3.058 (0.960) –7.014 (1.492) –0.189 (0.058) -
0.003 0.008 u1k –0.284 –0.007 –0.115 –0.124 0.521 e1ki 0.243 0.223 0.079 0.035 0.587
0.013 0.042 u2k
0.011 0.067 u3k
0.022 0.068 u4k
0.196 0.278 u5k
0.007 0.013 u6k
–0.003 0.558 0.190 –0.029 e2ki
0.753 –0.403 0.628 e3ki
–0.415 0.611 e4ki
–0.259 e5ki
e6ki
0.395 0.171 0.090 0.502
0.294 0.031 0.743
0.066 0.467
-
-
0.094 1.091
647


![Comparison of Norway spruce (Picea abies [L.] Karst.), Scots pine ...](https://m.moam.info/img/260x300/comparison-of-norway-spruce-picea-abies-l-karst-sc_5b7c65e7097c47ce728b45a0.jpg)