Paleobiology, 35(3), 2009, pp. 321–342
Biomechanics, functional patterns, and disparity in Late Devonian arthrodires Philip S. L. Anderson
Abstract.—Studies of ecological structure and diversity over time in extinct groups have always been challenged by the inability to observe the behavior of fossil taxa directly. The only available evidence for function, behavior, and interactions between taxa is the morphological characteristics of the preserved fossils. Recent studies on modern groups have shown that morphological analyses may give misleading results in terms of ecological pattern and diversity. An alternative approach is to focus on functionally relevant aspects of morphology through a paleobiomechanical paradigm. The purpose of this research is to examine variation in the lower jaw morphology in Late Devonian arthrodire placoderms and develop biomechanical metrics that can be used to quantify functional diversity among this fossil group. Nine functionally relevant morphological characters were collected for 94 isolated arthrodire inferognathals from the Gogo Formation in Western Australia and the Cleveland Shale in Ohio. These data were used to address aspects of functional morphology, biomechanical disparity, and ecological structure in arthrodire placoderms from the Late Devonian. Results were compared with results from previous morphometric work on the same set of jaws. Statistical tests show a significant difference in functional characters between the two faunas. The differences may be related to phylogenetic differences between faunas, as the two major clades of arthrodire taxa included in this study are almost completely segregated between faunas. Average pairwise disparity analyses of the mechanical characters indicate that there is no significant difference in overall functional diversity between the Cleveland Shale and Gogo Reef arthrodire faunas. This result is at odds with previous results that show overall morphological disparity to be much higher in the Cleveland Shale. Clustering patterns within a multivariate function-space show tightly constrained functional groups of taxa independent of phylogenetic or shape-based morphological similarity. These functional groups illustrate a level of ecological diversity in Late Devonian arthrodires that is comparable to that in certain modern faunas. Further statistical analysis of the morphological and functional disparity of these Late Devonian taxa shows a disjoint between the two measures. Model I regression analysis of and Spearman rankcorrelation analysis of average pairwise morphological and functional disparity measures indicate no significant relationship between morphological and functional disparity among the jaws used in this study. Although function is obviously derived from morphology, these results show that morphological shape analysis is not necessarily a good proxy for eco-functional diversity. Philip S. L. Anderson. Department of Geophysical Sciences, University of Chicago, Chicago, Illinois 60637 Present address: Department of Earth Sciences, University of Bristol, Wills Memorial Building, Queen’s Road, Bristol BS8 1RJ, United Kingdom. E-mail:
[email protected] Accepted: 14 January 2009
Introduction How the diversity and structure of ecological communities change through the fossil record is a key question in the field of paleobiology. It is not possible to observe the interactions of fossil organisms directly, so proxies of ecological roles must be used to quantify ecological diversity through time. One method of paleoecological analysis has been to assign fossil taxa to a priori ecological modes of life or ‘‘guilds.’’ Large-scale ecological changes are then identified from changes in the taxonomic composition of the various guilds (Droser et al. 1997, 2000; McGhee et al. 2004). A recent example of this method places marine invertebrate taxa ’ 2009 The Paleontological Society. All rights reserved.
into 216 life modes on the basis of factors such as relative heights above the substrate/water interface (tiering) (Ausich and Bottjer 1982; Bottjer and Ausich 1986), motility, and feeding strategy (Bambach et al. 2007). Using this method to examine the Late Devonian extinction has shown that there was a lot of taxonomic change over this boundary (particularly in brachiopods and reef-building organisms) (Copper 1994; Droser et al. 2000). However, the new taxa in the Carboniferous are filling the same basic ecological roles from the Devonian. A similar trend, taxonomic change but stability in ecological structure, is seen in the Late Ordovician event (Brenchley et al. 2001). Although this method offers profound insights into taxonomic diversity and shifts in the ecology of specific taxonomic 0094-8373/09/3503-0002/$1.00
322
PHILIP S. L. ANDERSON
clades over time, it doesn’t address changes in the overall ecological structure at a functional level. Recent studies of our modern biodiversity crisis have begun to focus more on how the loss of species affects ecosystem functioning (Chapin et al. 2000; Tilman 2000). Understanding how the loss of a species will affect the functional interactions within an ecosystem is key to understanding how biodiversity affects ecosystem structure. By using functional analyses to evaluate the performance and/or resource use of organisms, it is possible to use ecological factors rather than purely taxonomic status to evaluate ecological diversity patterns (Arnold 1983). Functional analysis methodology has been used to study ecological patterns across a variety of taxa including bats (Norberg 1994), sunfish (e.g., Huckins 1997), and even marine algae (Steneck 1997). A study of reef fish in three distinct biogeographical regions with a fivefold difference in species richness and almost no taxonomic overlap showed—on the basis of fin mechanics and habitat use—that these disparate faunas all followed underlying assembly rules at a functional level (Bellwood et al. 2002). One possible approach to understanding the functional diversity and ecological structure of a fossil fauna at a functional level is through ecomorphology. Ecomorphology is concerned with, among other things, estimating the ecological relationships among taxa from their positions in a multivariate morphospace (Ricklefs and Miles 1994). This method would allow paleontologists to identify functional groups (groups of taxa with similar functional characteristics) within a fauna in order to examine changes in both biodiversity and ecosystem structure through time. The implicit assumption is that there is a relationship between morphology and ecology via the mechanical function of organisms. If the functional consequences of morphology can be quantified, it should be possible to get a sense of ecological change from morphological change. Studies of morphological diversity in fossil taxa have shown that the pattern of morphospace occupation over time is a powerful tool
for exploring diversity trends in the fossil record (Foote 1991, 1992, 1997). Morphological diversity measures can show very different patterns within and between lineages when compared with taxonomic measures (Foote 1993; Roy and Foote 1997). Morphospace occupation over time has been explored in a number of fossil groups including gastropods (Wagner 1995), angiosperms (Lupia 1999), ammonoids (Saunders and Work 1996) and mammals (Jernvall et al. 1996). The morphological data used for these studies are usually based on either landmark data or discrete morphological characters describing overall shape. Although this type of morphological measurement likely includes functionally relevant features, a good deal of relevant functional morphology is not considered (Foote 1994). In order to identify ecological change in the morphospace of fossil taxa, it is necessary to identify morphological features of functional and mechanical consequence (Foote 1997). To incorporate ecologically relevant data into a morphospace analysis, some paleontological studies take measurements from morphological features directly related to function, such as limb bones in tetrapods (for review see: Van Valkenburgh 1994). However, recent studies of feeding mechanics in modern fishes have shown that even when general morphological measures of a functional system are used to estimate functional diversity, they give a different pattern than the resulting mechanical metrics calculated from the same morphological features (Hulsey and Wainwright 2002; Collar and Wainwright 2006). This discrepancy is partly due to convergence in function among morphologically dissimilar taxa. Hulsey and Wainwright (2002) examined how the mechanics of the jaw system in a group of Great Barrier Reef labrid fishes map onto a morphospace based on overall shape. The four-bar linkage system in labrid jaws (Westneat 1990, 1994) is directly compared with a morphospace constructed from the linkage system’s constituent length measures (Hulsey and Wainwright 2002). Results show that equal-sized regions of morphospace often differed by over an order of magnitude in mechanical disparity, illustrating that similar morphologies could
BIOMECHANICS AND DISPARITY IN ARTHRODIRA
323
result in vastly different functional consequences (Hulsey and Wainwright 2002). Collar and Wainwright (2006) compared mechanical performance of the suction-feeding system in centrarchid fishes (Carroll et al. 2004) with the underlying morphology of the jaw and hyoid elements. Patterns of suction capacity among the centrarchid clades were shown to be discordant with patterns of morphological evolution within clades (Collar and Wainwright 2006). These studies show that the evolutionary history of functional systems inferred from morphological disparity based on simple description of the parts may be misleading. What is required is an analysis of morphological disparity based in an explicit, biomechanical framework to understand how the morphological parts interact as a functional system. The purpose of the research reported here is to explore the functional and ecological diversity of Late Devonian arthrodire placoderms in a biomechanical framework. I develop a series of biomechanical metrics that can be measured from the preserved hard parts, the lower jaws. These metrics are then used to estimate and compare functional morphological disparity within lineages and faunas and to try to identify functional groups (clusters of taxa with similar functional characteristics) within the faunas. The disparity patterns that emerge from the biomechanical data are compared with disparity patterns resulting from another morphological data set of landmark-based shape data (Anderson 2008), similar to what has been used in other fossil groups (Foote 1997).
Recent phylogenetic analyses have questioned placoderm monophyly, suggesting they comprise a series of stem-gnathostome taxa (Brazeau 2009). Arthrodira is the largest and most diverse placoderm order (Carr 1995). Arthrodires have been classified into four morphotypes (actinolepimorphs, phlyctaenomorphs, coccosteomorphs, and pachyosteomorphs) (Miles 1969). Miles based these groupings on observed skull and thoracic armor morphology. Subsequent phylogenetic analyses to test for monophyly within these groups have had varying degrees of success (Goujet 1984; Carr 1991, 2004; Gardiner and Miles 1994; Dupret 2004). Coccosteomorphs and pachyosteomorphs represent the more diverse clades within Arthrodira (Carr 1991, 1995; Gardiner and Miles 1994). A review of phylogenetic analyses of these groups shows general agreement in the sister-group relationship of coccosteomorphs and pachyosteomorphs, but much disagreement in the assignment of basal taxa (Carr 2004). Here these two morphotypes are treated as distinct monophyletic sister clades. Recent landmark-based morphometric analyses have shown that although these clades were originally separated on the basis of skull morphology, the average jaw shapes of coccosteomorphs and pachyosteomorphs are significantly different (Anderson 2008). Shape differences between the two groups indicate possible functional differences, although no direct testing of functional metrics between groups has previously been done.
Arthrodires
My research uses a series of nine functional characters to investigate differences in morphology and function between arthrodire morphotypes and faunas. A previous paper identified basic differences in overall lower jaw shape between coccosteomorph and pachyosteomorph arthrodires using the same set of lower jaws (Anderson 2008). Here I test to see if these differences in shape result in functional differences between the groups. I also test for differences in functional patterns and diversity between arthrodires from two faunas (the Gogo Reef fauna in Australia and
Placoderms are a class of basal gnathostomes known from the Silurian and Devonian Periods and found in numerous environments including deltaic/lagoonal facies, reef settings, open sea, sandy shorelines, and even freshwater lakes and rivers (Janvier 1996). Placoderms are characterized by dermal armor composed of interlocking plates that covers the head and the anterior portion of the trunk. The pattern of plate morphology in the skull and thoracic regions varies greatly among groups, often defining phylogenies.
Goals
324
PHILIP S. L. ANDERSON
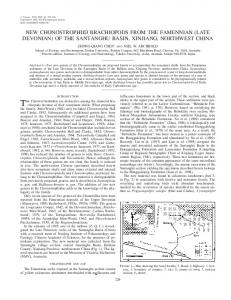
FIGURE 1. A, Lower jaw of Dunkleosteus terrelli (CM5300). Basic divisions of the bone are marked; anterior to the left. (Figure modified from Anderson 2008.) B, Some of the functional characters used in this analysis. The ratio of inlever to outlever equals mechanical advantage. The outlever shown is for the anterior most point and represents Anterior Mechanical Advantage. The inlever is measured to the point of maximum second moment of area on the blade. This is also where Maximum Second Moment of Area is measured in the cross-section. The ratio of dental depth to dental length equals the dental aspect ratio (DAR). Scale bar, 10 cm.
the Cleveland Shale fauna in Ohio) and attempt to identify possible functional groups within and between faunas. Potential posthoc functional groups are tested to ensure that they are statistically significant clusters within functional morphospace. Finally, I compare disparity results from the previous landmark-based morphometric analysis (Anderson 2008) with disparity results from this functional analysis in order to test for correlations between patterns of biodiversity based on the two different types of data. Methods Materials Lower jaw specimens from 23 arthrodire genera were photographed and measured for this study. Only complete specimens were used, unless fragmented ones could be reassembled for photography. Each jaw was photographed from lateral view. All images are oriented with the anterior tip to the left, and the dorsal edge facing up (Fig. 1A). A total of 94 jaws from the 23 taxa were included: 43
FIGURE 2. Relationships between the six arthrodire families represented by the 94 arthrodire jaws in this study. Although Eastmanosteus and Dunkleosteus are often considered members of the dinichthyid family, they tend to fall on the pachyosteomorph stem in phylogenetic analyses. This cladogram is constructed from previous studies (Carr 1991; Long 1995).
coccosteomorphs and 51 pachyosteomorphs. The coccosteomorph jaws include ten genera from three families. The pachyosteomorph jaws include ten genera in three families and two indeterminate genera (see Appendix for a full specimen list). The phylogenetic relationship among these six families, shown in Figure 2, was constructed from cladistic analyses taken from several sources (Carr 1991, 1995; Gardiner and Miles 1994; Long 1995). See Anderson (2008) for a full discussion of the classification assignments in the Appendix. Figure 1A shows a lower jaw element of the arthrodire taxon Dunkleosteus terrelli. A few key features are labeled for reference. The jaw can be divided into two portions, the posterior ‘‘blade’’ and the anterior dental portion. The ‘‘blade’’ refers to the area behind the dentition where the jaw-closing musculature attached. At the posterior end of the jaw, an articular cartilage of the jaw joint would have been present in life. This cartilage is preserved in some specimens. The front half of the jaw, where the dentition lies, is the dental portion. This portion is slightly thicker than
BIOMECHANICS AND DISPARITY IN ARTHRODIRA
the ‘‘blade’’ in the mesial-lateral axis. The dental surface lies on the dorsal edge of the dental portion and exhibits a wide range of morphologies, from the fang-and-edge design in Dunkleosteus to rows of denticles or flat crushing surfaces in other genera. All of the jaw specimens used in this study come from one of two distinct Late Devonian faunas: the Gogo Formation of Western Australia and the Cleveland Shale of Ohio. The Gogo is a Frasnian basinal shale deposit that lies between the fossil reef mounds and atolls of the Canning Basin (Teichert 1943; Playford 1980). The Gogo shales contain carbonate nodules formed around the carcasses of reef fish, including placoderms. These nodules are prepared in 10% acetic acid, which leaves a three-dimensional, ultra-detailed fossil that can be reconstructed to give an accurate, articulated skull. Most still have perichondrally ossified cartilage preserved, allowing for precise muscle reconstructions and articulations. The majority of arthrodires found in the Gogo are coccosteomorphs (Long and Trinajstic 2000), mostly camuropiscids and incisoscutids. There are a few pachyosteomorphs, including the basal dinichthyid Eastmanosteus, and a couple of other genera: Kimberleyichthys and Bullerichthys (Gardiner and Miles 1994; Long and Trinajstic 2000). The Cleveland Shale is an anoxic black shale deposit that accumulated in an open basin environment as part of a marine epicontinental sea (Prosser 1913; Jaminski et al. 1998). It is unclear whether the anoxia in black shales such as the Cleveland was due to depth or other environmental factors (Wignall 1994). Regardless, placoderm armor plates and jaws have been found intact and relatively undeformed (some flattening is seen) within this deposit. The Cleveland Shale is best known for large dinichthyids (such as Dunkleosteus), but it also has numerous mylostomatids, titanichthyids, and selenosteids. All of these are pachyosteomorph arthrodires (Carr 1995). Landmark Data Previously published landmark-based morphometric data (Anderson 2008) were used for comparison with the biomechanical measurements. These data are based on nine
325
landmarks defining the lateral-shape morphology of the 94 lower jaws. PCA analyses were performed using these data and the resultant scatterplots are compared with those from the functional analysis. (For a full review of the morphometric methods and analysis see Anderson 2008). Functional Characters Nine biomechanically relevant morphological measurements (functional characters) were developed to quantify the functional disparity among the placoderm specimens and between morphotypes (coccosteomorphs and pachyosteomorphs) and faunas (Gogo reef and Cleveland Shale). Anterior Mechanical Advantage (AMA).—The lower jaw of a gnathostome can be modeled as a third-order lever (Barel 1983; Westneat 1994). The amount of force transferred through a lever is proportional to the ratio of the inlever (distance from fulcrum to where force is applied to the lever) to the outlever (distance from the fulcrum to the point where the force is applied by the lever). This metric has been shown to correlate well with preferred prey type in fishes (Westneat 1994; Wainwright and Richard 1995). For the arthrodire jaws in this study, the quadrate articulation is treated as the fulcrum. The quadrate cartilage is not always preserved; however, it is possible to estimate its placement from the placement in other jaws. The error associated with these estimations has negligible effect on the resulting metrics. The inlever is measured from the quadrate to where the adductor muscle inserts on the posterior ‘‘blade’’ portion (Fig. 1B). This point is not marked on the fossils, because the muscles likely attached directly to cartilage which is generally not preserved. To circumvent this difficulty, I chose to reconstruct the end of the inlever at the point along the dorsal edge of the posterior ‘‘blade’’ with the highest second moment of area (see below). This feature locates the point of maximum flexural stiffness (and, by implication, maximum bending moment) along the posterior portion of the jaw. Two alternative outlevers were measured on each jaw. The outlever for AMA was measured from the fulcrum to the tip of the anteriormost
326
PHILIP S. L. ANDERSON
dental element (Fig. 1B). This represents the point along the jaws with the lowest mechanical advantage and fastest rotation. Posterior Mechanical Advantage (PMA).— This measurement is the same as AMA except the outlever was measured from the fulcrum to the posteriormost point on the dental row. This definition estimated the highest force transfer possible on the jaw (the highest mechanical advantage within the toothed portion of the jaw). Given that the dental rows of different arthrodire taxa are neither equal in length nor equal in terms of percent of the entire jaw (Miles 1969); the MA values calculated using these alternative definitions should be independent. Maximum Second Moment of Area (MAXI).— Second moment of area (I) is a measure of how material is distributed around a given axis in the cross-section of a beam (Wainwright et al. 1976); it is an indicator of the resistance of the beam to bending. This measure has been used to investigate jaw flexural stiffness and function in modern animals such as hornsharks (Summers et al. 2004). The second moment of area increases as material is moved away from the center of mass in a cross-section. To maximize resistance to bending, the peak second moment of area along a beam should coincide spatially with the peak bending moment. In a jaw, the peak bending moment will occur where the net adductor force acts (Fig. 1B). In order to estimate MAXI, I assumed that the cross-section of the lower jaw was composed of uniform material and elliptical. Neither of these assumptions is strictly true, but for comparative purposes they are reasonable. The second moment of area of an ellipse is given by the equation: pab3 4{1 where a is half the length of the axis oriented perpendicular to the force being applied and b is half the length of the axis oriented parallel to the force being applied. Second moment of area has units of distance to the fourth power. In order to make MAXI dimensionless, the value calculated was divided by the second moment of area of a cylindrical cross-section with the same cross-sectional area as the jaw
section. This makes MAXI a measure of how much better the jaw is at resisting bending in a given plane than a circular cylinder of the same size. Average Second Moment of Area (AVEI).— Second moment of area was calculated as above at regular intervals (10% of total length) along the blade portion of the jaws. The average value was then calculated, thus giving a measure of average overall stiffness of the blade. Cusp Angle (CUSP).—This is a dental character that can be measured for all the jaws used. A similar metric has been used to estimate the force and energy required to cut through various materials (Evans and Sanson 1998, 2003). Any fracture started when the cusp of a tooth or dental surface contacts a food item must be sustained and propagated. The friction produced during fracture propagation is directly related to the angle of the cusp (Lucas 2004). Cusp angle was estimated as the angle between the two sides of the tooth in lateral view taken from where they intersect with the jaw (Fig. 3). In taxa with blunt crushing surfaces as opposed to denticles, this was measured as the angle of the convex surface. Quadrate Offset (QUAD).—In mammals, the placement of the jaw joint relative to a line tangent to the lower tooth row affects the occlusion between the upper and lower teeth (Turnbull 1970; Greaves 1974; Herring 1993.). If the jaw joint lies along a the tangent line, the upper and lower dentitions will occlude like a pair of scissors, coming in contact starting at the posterior ends and closing gradually anteriorly. However, if the jaw joint lies above the tooth row tangent line, the upper and lower teeth will come together all at once, like a vise. Generally speaking, a scissor-like occlusion is found in carnivorous mammals which need to slice through flesh. The vise-like occlusion is generally found in herbivores and other mammals that need to crush their food with more force. Recent work on modern sharks has shown vise-like occlusion patterns in bamboo sharks and other elasmobranches (Ramsay and Wilga 2007). This type of occlusion ensures not only that the entire dental row occludes all at once, but also that the force vectors acting on the prey item will actually hold the prey in
BIOMECHANICS AND DISPARITY IN ARTHRODIRA
FIGURE 3. Lower jaw of Torosteus (WAM011109) illustrating the functional character Cusp Angle (CUSP). CUSP is defined as the angle between the two sides of a tooth or denticle and is related to the ability of the tooth to wedge itself into a fracture once it has been initiated.
place (Ramsay and Wilga 2007). For the arthrodire jaws, I drew a line tangent along the jaw dentition and measured how far off of this line the jaw joint lay (Fig. 4). This allows for scissor-like (Fig. 4A) and vise-like (Fig. 4B) occlusion patterns to be quantified. The offset distance was divided by overall length in order to make the value QUAD dimensionless. Dental Aspect Ratio (DAR).—The dental portion of an arthrodire jaws is quite irregular
327
in cross-section, complicating the estimation of second moment of area. As a proxy for the stiffness and sturdiness of the dental portion, I measured the ratio of the depth (maximum dorsal-ventral dimension) of the dental portion to the length of the dental portion. Values close to 1 indicate a deep dental portion, whereas values closer to 0 indicate a shallower, gracile dental portion. The deeper the dental portion is, the stiffer and more resistant to bending it is, because more material is oriented along the axis parallel to dorsoventral forces (see discussion on second moment of area). Percent Dentition (%DENT).—The percentage of the overall length of the jaw covered by the dentition. This metric is an indication of how much the taxon can vary its bite force and the rotation speed by manipulating prey along the dental surface. The higher this metric, the higher the range of bite forces possible due to differing mechanical advantages at work at different points along the dentition. Length (LEN).—Overall length of the lower jaw, measured from the back part of the blade to the anterior most point on the dental portion. Although I have tried to keep the other characters size-independent, size is an
FIGURE 4. Quadrate offset (QUAD), defined as the distance between the quadrate articulation and a line drawn parallel and tangent to the dentition. A, Incisoscutum (WAM869683), which shows almost zero quadrate offset. The occlusal line runs right through the quadrate joint (scale, 1 cm). B, Heintzichthys (CM8097), which shows a much greater amount of quadrate offset (scale, 10 cm).
328
PHILIP S. L. ANDERSON
important factor in fish ecology. Jaw length is a proxy for the size of the gape in these fishes. Functional Analyses The nine functionally relevant morphological characters (herein referred to as functional characters) were measured on the 94 arthrodire lower jaw specimens to create a data matrix used to construct a multivariate function-space. There data were analyzed using SPSS 11.0 for MacOS X. The character values were normalized by dividing each measurement by the average value of that character over the entire data set. One-sample Kolmogorov-Smirnov tests were done to check these functional characters for normality. General statistics (e.g., mean and standard deviation) were calculated for each character and Student’s ttests were performed to compare averages of each character between the coccosteomorph and pachyosteomorph morphotypes. The latter analysis was done to identify functional characters that differed statistically between the two morphotypes. Functional characters found to differ statistically between the morphotypes were compared with the results of a previous morphological analysis (Anderson 2008). I used bivariate plots and bivariate regression analysis to test for correlations and significant relationships between the various functional characters. These correlations between functional characters are not corrected for phylogeny, and therefore may not be statistically independent (Felsenstein 1985). Factor analysis was performed to extract principal coordinates (PCs) from the correlation matrix of the normalized functional characters. Resulting PC axes were plotted and examined for outliers and clustering patterns among the taxa. The principal coordinates analysis (PCA) was also done on a matrix excluding the length metric, and the locations along the resulting axes were regressed against length in order to check for size effects. Separation of group means between the two faunas (Gogo Formation and Cleveland Shale) was tested using Hotelling’s T2 test (the multivariate equivalent of a Student’s t-test) (Zelditch et al. 2004). The function-based PCA is used to identify post-hoc functional groups of arthrodire taxa,
which potentially represent possible arthrodire ecological niches. The functional groups are composed of taxa whose jaws cluster together in function-space to the exclusion of other taxa, indicating similar functional abilities. Functional groups are initially identified by visual inspection of the clustering patterns of the jaws in function-space, and then tested for significant separation using canonical variate analysis (CVA) in the statistical program PAST (Hammer et al. 2001). The individual functional characters are also tested for significant differences between the functional groups in order to identify which characters cause the separation in function-space. The functional groups are also plotted in the landmark-based morphospace and tested for significant morphological separation using CVA methods. Disparity In order to compare the amount of morphological and functional diversity within the faunas and the post-hoc functional groups, disparity measures are calculated for the biomechanical data set and compared with disparity measures based on previously published landmark morphometric data (Anderson 2008). Disparity is a comparative measure, used to quantify morphological differences between specimens. There is no consensus on a specific method for calculating disparity, although many methods exist (for a full review, see Wills 2001). In this paper I used average pairwise Euclidean distance within a group, a method used extensively by other authors (e.g., Foote 1995, 1997; Wills et al. 1994). Average pairwise disparity has been shown to be useful for comparison of taxonomic or other groupings because it is relatively immune to sample-size bias (Ciampaglio et al. 2001; Erwin 2007). Disparity measures are calculated for both faunal and all functional subgroups for each data set. Significant differences in disparities between faunas or functional groups are tested for using bootstrap resampling. One thousand bootstrap samples are generated for each subset of data and used to calculate the 95% confidence interval for the disparity of each subgroup. These confidence intervals are then compared between subgroups.
BIOMECHANICS AND DISPARITY IN ARTHRODIRA
Because of differences in the data between the morphological and mechanical data sets, it is not possible to directly compare the calculated disparities. In order to get around this problem, the pairwise distances in the morphological and mechanical data sets are directly compared to each other using model I Regression and correlation analyses. These analyses test for significant relationships between the morphological and mechanical disparities and quantify how strong that relationship is. In order to assess whether significant differences exist in the arrangement of specimens in morphospace versus functionspace, a rank-order analysis of the pairwise distances between specimens is performed. The values in the pairwise distance matrix for each analysis were compared with each other using Spearman rank correlation. This analysis tested whether there is a significant relationship in the clustering patterns between the two data sets and how strong that relationship is. A high correlation indicates that the same jaws plot near each other in both the morphospace and function-space. A low correlation would indicate that different sets of jaws plot near each other in the two analyses; i.e., the jaws are clustering differently. Results Functional Characters Kolmogorov-Smirnov tests reveal that the functional characters—anterior mechanical advantage (AMA), posterior mechanical advantage (PMA), quadrate offset (QUAD), dental aspect ratio (DAR), and percent dental length (%DENT)—are all normally distributed among the arthrodire jaws. Student’s ttests show that measurements for these five characters are significantly higher among pachyosteomorph arthrodires than coccosteomorphs (p , 0.05). Mann-Whitney nonparametric tests show, on the other hand, that the two second-moment-of-area-characters (MAXI and AVEI) have significantly higher values in coccosteomorphs (p , 0.001) and that pachyosteomorphs are significantly larger (LEN, p , 0.001). CUSP is the one functional character that is not significantly different between morphotypes.
329
A series of bivariate plots and correlations analyses (not shown) shows that most of the characters do not correlate highly with each other among the arthrodire jaws. The only relationships that show high correlations are between the two mechanical advantage measures (AMA and PMA, r2 5 0.912) and the two second-moment-of-area characters (MAXI and AVEI, r2 5 0.883). The character showing the strongest correlation with length is AMA (r2 5 20.554). PCA/CVA of Functional Characters Factor analysis done on the mechanical data matrix resulted in nine principal components, four of which show eigenvalues above 1.0 and six of which combine to account for over 93% of the overall variation. Table 1 shows the eigenvalues and percent of total variances for the first six components, as well as the loadings of all nine functional characters onto those components. No single PC axis accounts for more than 36% of the total variance and most PC axes correlate highly with several functional characters. The same analysis was done without the length variable, but the resulting pattern and statistics are essentially the same. Model I regression of the PC axis from this latter analysis against the length metric shows that only PC 1 has a significant relationship with length (p , 0.001). The full analysis shows that length does have a high loading on the first PC, but so do several other metrics. Figure 5 shows two plots of PC axes 1-4 highlighting the two faunas. These plots show substantial overlap between the two faunas on all four axes. Regardless of overlap, the Hotelling’s T2 test shows significant difference in mean values in the function-space between the two faunas (p , 0.0001). Independent Student’s t-tests show greater average AMA and PMA values (p , 0.001) among the Cleveland Shale arthrodires. Mann-Whitney tests show greater average MAXI, AVEI, and CUSP values (p , 0.003) in the Gogo Formation and greater LEN in the Cleveland Shale (p , 0.001). Figure 6A shows PC axes 1 and 2 and highlights members of the four post-hoc functional groups identified via inspection of the functional PCA. These groups are
330
PHILIP S. L. ANDERSON
TABLE 1. Top, Eigenvalues and percent variances for the first six PCs based on nine functional characters and the loadings for four of the variables on each PC. Bottom, Loadings for the remaining five variables on each PC. Abbreviations: AMA, anterior mechanical advantage; PMA, posterior mechanical advantage; MAXI, maximum second moment of area; AVEI, average second moment of area; LEN, jaw length; CUSP, cusp angle; QUAD, quadrate joint offset; DAR, dental aspect ratio; %DENT, percentage of jaw with dentition. PC Eigenvalue Variance AMA
MAXI AVEI
1 2 3 4 5 6
3.191 1.660 1.223 1.011 0.723 0.645
PC
LEN
CUSP
QUAD
DAR
%DENT
0.800 0.097 20.146 20.131 0.085 0.139
20.072 20.291 0.751 0.163 0.548 0.130
0.342 20.283 0.605 20.024 20.610 0.254
0.635 0.232 20.205 20.277 0.174 0.560
0.145 20.218 20.306 0.880 20.027 0.246
1 2 3 4 5 6
36.5% 18.4% 13.6% 11.2% 8.0% 7.2%
PMA
0.782 0.730 20.709 20.598 0.473 0.517 0.616 0.717 0.283 0.129 0.119 0.154 0.082 0.305 0.098 0.074 0.067 20.059 20.033 20.067 20.214 20.238 0.177 0.189
based on sets of taxa whose jaw specimens cluster with each other to the exclusion of other jaws within the function-space. CVA verifies that significant separation exists between the functional groups (Wilk’s lambda 5 0.01426, p , 0.001) and post-hoc Hotelling’s pairwise analysis verifies that all four groups are significantly different from each other (p , 0.001) on the basis of the functional characters. These statistical tests show that the post-hoc defined groups identified via inspection are separate from one another in the functionspace. The first group is composed of Cleveland Shale forms notably Dunkleosteus, Mylostoma, and Heintzichthys. The second group comprises several Gogo forms, such as Campagopiscis and Incisoscutum. The third group is composed primarily of two taxa, Torosteus and Eastmanosteus. The fourth group is a small cluster of taxa from both faunas and both morphotypes identified by having the lowest average mechanical advantages. Analysis of variance (ANOVA) tests show that all the individual functional characters except for %DENT show significant differences between the four mechanical groups (AMA, F 5 32.916, d.f. 5 3, p , 0.001; PMA, F 5 26.615, d.f. 5 3, p , 0.001; MAXI, F 5 111.963, d.f. 5 3, p , 0.001; AVEI, F 5 45.938,
d.f. 5 3, p , 0.001; QUAD, F 5 4.188, d.f. 5 3, p , 0.01; LEN, F 5 100.580, d.f. 5 3, p , 0.001; DAR, F 5 26.018, d.f. 5 3, p , 0.001; CUSP, F 5 5.915, d.f. 5 3, p , 0.001). Bonferroni posthoc tests were done to further identify the functional differences between groups. Group 1 (Dunkleosteus) contains the largest jaws (p , 0.001) and these specimens have significantly higher AMA and PMA values (p , 0.001) than the other groups. Group 1 also shows some of the largest QUAD values, although this character is not significantly different between all groups. Group 2 (Campagopiscis) shows higher MAXI and AVEI values than the other four groups (p , 0.001) and some of the smallest QUAD values (p , 0.001). Group 4 (the smallest number of specimens) is distinguished as having the lowest average AMA and PMA values (p , 0.01). There is no functional character for which the values for specimens in Group 3 (Torosteus/Eastmanosteus) are the highest or smallest. As seen in the PC plots, Group 3 consistently falls in the middle of each axis. Figure 6B shows members of the four functional groups labeled on PCs 1 and 2 of the landmark-based morphospace (Anderson 2008). The functional groups show a good deal of overlap when plotted in morphospace. Groups 1 and 4 show a particularly large amount of spread in morphospace. Group 1 gets split and separates with Groups 2 and 3 in between. The obvious separation and clustering patterns seen in the function-space (Fig. 6A) are lost in morphospace. Disparity The Cleveland Shale arthrodire fauna shows significantly higher average pairwise disparity based on the morphometric data set previously published (Anderson 2008) (Gogo disparity 5 0.135; Cleveland disparity 5 0.1692; p , 0.05). There is no significant difference in average pairwise disparity between the two faunas based on the mechanical data set based on 1000 bootstrap resamples. A similar pattern is seen when comparing disparity between the morphotypes. The jaws of pachyosteomorphs examined in this study show a higher level of morphological disparity than those of coccosteomorphs examined (pachyosteomorph dis-
BIOMECHANICS AND DISPARITY IN ARTHRODIRA
331
FIGURE 5. Functional PCA plots of axis 1 versus 2 and axis 3 versus 4, highlighting the two faunas: Gogo Reef Fauna (black diamonds) and the Cleveland Shale Fauna (open squares). The only axis that shows clear separation is PC1, although there is some overlap. CVA/MANOVA analysis does separate the two faunas on the basis of functional characters (p , 0.001).
parity 5 0.172; coccosteomorph disparity 5 0.131; p , 0.05). However, the two morphotypes show no significant difference in mechanical disparity based on 1000 bootstrap resamples.
Figure 7 is a plot of the individual pairwise distances between all 94 jaws taken from the landmark-based morphometric data against the same pairwise distances based on the biomechanically relevant data. There appears
332
PHILIP S. L. ANDERSON
FIGURE 6. The four post-hoc functional groups plotted along the PC axis of both the functional and morphological analyses. The four groups are Group 1 (Choppers/Crushers, black diamonds); Group 2 (Biters, open squares); Group 3 (Generalists, gray triangles); Group 4 (Pickers, crosses). See text for definition of the groups. A, The four functional groups plotted on PCs 1 and 2 of the functional analysis. Very little overlap is seen between the groups. The outline silhouettes are of representative lower jaws from each group and are not to scale. B, Morphometric PCs 1 and 2 highlighting the four mechanical groups. There is a great deal more overlap of the mechanical groups in landmarkbased morphospace than there is in the function-space. This illustrates the differences in pattern seen with the two data sets. Groups that closely cluster in function-space are spread and diffuse in morphospace.
BIOMECHANICS AND DISPARITY IN ARTHRODIRA
FIGURE 7. Plot of the pairwise distances between each pair of arthrodire lowers jaws based on the landmark morphological data (x-axis) and mechanical character data (y-axis). There appears to be no trend within the data (r2 5 0.002). Model I regression shows no significant relationship between the two distance measures (p 5 0.351).
to be little relationship between the two data sets (r2 5 0.002), a finding verified by a model I regression (p 5 0.351). Spearman rankcorrelation analysis of the morphological and mechanical pairwise distance matrices shows no significant relationship in clustering patterns between the two data sets (z value 5 0.441; Rho 5 0.007; p . 0.65). Discussion Morphotype Comparisons Anderson (2008) used landmark-based morphometric analysis to show that there is significant difference in lower jaw shape between coccosteomorph and pachyosteomorph arthrodires. The specific differences seen have functional consequences that imply differences in the mechanics of prey capture between the two groups. The biomechanical analysis presented here provides more evidence for these functional differences. Coccosteomorphs have deeper blade portions of the lower jaws, which should result in higher second-moment-of-area values, because more material is shifted away from the centroid of the jaw. This hypothesis is supported by the results of Mann-Whitney tests, which show that coccosteomorphs have on average higher MAXI and AVEI values. Deepening the blade in coccosteomorphs will also push the point of maximum blade depth farther back on the jaw. I assumed that the jaw-closing muscle inserts into the jaw at the maximum blade depth (center of muscle force
333
coincides with stiffest point of the beam). The muscle will insert more posteriorly in coccosteomorphs, reducing the mechanical advantage (lever ratio indicating the amount of force transfer along the jaw). Results from independent Student’s t-tests support this hypothesis, showing higher AMA and PMA values on average in pachyosteomorphs. Pachyosteomorphs show a deepening and repositioning of the dental portion of the jaw, which affects the occlusion pattern. The lines seen in Figure 2 are drawn parallel and tangent to the surface of the dentition. In Incisoscutum (a coccosteomorph exemplar), this line passes directly through the jaw joint (Fig. 4A), whereas in Heintzichthys (a pachyosteomorph exemplar), the dental line passes well below the jaw joint (Fig. 4B). This pattern illustrates the effects of different values of the QUAD (quadrate joint offset) character. Results from Student’s t-tests show that the average QUAD value in pachyosteomorphs is significantly higher than in coccosteomorphs. The extreme pachyosteomorph condition ensures that all of the dentition occludes at the same time, as opposed to a scissor-like action (as in coccosteomorphs), where the two sides occlude progressively from posterior to anterior. The results of the mechanical analysis support the functional hypotheses put forth by the morphological analysis. The landmarkbased morphometric analysis does provide insight into functional characters, a relationship that will be discussed at length below. Faunal Comparisons The two Devonian faunas studied here appear to be quite distinct. The Gogo Formation is a shale that lies between the atolls and reef mounds of an ancient reef system populated by small, gracile placoderms. The Cleveland Shale is an anoxic black shale, deposited in an open basin environment populated by a wide range of placoderms in terms of both size and shape. Results from a Hotelling’s T2 analysis indicate that there are significant differences in the jaw mechanics of placoderms from these two faunas. Specifically, the placoderms of the Cleveland Shale have, on average, higher mechanical advantage and overall longer jaws, whereas the Gogo placoderms
334
PHILIP S. L. ANDERSON
FIGURE 8. Functional PCs 1 and 2 showing how the genera Eastmanosteus, Bullerichthys, and Kimberleyichthys (black triangles) relate to the two faunas. Although these taxa are found in the Gogo fauna (gray diamonds), they are pachyosteomorphs and are therefore more closely related to the arthrodires in the Cleveland Shale (open squares). These three taxa fall within the area of overlap in the function-space occupied by each of the faunas.
show greater second moment of area (both maximum and average values). There is a fair amount of overlap in function-space between these two groups (Fig. 5). Not every individual Cleveland arthrodire has higher AMA than every Gogo arthrodire. However, in general, the Cleveland fauna appears to have stronger biters (higher mechanical advantage values) than the Gogo fauna on average. Gogo arthrodires also have stiffer jaws (higher second-momentof-area values) and are limited to smaller body sizes. These are some of the same characters that separate the two morphotypes (coccosteomorphs and pachyosteomorphs) from each other. Not surprisingly, the morphotypes are fairly segregated between the two faunas. The Gogo arthrodire biota is mostly composed of coccosteomorphs arthrodires (Long and Trinajstic 2000), whereas the Cleveland arthrodires in this study are entirely composed of pachyosteomorphs (Carr 1995). Among the taxa used in this study, three pachyosteomorph taxa are found in the Gogo fauna: Eastmanosteus, Bullerichthys, and Kimberleichthys (Gardiner and Miles 1994;
Long and Trinajstic 2000). As the only pachyosteomorph taxa in the Gogo fauna used in this study, these jaws occupy function-space of interest. Figure 8 shows the jaw specimens of these three taxa in relation to the two faunas on PC axes 1 and 2 of the functionspace. Eastmanosteus, Bullerichthys, and Kimberleyichthys fall near the boundary of the Gogo and Cleveland faunas but cluster tightly with several Gogo taxa (see mechanical groups below). It is unclear whether the functional differences between the two faunas can be attributed to differences between the taxa represented within the faunas, or to differences between the two environments requiring different functional adaptations. Incorporation of jaw specimens from other localities that show a mix of morphotypes (such as the German Wildungen) would help address these questions. Average pairwise disparity results from this study show equivalent amounts of mechanical disparity (based on a 95% confidence interval) between the two faunas. The implication is that regardless of any differences in function between the two faunas,
BIOMECHANICS AND DISPARITY IN ARTHRODIRA
both achieve similar amounts of functional and possible ecological diversity. This result is examined more fully below. Functional Group Comparisons Four post-hoc functional groups of taxa were identified from the functional PCA plots. Results of a CVA showed the four groups to have significantly different values for the functional characters. ANOVA was used to further define which functional characters delineate the functional groups. These groups are defined after the analysis, and are merely a means to illustrate the range of functional variation within the arthrodires included. There is obvious variability of functional character values within the groups as well, but the CVA results indicate that these groups as defined here are significantly different from each other in terms of average mechanical abilities. Group 1, Choppers/Crushers.—The first group is composed of pachyosteomorph arthrodires found in the Cleveland Shale. The best-known representative is Dunkleosteus, a large apex predator (Anderson and Westneat 2007). Also included are Heintzichthys (which resembles a small version of Dunkleosteus), Mylostoma (a durophagous arthrodire with smooth crushing dental surfaces), and Gorgonichthys (another large predator). The jaws in this group occupy the area of function-space indicating the highest average mechanical advantage, both AMA and PMA, among the four groups, and higher average QUAD values than some other groups (Group 2 in particular). The dental plates occlude simultaneously, like a vise, and do so with higher forces due to high mechanical advantage values. Some of the taxa included in this group have bladed jaws, usually associated with a more scissor-like motion to slice through prey items. Dunkleosteus and Heintzichthys both sport long bladed edges along the upper and lower jaws, punctuated by bladed fangs at the anterior ends. However, these edges would not have slid past each other gradually in a scissor-like action, but would have closed in a chopping action, with large bite forces in Dunkleosteus (Anderson and Westneat 2007). Group 1 comprises arthrodires that could crush, or chop prey, depending on the dental surface
335
morphology, at high force values, reducing tough or resilient prey into smaller pieces for ingesting. Group 2, Biters.—The second group of jaws is composed of coccosteomorph arthrodires from the Gogo reef fauna. Most of the taxa included are small fish with small piercing teeth: Campagopiscis, Incisoscutum, and Gogopiscis. The only deviation from this dental morphology is Camuropiscis, which has no dentition other than a gently concave crushing surface. Group 2 occupies the area of function-space showing the highest values for both MAXI and AVEI. These jaws have the highest resistance to bending among the arthrodires. Group 2 also has, on average, some of the lowest QUAD values (significantly lower than Groups 1 or 3), indicating that the dentition occludes in a scissor-like fashion. High resistance to bending makes sense for jaws used to crush resistant prey items. The crushing surface seen in Camuropiscis supports a possible durophagous lifestyle. However, the other three taxa have sharp dental structures, similar to the grasp-andretain dentition in modern piscivorous fish. The arthrodires in Group 2 may have been reef biters/grazers, using their small teeth to grasp resilient prey off of the reef, similar to modern angelfish (Debelius et al. 2003). Prey items might include various crustaceans and soft portions of the coral itself. Group 3, Generalists.—The third group is a mix of coccosteomorph and pachyosteomorph arthrodires, all from the Gogo reef fauna. Two of the taxa included in this group are from the family Plourdosteidae: Torosteus and Harrytoombsia. Torosteus is a well-known taxon with a combination of bladed edges and tooth-like denticles as part of its dentition. Harrytoombsia is a basal plourdosteid with more extensive thoracic armor and shorter jaws. It also has both bladed edges and teeth. Gogosteus is an incisoscutid closely related phylogenetically to the arthrodires in Group 2. It bears an uneven crushing surface for dental plates. Eastmanosteus, the sole pachyosteomorph representative in this group, is a primitive pachyosteomorph that resembles a small version of Dunkleosteus and other members of Group 1. In function-space, this
336
PHILIP S. L. ANDERSON
group plots in the center regardless of which PC axes are shown, and ANOVA tests reveal that the group shows neither the highest nor lowest values for any of the mechanical metrics. Taking the multiple types of dental surfaces within a single jaw into account along with the average values for all the functional characters, the taxa in this group could be considered generalists or ‘‘facultative piscivores’’ (sensu Williams and Hatcher 1983) feeding on other fish and whatever else they can capture. Modern ‘‘facultative piscivores’’ include dogfish and white-tip reef sharks. Group 4, Pickers/Graspers.—The final group identified in the functional analysis is a small collection of taxa, both coccosteomorph and pachyosteomorph, from both the Gogo and Cleveland faunas, united by extraordinarily low mechanical advantage values. The coccosteomorphs included are Latocamuris, Fallacosteus, and Rolfosteus. All of these taxa are small, with slender gracile jaws and no apparent dental elements. It is possible that the dental elements have been worn down into the flat surface seen, and that these surfaces were used as crushing surfaces. However, the dental portion of these jaws is very narrow, calling into question whether these surfaces could be used to fragment resilient prey material. Although it is possible that these groups performed some level of oral processing, the functional characters of the jaws seem to indicate a focus on rapid action to catch evasive prey. The pachyosteomorphs included are Gymnotrachelus and Stenosteus. Their jaws are also quite slender, but they sport a small pointed dentition. Low MA values indicate that all of these taxa had relatively weak but possibly very rapid bites. For the Gogo taxa, this probably means they were feeding on small organisms in the water column that could be swallowed with minimal oral processing, such as plankton, or were picking soft prey off of the reef like certain modern butterflyfish (Motta 1988). The Cleveland taxa were likely also feeding on soft prey in the water column, such as squid or unarmored fish, using their small piercing teeth to grasp and retain. The analogues mentioned above (e.g., angelfish, butterflyfish) should not be taken as
direct comparisons. These examples are used merely to show the possible types of feeding roles being filled by the arthrodires in this study. It should also be noted that not all of the arthrodire taxa analyzed were included in one of the four mechanical groups. Certain other taxa show unique mechanical profiles that do not readily group with any of the above. One example, the pachyosteomorph genus Bullerichthys, has a truly unique dental system composed of a series of spherical bumps along the upper jaws that occlude against a concave surface on the lower jaw. These features would act as a mortar and pestle, grinding prey items in a manner unlike that of any other group. These four groups represent clusters of taxa in function-space that are not phylogenetically related. Comparison of the six families included in this study (Fig. 2) with the four functional groups shows that most families are represented in multiple groups, and all four groups include taxa from multiple families (Table 2). Even Groups 1 and 2, which consist, respectively, of pachyosteomorph and coccosteomorph taxa exclusively, only contain subsets of those groups that are not monophyletic clades (Fig. 2). Group 3 is composed of several taxa from different families including Eastmanosteus and a couple of plourdosteid taxa. These taxa are often considered basal members of their clades (Fig. 2). Plourdosteids are generally believed to be a sister group to the other coccosteomorphs included here (Long 1995). Certain members of the plourdosteid family not included in this study have even been reinterpreted as pachyosteomorphs (Carr and Hlavin 1995; Carr 2004). Eastmanosteus is often used as an outgroup for the pachyosteomorphs and its inclusion within that group has also been questioned (Carr 1991). Previous work on the morphology of these jaws has shown that these taxa cluster close together in morphospace as well (Anderson 2008). In the morphological analysis, the pattern was interpreted to mean that these taxa represent a plesiomorphic jaw shape for the common ancestor of coccosteomorphs and pachyosteomorphs. The results of the mechanical study support the idea that these
BIOMECHANICS AND DISPARITY IN ARTHRODIRA
TABLE 2. How the six arthrodire families are represented among the four post-hoc function groups. Most of the families have taxa in multiple groups, and all four groups are composed of multiple families. Group 1 Group 2 Group 3 Group 4 Dinichthyidae Selenosteidae Mylostomatidae Plourdosteidae Incisoscutidae Camuropiscidae
X
X X
X X X X
X X X
basal taxa are not only similar in jaw shape, but in jaw function as well. The basal taxa all appear to be facultative piscivores, suggesting that the common ancestor of these arthrodire clades was an ecological generalist, feeding on whatever prey items were available. If so, the functional diversity patterns seen in the Gogo and Cleveland faunas may show part of an ecological radiation of arthrodire taxa during the Late Devonian. A generalist common ancestor of the coccosteomorph and pachyosteomorph clades gave rise to a diversity of arthrodire taxa filling a variety of specialized feeding niches (such as Groups 1, 2, and 4). More lower jaw data from Late Devonian arthrodires are necessary to explore and test this hypothesis further. Whether due to a single radiation from a common ancestor or to another evolutionary mechanism, these Late Devonian fish groups are possibly beginning to converge on ecological roles (scrappers, pickers, crushers) similar to those seen in certain modern fish (Wainwright and Bellwood 2002). The switch from placoderm-dominated marine settings in the Late Devonian to a more modern fauna starting in the Late Carboniferous is a major shift in biodiversity patterns, and an important feature in the evolution of the oceans (Droser et al. 2000). However, this taxonomic shift appears to have had little effect on the ecological structure at a functional level. It is unclear how different the guild structures of the Gogo Reef fauna and a modern reef fauna would look. Morphospace versus ‘‘Function-space’’ A major purpose of this research has been to assess whether analyses of arthrodire lower jaws based on functionally relevant morphological characters would show a different
337
pattern of diversity than a general morphospace analysis based on landmark data. A previous study calculated average pairwise disparity of landmark-based morphometric data for the 94 arthrodire jaws used here (Anderson 2008). Significant differences in morphological disparity were found both between the faunas and between morphotypes. Results from the functional analysis show no such differences in mechanical average pairwise disparity between either faunas or morphotypes. Although morphological variation in arthrodire jaws appears to be greater in the Cleveland Shale than in the Gogo Formation, the two faunas show similar levels of functional variation among arthrodire jaws. The same holds true if the data set is divided by morphotype. This implies that similar levels of functional variation within a fauna or clade can be achieved with significantly different levels of morphological variation. This result may be due to functional convergence among dissimilar jaws in the Cleveland fauna, or to arthrodires in the Gogo fauna achieving higher levels of functional variation despite having less morphological variation. Although the plot of pairwise distances between jaws from the morphometric data set versus the pairwise distances between jaws from the biomechanical data set shows no relationship between the two data sets (Fig. 7) some connection between the two must exist, because the functional characters examined in this paper are based on morphology. However, when comparing the variation in these functional characters to a measure of overall morphological variation, the two results do not coincide. The general morphological disparity fails to give an accurate portrayal of the functional diversity of the exact same data. Neither do the two data sets show a significant relationship in the rank-order clustering of jaws between morphospace and function-space. In fact, the clustering patterns of the jaws show large differences between the two data sets. The post-hoc function groups defined in function-space (Fig. 6A) show a lot of overlap in the morphospace (Fig. 6B). Both Groups 1 and 4 are spread across almost the entire area of occupied morphospace, while the
338
PHILIP S. L. ANDERSON
overlap between Groups 2 and 3 is almost total. As shown above, these post-hoc functional groups are independent of phylogeny to a large degree, and they appear to be somewhat independent of overall shape similarity as well. The results above indicate that although there must be a relationship between mechanical metrics and the underlying general morphology, data sets based on shape morphology and morphological characters analyzed under a biomechanical framework give two different diversity patterns. Morphology and mechanical function are interrelated in any biological organism, and to a certain extent, the basic morphology does give an idea of the underlying functional consequences. However, it has been shown in modern groups that simple morphological description does not necessarily describe all of the functional consequences of that morphology (Westneat 1990; Hulsey and Wainwright 2002; Collar and Wainwright 2006). In spite of this discordance between data types, many paleoecological studies use general morphological disparity as a proxy for ecological diversity in fossil organisms (Foote 1997). The results here indicate that using this type of morphology for ecological diversity can be misleading. A landmark-based morphospace study fails to identify functional groups defined within a multivariate function-space based on biomechanical metrics. The functional groups include morphologically disparate taxa which nonetheless share common functional characteristics. Furthermore, general morphological disparity, although a very useful and powerful metric for examining aspects of biological evolution through time, is not necessarily a good predictor of ecological disparity. Conclusions Studying ecological change through time at a functional level can offer new insight into aspects of ecological diversity and structure that can be missed when looking only at the taxonomic pattern. Morphological data are often the only type available for studies of functional variation and behavior in fossil groups. However, results from this analysis of Late Devonian arthrodire jaws show a significant lack of agreement between the morpho-
logical disparity based on overall shape and mechanical disparity based on an analysis of functionally relevant morphological characters. Functional convergence of morphologically distinct structures can cause measures of morphological variation to be misleading in terms of functional variation. Morphological data need to be examined through a biomechanical paradigm in order to provide a fuller understanding of the ecological diversity present in a fauna. Statistical analyses of the mechanical data in this study show trends in functional diversity in Devonian arthrodires that would have gone undiscovered if only general morphological or taxonomic data were used. The biomechanical metrics measured from the lower jaws of arthrodire taxa in this study show a wide range of functional abilities and ecological niche partitioning, comparable to the functional variation seen among modern fish faunas. One question this raises is, How much has the basic fish ecology changed over the last 300 million years? Placoderms represent one of the earliest gnathostome radiations, and they have jaws systems that are much simpler than those of modern fish, especially teleosts. However, shortly after the gnathostomes first appeared, they were already filling many of the basic functional niches seen in modern fish faunas. The taxonomic pattern seen among the functional groups indicates that it may be possible to trace the evolutionary pattern of this ecological radiation through the coccosteomorphs and pachyosteomorphs, starting with the more generalist groups, which appear to be basal to the rest of these clades. These lines of inquiry require further study of a wide range of fossil fish taxa and can be addressed only by examining paleoecology at a functional level, based on a biomechanical paradigm. Acknowledgments I thank G. Jackson (Cleveland Museum of Natural History), M. Richter (Natural History Museum, London), J. Long (Museum Victoria), K. McNamara (Western Australian Museum), R. Jones (Australian Museum, Sydney), and R. Barwick (Australia National University) for access to arthrodire jaw
BIOMECHANICS AND DISPARITY IN ARTHRODIRA
material and assistance during research visits. M. LaBarbera, M. Coates, M. Westneat, D. Jablonski, and S. Kidwell gave constructive criticisms and suggestions on early drafts of this manuscript and I would like to thank D. Hulsey and one anonymous reviewer for their insightful comments as well. C. Wilga, A. Summers, and P. Lucas offered helpful discussion on biomechanical theory and measurements. M. Foote and M. Webster provided guidance on statistical analyses. This research was supported by the Geological Society of America through the Ross Research Award; the Paleontological Society through the Stephen J. Gould Fund; Sigma Xi Student Research Award; the University of Chicago Hinds Fund; and the University of Chicago Doolittle-Harrison Fellowship. Literature Cited Anderson, P. S. L. 2008. Shape variation between arthrodire morphotypes indicates possible feeding niches. Journal of Vertebrate Paleontology 28:961–969. Anderson, P. S. L., and M. W. Westneat. 2007. Feeding mechanics and bite force modelling of the skull of Dunkleosteus terrelli, an ancient apex predator. Biology Letters 3:6–79. Arnold, S. J. 1983. Morphology, performance and fitness. American Zoologist 23:47–361. Ausich, W. I., and D. J. Bottjer. 1982. Tiering in suspensionfeeding communities on soft substrata throughout the Phanerozoic. Science 216:73–174. Bambach, R. K., A. M. Bush, and D. H. Erwin. 2007. Autecology and the filling of ecospace: key metazoan radiations. Palaeontology 50:1–22. Barel, C. D. N. 1983. Toward a constructional morphology of cichlid fishes (Teleostei, Perciformes). Netherlands Journal of Zoology 33:57–424. Bellwood, D. R., P. C. Wainwright, C. J. Fulton, and A. Hoey. 2002. Assembly rules and functional groups at global biogeographical scales. Functional Ecology 16:7–562. Bottjer, D. J., and W. I. Ausich. 1986. Phanerozoic development of tiering in soft substrata suspension-feeding communities. Paleobiology 12:400–420. Brazeau, M. D. 2009. The braincase and jaws of a Devonian ‘‘acanthodian’’ and modern gnathostome origins. Nature 457:305–308. Brenchley, P. J., J. D. Marshall, and C. J. Underwood. 2001. Do all mass extinctions represent an ecological crisis? Evidence from the Late Ordovician. Geological Journal 36:329–340. Carr, R. K. 1991. Reanalysis of Heintzichthys gouldii (Newberry), an aspinothoracid arthrodire (Placodermi) from the Famennian of northern Ohio, with a review of brachythoracid systematics. Zoological Journal of the Linnean Society 103:349–390. ———. 1995. Placoderm diversity and evolution. In M. Arsenault, H. Lelie`vre, and P. Janvier, eds. Studies on early vertebrates. Seventh International Symposium on Early Vertebrates, Miguasha, Quebec. Bulletin du Muse´um d’Histoire Naturelle, Paris 17:85–125. ———. 2004. Recognizing paraphyletic stem groups: a case study in the analysis of eubrachythoracid arthrodires (Placodermi). Pp. 127–138 in G. Arratia, M. V. H. Wilson, and R. Cloutier, eds.
339
Recent advances in the origin and early radiation of vertebrates. Dr. Friedrich Pfeil, Munich. Carr, R. K., and W. J. Hlavin. 1995. Dinichthyidae (Placodermi): a paleontological fiction? Geobios 19:85–87. Carroll, A. M., P. C. Wainwright, S. H. Huskey, D. C. Collar, and R. G. Turingan. 2004. Morphology predicts suction feeding performance in centrarchid fishes. Journal of Experimental Biology 207:3873–3881. Chapin, F. S. I., E. S. Zavaleta, V. T. Eviner, R. L. Naylor, P. M. Vitousek, H. L. Reynolds, D. U. Hooper, S. Lavorel, O. E. Sala, S. E. Hobbie, M. C. Mack, and S. Diaz. 2000. Consequences of changing biodiversity. Nature 405:234–242. Ciampaglio, C. N., M. Kemp, and D. W. McShea. 2001. Detecting changes in morphospace occupation patterns in the fossil record: characterization and analysis of measures of disparity. Paleobiology 27:695–715. Collar, D. C., and P. C. Wainwright. 2006. Discordance between morphological and mechanical diversity in the feeding mechanism of centrarchid fishes. Evolution 60:2575–2584. Copper, P. 1994. Ancient reef ecosystem expansion and collapse. Coral Reefs 13:3–12. Debelius, H., H. Tanaka, and R. H. Kuiter. 2003. Angelfishes, a comprehensive guide to Pomacanthidae. TMC Publishing, Chorley, U.K. Droser, M. L., D. J. Bottjer, and P. M. Sheehan. 1997. Evaluating the ecological architecture of major events in the Phanerozoic history of marine invertebrate life. Geology 25:167–170. Droser, M. L., D. J. Bottjer, P. M. Sheehan, and G. R. McGhee. 2000. Decoupling of taxonomic and ecologic severity of Phanerozoic marine mass extinctions. Geology 28:657–678. Dupret, V. 2004. The phylogenetic relationships between actinolepids (Placodermi: Arthrodira) and other arthrodires (phlyctaeniids and brachythoracids). Pp. 44–55 in G. C. Young, ed. Lower vertebrates from the Palaeozoic. First International Palaeontological Congress (IPC 2002), Sydney, Australia, 6–10 July 2002. Proceedings of Symposium 6 (Palaeozoic Vertebrates). Erwin, D. H. 2007. Disparity: morphological pattern and developmental context. Palaeontology 50:57–73. Evans, A. R., and G. D. Sanson. 1998. The effect of tooth shape on the breakdown of insects. Journal of the Zoological Society of London 246:91–400. Evans, A. R. 2003. The tooth of perfection: functional and spatial constraints on mammalian tooth shape. Biological Journal of the Linnean Society 78:173–191. Felsenstein, J. 1985. Confidence limits on phylogenies: an approach using the bootstrap. Evolution 39:783–791. Foote, M. 1991. Morphologic patterns of diversification: examples from trilobites. Palaeontology 34:461–485. ———. 1992. Paleozoic record of morphological diversity in blastozoan echinoderms. Proceedings of the National Academy of Sciences USA 89:7325–7329. ———. 1993. Discordance and concordance between morphological and taxonomic diversity. Paleobiology 19:185–204. ———. 1994. Morphological disparity in Ordovician-Devonian crinoids and the early saturation of morphological space. Paleobiology 20:320–344. ———. 1995. Morphological diversification of Paleozoic crinoids. Paleobiology 21:271–299. ———. 1997. The evolution of morphological diversity. Annual Review of Ecology and Systematics 28:129–152. Gardiner, B. G., and R. S. Miles. 1994. Eubrachythoracid arthrodires from Gogo, Western Australia. Zoological Journal of the Linnean Society 112:443–477. Goujet, D. F. 1984. Placoderm interrelationships: a new interpretation, with a short review of placoderm classifications. Proceedings of the Linnean Society of New South Wales 107:211–244.
340
PHILIP S. L. ANDERSON
Greaves, W. S. 1974. Functional implications of mammalian jaw joint position. Forma et Functio 7:363–376. Hammer, Ø., D. A. T. Harper, and P. D. Ryan. 2001. PAST: palaeontological statistics software package for education and data analysis. Palaeontologia Electronica 4:1–9. Herring, S. W. 1993. Functional morphology of mammalian mastication. American Zoologist 33:289–299. Huckins, C. J. F. 1997. Functional linkages among morphology, feeding performance, diet, and competitive ability in molluscivorous sunfish. Ecology 78:2401–2414. Hulsey, C. D., and P. C. Wainwright. 2002. Projecting mechanics into morphospace: disparity in the feeding system of labrid fishes. Proceedings of the Royal Society of London B 269:317– 326. Jaminski, J., T. J. Algeo, J. B. Maynard, and J. C. Hower. 1998. Climatic origin of dm-scale compositional cyclicity in the Cleveland Member of the Ohio Shale (Upper Devonian), Central Appalachian Basin, U.S.A. Pp. 217–242 in J. Scheiber, W. Zimmerle, and P. S. Sethi, eds. Shales and mudstones. I. E. Schweizerbart, Stuttgart. Janvier, P. 1996. Early vertebrates. Clarendon, Oxford. Jernvall, J., J. P. Hunter, and M. Fortelius. 1996. Molar tooth diversity, disparity, and ecology in Cenozoic ungulate radiations. Science 274:1489–1492. Long, J. A. 1995. The rise of fishes. Johns Hopkins University Press, Baltimore. Long, J. A., and K. Trinajstic. 2000. Devonian micro vertebrate faunas of Western Australia. Courier Forschungsinstitut Senckenberg 22:471–485. Lucas, P. W. 2004. Dental functional morphology: how teeth work. Cambridge University Press, Cambridge. Lupia, R. 1999. Discordant morphological disparity and taxonomic diversity during the Cretaceous angiosperm radiation: North American pollen record. Paleobiology 25:1–28. McGhee, G. R., P. M. Sheehan, D. J. Bottjer, and M. L. Droser. 2004. Ecological ranking of Phanerozoic biodiversity crises: ecological and taxonomic severities are decoupled. Palaeogeography, Palaeoclimatology, Palaeoecology 211:289–297. Miles, R. S. 1969. Features of placoderm diversification and the evolution of the Arthrodire feeding mechanism. Transactions of the Royal Society of Edinburgh 68:123–170. Motta, P. J. 1988. Functional morphology of the feeding apparatus of ten species of Pacific butterflyfishes (Perciformes, Chaetodontidae): an ecomorphological approach. Environmental Biology of Fishes 22:39–67. Norberg, U. M. 1994. Wing design, flight performance, and habitat uses in bats. Pp. 205–239 in Wainwright and Reilly 1994. Playford, P. E. 1980. Devonian ‘‘Great Barrier Reef’’ of Canning basin, Western Australia. AAPG Bulletin 64:814–840. Prosser, C. S. 1913. The Huron and Cleveland Shales of northern Ohio. Journal of Geology 21:323–362. Ramsay, J. B., and C. D. Wilga. 2007. Morphology and mechanics of the teeth and jaws of White-Spotted Bamboo Sharks (Chiloscyllium plagiosum). Journal of Morphology 268:664–682. Ricklefs, R. E., and D. B. Miles. 1994. Ecological and evolutionary inferences from morphology: an ecological perspective. Pp. 13– 41 in Wainwright and Reilly 1994. Roy, K., and M. Foote. 1997. Morphological approaches to modeling biological diversity. Trends in Ecology and Evolution 12:277–281.
Saunders, W. B., and D. M. Work. 1996. Shell morphology and suture complexity in Upper Carboniferous ammonoids. Paleobiology 22:189–218. Steneck, R. S. 1997. Crustose corallines, other algal functional groups, herbivores and sediments: complex interactions along reef productivity gradients. Pp. 695–700 in H. A. Lessios and I. G. MacIntyre, eds. Proceedings of the 8th International Coral Reef Symposium, Panama, 24–29 June 1996. Summers, A. P., R. A. Ketcham, and T. Rowe. 2004. Structure and function of the Horn Shark (Heterodontus francisci) Cranium through ontogeny: development of a hard prey specialist. Journal of Morphology 260:1–12. Teichert, C. 1943. The Devonian of Western Australia: a preliminary review. American Journal of Science 241:69–94. Tilman, D. 2000. Causes, consequences and ethics of biodiversity. Nature 405:208–211. Trinajstic, K. M., and M. Hazelton. 2007. Ontogeny, phenotypic variation and phylogenetic implications of arthrodires of the Gogo Formation, Western Australia. Journal of Vertebrate Paleontology 27:571–583. Turnbull, W. D. 1970. Mammalian masticatory apparatus. Fieldiana (Geology) 18:147–356. Van Valkenburgh, B. 1994. Ecomorphological analyses of fossil vertebrates and their paleocommunities. Pp. 140–166 in Wainwright and Reilly 1994. Wagner, P. J. 1995. Testing evolutionary constraint hypotheses with early Paleozoic gastropods. Paleobiology 21:248–272. Wainwright, P. C., and D. R. Bellwood. 2002. Ecomorphology of feeding in coral reef fishes. Pp. 33–55 in P. F. Sale, ed. Coral reef fishes: dynamics and diversity in a complex system. Academic Press, San Diego. Wainwright, P. C., and S. M. Reilly, eds. 1994. Ecological morphology. University of Chicago Press, Chicago. Wainwright, P. C., and B. A. Richard. 1995. Predicting patterns of prey use from morphology of fishes. Environmental Biology of Fishes 44:97–113. Wainwright, S. A., W. D. Biggs, J. D. Currey, and J. M. Gosline. 1976. Mechanical design in organisms. Princeton University Press, Princeton, N.J. Westneat, M. W. 1990. Feeding mechanics of teleost fishes (Labridae): a test of four-bar linkage models. Journal of Morphology 205:269–295. ———. 1994. Transmission of force and velocity in the feeding mechanisms of labrid fishes (Teleostei, Perciformes). Zoomorphology 114:103–118. Wignall, P. B. 1994. Black shales. Oxford Monographs on Geology and Geophysics 30:1–127. Williams, D. M., and A. I. Hatcher. 1983. Structure of fish communities on outer slopes of inshore, mid-shelf and outer shelf reefs of the Great Barrier Reef. Marine Ecology Progress Series 10:239–250. Wills, M. A. 2001. Morphological disparity: a primer. Pp. 55–144 in J. M. Adrain ed. Fossils, phylogeny, and form. Kluwer Academic/Plenum, New York. Wills, M. A., D. E. G. Briggs, and R. A. Fortey. 1994. Disparity as an evolutionary index: a comparison of Cambrian and recent arthropods. Paleobiology 20:93–130. Zelditch, M. L., D. L. Swiderski, H. D. Sheets, and W. L. Fink. 2004. Geometric morphometrics for biologists: a primer. Elsevier/Academic Press, San Diego.
341
BIOMECHANICS AND DISPARITY IN ARTHRODIRA
Appendix List of inferognathal specimens used in this analysis. Family assignments are derived from the following sources: Carr (1991, 1995); Gardiner and Miles (1994); Long (1995); Long and Trinajstic (2000); Trinajstic and Hazelton (2007). Abbreviations: CMNH , Cleveland Museum of Natural History; NHM, Natural History Museum, London; WAM, Western Australian Museum, Perth; AMS, Australian Museum, Sydney; ANU, Australia National University, Canberra.
Family
Genus
Species
Coccosteomorph Camuropiscidae Camuropiscidae Camuropiscidae Camuropiscidae Camuropiscidae Camuropiscidae Camuropiscidae Camuropiscidae Incisoscutidae Incisoscutidae Incisoscutidae Incisoscutidae Incisoscutidae Incisoscutidae Incisoscutidae Incisoscutidae Incisoscutidae Plourdosteidae Plourdosteidae Plourdosteidae Plourdosteidae Plourdosteidae Plourdosteidae Plourdosteidae Plourdosteidae Plourdosteidae Plourdosteidae Plourdosteidae Plourdosteidae Plourdosteidae Plourdosteidae Plourdosteidae Plourdosteidae Plourdosteidae Plourdosteidae Plourdosteidae Plourdosteidae Plourdosteidae Plourdosteidae Plourdosteidae Plourdosteidae Plourdosteidae Plourdosteidae
Museum
Specimen no.
Camuropiscis Camuropiscis Camuropiscis Fallacosteus Latocamuris Latocamuris Rolfosteus Rolfosteus Gogosteus Gogosteus Incisoscutum Incisoscutum Incisoscutum Incisoscutum Incisoscutum Incisoscutum Incisoscutum Campagopiscis Campagopiscis Campagopiscis Campagopiscis Campagopiscis Campagopiscis Campagopiscis Campagopiscis Campagopiscis Campagopiscis Campagopiscis Campagopiscis Campagopiscis Campagopiscis Harrytoombsia Mcnamaraspis Torosteus Torosteus Torosteus Torosteus Torosteus Torosteus Torosteus Torosteus Torosteus Torosteus
concinnus concinnus concinnus turneriae coulthardi coulthardi canningensis canningensis sarahae sarahae ritchiei ritchiei ritchiei ritchiei ritchiei ritchiei ritchiei croucheri croucheri croucheri croucheri croucheri croucheri croucheri croucheri croucheri croucheri croucheri croucheri croucheri croucheri elegans kaprios pulchellus pulchellus pulchellus pulchellus pulchellus pulchellus tuberculatus tuberculatus tuberculatus tuberculatus
NHM NHM WAM WAM WAM WAM NHM NHM WAM WAM NHM NHM NHM NHM WAM WAM WAM NHM NHM NHM NHM NHM NHM NHM NHM NHM NHM WAM WAM WAM WAM WAM WAM NHM NHM WAM WAM WAM WAM NHM NHM NHM NHM
P50937 P51126 704225 869697 869699 869670 P50968 P50971 011114 896667 P50930 P57636 P57638 P57640 121767 869683 869701 P50941 P50942 P50946 P50948 P50952 P50954 P50958 P50959 P50964 P57627 9512 869675 869702 9143 704254 869676 P50913 P50966 8863 011109 91431 91432 P50911 P50918 P50920 P50921
Pachyosteomorph Dinichthyidae Dinichthyidae Dinichthyidae Dinichthyidae Dinichthyidae Dinichthyidae Dinichthyidae Dinichthyidae Dinichthyidae Dinichthyidae Dinichthyidae Dinichthyidae Dinichthyidae Dinichthyidae
Dunkleosteus Dunkleosteus Dunkleosteus Dunkleosteus Dunkleosteus Dunkleosteus Dunkleosteus Dunkleosteus Dunkleosteus Dunkleosteus Dunkleosteus Dunkleosteus Dunkleosteus Dunkleosteus
intermedius terrelli terrelli terrelli terrelli terrelli terrelli terrelli terrelli terrelli terrelli terrelli terrelli terrelli
NHM CMNH CMNH CMNH CMNH CMNH CMNH CMNH CMNH CMNH CMNH CMNH CMNH CMNH
P9339 5059 5108 5162 5165 5230 5300 5698 5704 5749 5959 6020 7069 7568
342
PHILIP S. L. ANDERSON
Appendix. Continued. Family Dinichthyidae Dinichthyidae Dinichthyidae Dinichthyidae Dinichthyidae Dinichthyidae Dinichthyidae Dinichthyidae Dinichthyidae Dinichthyidae Dinichthyidae Dinichthyidae Dinichthyidae Dinichthyidae Dinichthyidae Dinichthyidae Dinichthyidae Dinichthyidae Dinichthyidae Dinichthyidae Dinichthyidae Dinichthyidae Mylostomatidae Mylostomatidae Mylostomatidae Mylostomatidae Mylostomatidae Selenosteidae Selenosteidae Selenosteidae Selenosteidae Selenosteidae Selenosteidae Selenosteidae Indeterminate Indeterminate Indeterminate
Genus Dunkleosteus Dunkleosteus Dunkleosteus Dunkleosteus Dunkleosteus Dunkleosteus Eastmanosteus Eastmanosteus Eastmanosteus Eastmanosteus Eastmanosteus Eastmanosteus Gorgonichthys Heintzichthys Heintzichthys Heintzichthys Heintzichthys Heintzichthys Heintzichthys Heintzichthys Heintzichthys Hussakofia Dinomylostoma Mylostoma Mylostoma Mylostoma Mylostoma Gymnotrachelus Gymnotrachelus Gymnotrachelus Selenosteus Selenosteus Stenosteus Stenosteus Bullerichthys Bullerichthys Kimberleyichthys
Species terrelli terrelli terrelli terrelli terrelli terrelli calliaspis calliaspis calliaspis calliaspis calliaspis calliaspis clarki gouldii gouldii gouldii gouldii gouldii gouldii gouldii gouldii minor variabile newberry newberry newberry beecheri hydei hydei hydei brevis brevis glaber glaber fascidens fascidens heintzi
Museum
Specimen no.
CMNH CMNH CMNH CMNH CMNH CMNH ANU NHM NHM NHM WAM WAM CMNH CMNH CMNH CMNH CMNH CMNH CMNH NHM NHM CMNH NHM CMNH CMNH CMNH NHM CMNH CMNH CMNH CMNH CMNH CMNH CMNH WAM WAM ANU
7715 7835 8040* 8808 9905 50206 49380 P50890 P50893 P51229 704264 Display 7129 6025 6352 8093 8094 8096 8097 P9333 P9334 8082 P9299 7256 7706 8997 P10338 8049 8051 8054 8086 8088 8044 8777 704259 869703 35687
* The taxonomic affinity of this specimen has been recently brought into question (J. Long personal communication 2008). The specimen has been removed from any analyses involving taxonomy or functional groups.