. (2009), 19(1), 00–00 doi: 10.4014/jmb.0806.380 First published online 6 November 2008 J. Microbiol. Biotechnol
Bioprocess Development for Production of Alkaline Protease by Bacillus pseudofirmus Mn6 Through Statistical Experimental Designs
AC CE PT ED
Abdel-Fattah, Y. R.*, H. A. El-Enshasy, N. A. Soliman, and H. El-Gendi
Bioprocess Development Department., Genetic Engineering and Biotechnology Research Institute, Mubarak City for Scientific Research and Technology Applications, New Burg El-Arab City Alexandria 21934, Egypt
Received: June 20, 2008 / Accepted: August 15, 2008
A sequential optimization strategy, based on statistical experimental designs, is employed to enhance the production of alkaline protease by a Bacillus pseudofirmus local isolate. To screen the bioprocess parameters significantly influencing the alkaline protease activity, a 2-level Plackett-Burman design was applied. Among 15 variables tested, the pH, peptone, and incubation time were selected based on their high positive significant effect on the protease activity. A nearoptimum medium formulation was then obtained that increased the protease yield by more than 5-fold. Thereafter, the response surface methodology (RSM) was adopted to acquire the best process conditions among the selected variables, where a 3-level Box-Behnken design was utilized to create a polynomial quadratic model correlating the relationship between the three variables and the protease activity. The optimal combination of the major medium constituents for alkaline protease production, evaluated using the nonlinear optimization algorithm of EXCEL-Solver, was as follows: pH of 9.5, 2% peptone, and incubation time of 60 h. The predicted optimum alkaline protease activity was 3,213 U/ml/min, which was 6.4 times the activity with the basal medium. Keywords: Haloalkaliphiles, optimization of alkaline protease, statistical experimental design
Alkaline proteases are a physiologically and commercially important group of enzymes that catalyze the hydrolysis of peptide bonds in protein molecules [24]. Protease enzymes constitute at least 60% of the total industrial enzyme market [34], where they are incorporated into different industrial applications, such as laundry detergents, leather preparation, protein recovery or solubilization, and organic synthesis [4, 27]. Although almost all microorganisms produce proteases, *Corresponding author
Phone: +203 4593422; Fax: +203 4593407; E-mail:
[email protected]
only those microbes that produce substantial amounts of extracellular enzymes are of industrial importance. Extracellular protease production in microorganisms is highly influenced by the media components, variations in the C/N ratio, the presence of some easily metabolizable sugars, such as glucose [7, 14, 23], and the presence of metal ions [40]. In addition, several other factors, such as the aeration, inoculum density, pH, temperature, and incubation time, also affect the amount of protease produced [17, 26]. Process optimization is a topic of central importance for industrial production processes, where the classical optimization method of one variable at a time (OVAT) is most frequently used. However, this strategy is not only time and effort consuming, but also lacks a study of the interaction between variables [15]. Thus, statistical approaches can offer cost-effective solutions for process optimization studies in biotechnology, as they provide preplanned methods through which interaction between variables can be calculated [14, 15]. Accordingly, the present study presents a sequential optimization strategy to improve the production of alkaline protease by a locally isolated Bacillus sp. The first step involves a screening experiment using a Plackett-Burman fractional factorial design to address the most significant factors affecting production among the studied variables. The second step then determines the optimum levels of the most significant variables identified in the first step through a nonlinear optimization algorithm and application of the response surface methodology. Finally, the last step involves experimental verification of the theoretical solution to validate the polynomial model.
MATERIAL AND METHODS Microorganism The bacterial strain used in this work, designated as Mn6, was isolated from olive field soil samples collected from the El-Menia governorate, Egypt. This strain was selected from a group of haloalkaliphiles that
2
Abdel-Fattah
et al.
had been isolated on an alkaline nutrient broth medium with the following composition (g/l): Peptone, 5; NaCl, 5; Yeast extract, 2; Beef extract, 1; Na CO , 10.6; and NaHCO , 8.42. The pH was initially adjusted to 10 using sterilized Na CO , and a NaHCO sesquicarbonate solution was then added separately after autoclaving. The alkaline nutrient broth medium was used as a preculture medium in this study. 2
3
3
2
3
3
DNA Isolation from Bacterial Strain An overnight culture of the target Mn6 isolate grown at 30 C was used for the preparation of the genomic DNA. The DNA was isolated using a Promega kit for the preparation of genomic DNA according to the manufacturer’s instructions.
o
Enzyme Assays The qualitative determination of alkaline protease was carried out using a well cut or cup assay according to Vidyasagar et al. [41]. The medium contained 1% Bovine milk-casein in a 50 mM glycineNaOH buffer at pH 10 with 0.5% NaCl and a 2% (w/v) agar. After sterilization, 0.1 mg% sodium azide was added and the medium poured into Petri plates. Then, 6-mm-diameter cups were made in each plate using a sterilized cork borer, and the culture filtrate of the tested bacterium was added carefully into the wells and incubated at 45 C for 24 h. Following the incubation, the plates were developed with 15% (w/v) mercuric chloride in 20% HCl. The appearance of a clear transparent zone was indicative of hydrolysis of the substrate by an extracellular protease. Additionally, the diameter of the clear zone was considered a semi quantitative estimation of protease activity. Meanwhile, the quantitative estimation of alkaline protease activity was carried out according to Anson [3], where 1% of bovine milk casein in a 50 mM glycine-NaOH buffer, pH 10, with 0.5% NaCl was incubated with the enzyme at 60 C. One unit of protease activity was defined as the amount of enzyme that yielded the equivalent of 1 µmol of tyrosine per minute under the assay conditions.
AC CE PT ED
o
Enzyme Production Conditions The protease production was carried out in 250-ml conical flasks containing 50 ml of a medium, incubated at 30 C under shaking conditions of 200 rpm, and inoculated with 1% of the 12-h-old alkaline nutrient broth culture. After the specified cultivation time for each set of experimental trials, the culture broth was centrifuged at 10,000 rpm for 10 min and the cell-free supernatant used for the enzyme determination.
Identification of Bacterial Strain The bacterium was characterized and identified by 16S rRNA gene sequencing using the universal primers AGAGTTTGATCMTGGCTCAG (position 8 in the 16S rRNA gene according to E. coli numbering) and TACGGYACCTTGTTACGACTT (position 1,514 in the 16S rRNA gene according to E. coli numbering). The PCR mixture consisted of 25 pmol of each primer, 10 ng of chromosomal DNA, 200 mM dNTPs, and 2.5 U of Taq polymerase in 50 µl of a polymerase buffer. The PCR was carried out for 30 cycles at 94 C for 1 min, 55 C for 1 min, and 72 C for 2 min. After completion, a fraction of the PCR mixture was examined using agarose gel electrophoresis [5] and the remnant mixture purified using a QIAquick PCR purification reagent (Qiagen). The 16S rRNA gene fragment (1,442 bp length) was sequenced in both directions and the Blast program (http:// www.ncbi.nlm.nih.gov/blast) used to assess the DNA similarities. A multiple sequence alignment and the molecular phylogeny were performed using BioEdit [16]. The phylogenetic tree was generated using the TREEVIEW program [28], and the sequence has since been deposited in the GenBank under Accession No EU315248. o
o
o
Table 1.
Trial
01 02 03 04 05 06 07 08 09 10 11 12 13 14 15 16
o
o
Determination of Glucose Concentration The residual glucose was determined by the analytic colorimetric method using a Glucose Oxidation Kit (Diamond Diagnostics, Egypt).
Randomized Plackett-Burman experimental design for evaluating factors influencing alkaline protease production. )1 X (e so cu l G
-1(1) -1(0.2) -1(1) -1(0.2) -1(0.2) -1(0.2) -1(1) -1(1) -1(1) -1(0.2) -1(1) -1(0.2) -1(1) -1(0.2) -1(1) -1(0.2)
)2 X ( hc ra tS
-1(1) -1(1) -1(0.2) -1(1) -1(0.2) -1(0.2) -1(0.2) -1(1) -1(1) -1(1) -1(0.2) -1(1) -1(0.2) -1(1) -1(0.2) -1(0.2)
)3 X (e ta te ca -a N
-1(0.2) -1(1) -1(1) -1(0.2) -1(1) -1(0.2) -1(0.2) -1(0.2) -1(1) -1(1) -1(1) -1(0.2) -1(1) -1(0.2) -1(1) -1(0.2)
)4 (X tc atr xe ts ae Y
-1(1) -1(0.2) -1(1) -1(1) -1(0.2) -1(1) -1(0.2) -1(0.2) -1(0.2) -1(1) -1(1) -1(1) -1(0.2) -1(1) -1(0.2) -1(0.2)
)5 X (t ca trx ef ee B
-1(0.2) -1(1) -1(0.2) -1(1) -1(1) -1(0.2) -1(1) -1(0.2) -1(0.2) -1(0.2) -1(1) -1(1) -1(1) -1(0.2) -1(1) -1(0.2)
)6 X (e no tp eP
-1(1) -1(0.2) -1(1) -1(0.2) -1(1) -1(1) -1(0.2) -1(1) -1(0.2) -1(0.2) -1(0.2) -1(1) -1(1) -1(1) -1(0.2) -1(0.2)
)7 X et( as yl rod yh ine sa C -1(0.2) -1(1) -1(0.2 -1(1) -1(0.2) -1(1) -1(1) -1(0.2) -1(1) -1(0.2) -1(0.2) -1(0.2) -1(1) -1(1) -1(1) -1(0.2)
Variable levels are presented between brackets expressed as g%.
)8 X (4 O S)2 4 H N (
-1(0.5) -1(0) -1(0.5) -1(0) -1(0.5) -1(0) -1(0.5) -1(0.5) -1(0) -1(0.5) -1(0) -1(0) -1(0) -1(0.5) -1(0.5) -1(0)
)9 X (4 O P2 H K
-1(0.4) -1(0.4) -1(0.1) -1(0.4) -1(0.1) -1(0.4) -1(0.1) -1(0.4) -1(0.4) -1(0.1) -1(0.4) -1(0.1) -1(0.1) -1(0.1) -1(0.4) -1(0.1)
)0 1 X (l C a N
-1(5) -1(5) -1(5) -1(0.5) -1(5) -1(0.5) -1(5) -1(0.5) -1(5) -1(5) -1(0.5) -1(5) -1(0.5) -1(0.5) -1(0.5) -1(0.5)
)1 1 X (4 O S2 eF
-1(0) -1(0.001) -1(0.001) -1(0.001) -1(0) -1(0.001) -1(0) -1(0.001) -1(0) -1(0.001) -1(0.001) -1(0) -1(0.001) -1(0) -1(0) -1(0)
)2 1 X (4 O Sg M
-1(0) -1(0) -1(0.01) -1(0.01) -1(0.01) -1(0) -1(0.01) -1(0) -1(0.01) -1(0) -1(0.01) -1(0.01) -1(0) -1(0.01) -1(0) -1(0)
)3 1 X ( H p
)4 1 X (e ru ta re p m eT
-1(8) -1(8) -1(8) -1(11) -1(11) -1(11) -1(8) -1(11) -1(8) -1(11) -1(8) -1(11) -1(11) -1(8) -1(11) -1(8)
-1(45) -1(30) -1(30) -1(30) -1(45) -1(45) -1(45) -1(30) -1(45) -1(30) -1(45) -1(30) -1(45) -1(45) -1(30) -1(30)
)5 1 X (e Protease im t activity no it U/ml/min ab uc nI -1(24) 141 -1(48) 108 -1(24) 090 -1(24) 294 -1(24) 101 -1(48) 750 -1(48) 148 -1(48) 461 -1(24) 117 -1(48) 226 -1(24) 021 -1(48) 903 -1(24) 061 -1(48) 521 -1(48) 430 -1(24) 946
OPTIMIZATION OF
PSEUDOFIRMUS PROTEASE BY NUMERICAL MODELING
0
i
i
0
i
i
Box-Behnken Design To describe the nature of the response surface in the experimental region and to identify the optimum conditions for enzyme production, a Box-Behnken design [8] was applied. Table 3 presents the design matrix, consisting of 13 trials to study the most significant variables affecting protease activity. Each variable was studied on three levels, coded -1, 0, and +1 for low, middle, and high values, respectively. To predict the optimal point, a second-order polynomial function was fitted to correlate the relationship between the independent variables and the response (alkaline protease activity). For three factors, the equation was Y=β +β X +β X +β X +β X X +β X X Y=+β X X +β X +β X +β X where Y is the predicted response, β is the model constant, X , X , and X are the independent variables, β , β , and β are the linear coefficients, β , β , and β are the cross-product coefficients, and β , β , and β are the quadratic coefficients. Microsoft Excel 97 was used for the regression analysis of the experimental data obtained. The quality of fit of the polynomial model equation was expressed by a coefficient of determination, R . The experiments were performed in triplicate and the mean values are given. 0
1
1
2
2
3
3
2
23
2
3
11
1
12
1
2
22
2
13
1
3
2
2
33
3
0
3
12
11
22
1
1
13
2
2
3
23
33
2
Statistical Analysis of Data The enzyme activity data were subjected to multiple linear regressions using Microsoft Excel 97 to estimate the t-values, p-values, and confidence levels expressing the p-value as a percentage. The optimal enzyme activity value was estimated using the Solver function of the Microsoft Excel tools.
RESULT AND DISCUSSION Isolation, Characterization, and Molecular Identification of Alkaline Protease-producing Bacteria
In the preliminary screening program for the isolation of alkaline protease-producing bacteria, 200 isolates were obtained
3
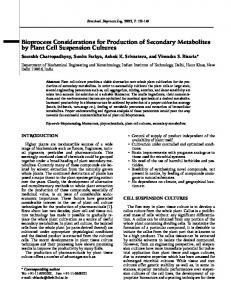
from soil and water samples collected at different localities across Egypt. Qualitative and quantitative assessments of the alkaline protease activity were performed using cell-free supernatants, after growing the bacteria in an alkaline nutrient broth initially adjusted to pH 9.5, at 30oC, and under shaking conditions (200 rpm) for 48 h. The Mn6 isolate was then selected from among the locally isolated haloalkaliphiles, as it was found to produce an alkaline protease with a high potency (500 U/ml/min) under the previously reported assay conditions: temperature 60oC, pH 10, and salinity 0.5%. Although different reaction conditions were initially tested (data not shown), the reported conditions were considered the optimal ones. Similarly, the keratinase activity from B. pseudofirmus reached its maximum measurable enzyme titer (38 U/ml) under the following conditions: temperature 60oC and pH 8.8-10.3, as reported by Kojima et al [22]. As regards the morphological and physiological characteristics of the selected isolate, it was rod shaped, grew over a wide range of pHs (7.5-12), temperatures (25-45oC), and NaCl concentrations (0-15%), was catalase positive, and able to degrade starch. To identify the isolate on a molecular basis, the 16S rRNA gene was amplified, sequenced, and deposited in the GeneBank under Accession No. EU315248. The sequence analysis revealed a close relationship to Bacillus pseudofirmus clone 124 (Accession No. AB201977) with the maximum identity (99%). A phylogenetic tree was constructed using the ClustalX program (Fig. 1), and confirmed the sequence analysis.
AC CE PT ED
Plackett-Burman Screening Design For the screening, various medium components and culture parameters were evaluated. Using a Plackett-Burman factorial design, each factor was examined on two levels: -1 for a low level and +1 for a high level [32]. This design is particularly practical, as it deals with the case when an investigator is faced with a large number of factors and is unsure which settings will likely produce the optimum responses [39]. Table 1 illustrates the design matrix with both coded and natural values of the studied variables along with the trial results. The Plackett-Burman experimental design was based on a first-order model: Y = β + ∑β X where Y is the response (enzyme activity), β is the model intercept, β is the linear coefficient, and X is the level of the independent variable. This model does not describe any interaction among factors, and is used to screen and determine the important factors that influence the response. In the present work, 15 assigned variables were screened in 16 trial experimental designs. All the experiments were carried out in triplicate and the averages of the protease activity were taken as the response (Table 1).
B.
Evaluation of Culture Conditions Affecting Alkaline Protease Production by Bacillus pseudofirmus Mn6
Screening a large number of variables is generally essential when an investigator is unsure which settings are likely to produce the optimal or nearly optimal responses. Thus, identifying the key response(s) and all possible process factors is a crucial step in the experimental design methodology. Additionally, literature and prior experience are also considered valuable resources for choosing the factor settings [39]. However, in this study, the factors affecting the alkaline protease production by Bacillus pseudofirmus Mn6 were identified using a Plackett-Burman statistical design. Settings of 15 independent variables were examined, as shown in Table 1. The experiments were carried out according to the experimental matrix presented in Table 1, where the alkaline protease (U/ml/min) was the measured response. A wide variation was found among the different trials (21.1 to 945.6 U/ml/min), as shown in Table 1, thereby emphasizing the importance of medium optimization to attain a higher productivity. The main effect of the examined variables on alkaline protease production was calculated as the difference between the average measurements made at the high level (+1) and low level (-1) of that factor, as presented graphically in Fig. 2.
Abdel-Fattah
et al.
AC CE PT ED
4
Phylogenetic relation between isolate Mn6 and other haloalkaliphilic bacilli from the GenBank database, according to 16S rDNA sequence similarity, showing close relationship to Bacillus pseudofirmus. Fig. 1.
B.
PSEUDOFIRMUS PROTEASE BY NUMERICAL MODELING
AC CE PT ED
OPTIMIZATION OF
Fig. 2.
5
Effect of environmental factors on alkaline protease activity (U/ml/min).
From an analysis of the regression coefficients, t-test, and p-value for the 15 variables (Table 2), the incubation time, peptone, and culture pH were identified as the most significant variables increasing the alkaline protease production with p-values of 0.031, 0.083, and 0.084, respectively, whereas FeSO4, (NH4)2SO4, the incubation temperature, and beef extract were the most significant variables decreasing the alkaline protease production with p-values of 0.023, 0.023, 0.033, and 0.083, respectively. A t-test of an individual effect allows an evaluation of the probability of finding the observed effect purely by chance, and some investigators have found that confidence levels greater than 70% are acceptable [38]. Thus, in the current experiment, variables with confidence levels exceeding 91.6% were considered as significant. Moreover, the quality of fit of the polynomial model equation was expressed by the coefficient
Statistical analysis of Plackett-Burman design showing coefficient values, t-test, and P-values for each variable affecting alkaline protease activity. Variables Coefficient t-test P-value Confidence level% Glucose 0-38.24 0-7.15 0.089 91.15 Starch 0-85.64 -16.00 0.040 96.03 Sodium acetate 0-71.20 -12.13 0.052 94.76 Yeast extract −020.71 −03.56 0.174 82.56 Beef extract -103.35 -17.63 0.036 96.39 Peptone −043.29 −07.63 0.083 91.71 Casein hydrolysate 0-44.97 0-7.69 0.082 91.76 -159.54 -27.58 0.023 97.69 (NH4)2SO4 KH2PO4 −−-7.53 −-1.23 0.433 56.64 NaCl −-66.78 -11.54 0.055 94.50 -162.32 -27.74 0.023 97.71 FeSO4 −07.86 −01.39 0.398 60.21 MgSO4 · 7H2O Culture pH −44.28 −07.55 0.084 91.62 Temperature -113.05 -19.43 0.033 96.73 Incubation time −118.82 −20.23 0.031 96.86 Table 2.
of determination R2, which was 0.99 for the full alkaline protease model. Thus, by neglecting the terms that were insignificant (p>0.084), the model equation for the alkaline protease activity was written as YAlkaline protease=332.34-85.64X2-71.2X3-103.35X5 YAlkaline protease=+43.29X6-159.54X8 YAlkaline protease=66.78X10 YAlkaline protease=-162.32X11+44.28X13-113.05X14+118.82X15 where X2, X3, X5, X6, X8, X10, X11, X13, X14, and X15 are starch, sodium acetate, beef extract, peptone, NH4SO4, NaCl, the culture pH, temperature, and incubation time, respectively. One of the advantages of a Plackett-Burman design is that it allows the operator to rank the effect of different variables based on the measured response, independent of its nature (either nutritional or physical factor) or sign (whether it contributes positively or negatively). Thus, from the confidence level of the variables, it was apparent that peptone, the pH, and incubation time were the most significant variables affecting the alkaline protease production. Among the tested carbon-nitrogen sources, peptone was the only source that showed a high significant positive effect. This reflects the vitality role of organic carbon-nitrogen for growth and enzyme synthesis [23], and matches other findings [12, 21, 25, 31, 33], where it was reported that the use of complex nitrogen sources, such as peptone and yeast extracts, increases the enzyme yield. Meanwhile, other reports have stated that a high protease yield was observed in the presence of ammonium sulfate, potassium nitrate, or sodium nitrate as the nitrogen source [20, 37]. However, in this study, the carbon sources of starch, acetate, and glucose had an adverse effect on the enzyme production, which agreed with other reports [6, 12, 29], where a reduction in protease production was observed with a high carbohydrate concentration, and particularly monosacchride sugars that can cause catabolic repression. Therefore, carbohydrates need
6
Abdel-Fattah
et al.
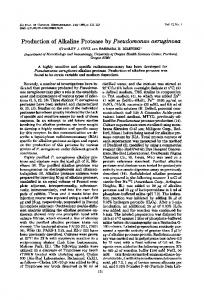
when increasing the incubation time, especially when the peptone level was high and the pH was low. Thus, to predict the optimal point, within the experimental constraints, a secondorder polynomial function was fitted to the experimental results (nonlinear optimization algorithm) of protease activity: Y=2326+276.3347 X1-641.84 X2+127.7139 X3 Y=+21.91944 X1X2-564.322 X1X3-66.8 X2X3 Y=+317.1347X12-449.615 X22-479.185 X32 where X1, X2, and X3 are the peptone, culture pH, and incubation time, respectively. At the model level, the correlation measures used to estimate the regression equation are the multiple correlation coefficients R and determination coefficient R2. The closer the value of R is to 1, the better the correlation between the measured and the predicted values. In this experiment, the value of R was 0.966 for the alkaline protease activity, indicating a high degree of correlation between the experimental and predicted values. Meanwhile, the value of the determination coefficient, R2=0.93, for the alkaline protease activity, being a measure of fit for the model, indicated that about 7% of the total variations were not explained by the enzyme activity. The optimal levels of the three components, as obtained from the maximum point of the polynomial model, were then estimated using the solver function of the Microsoft Excel tools and found to be peptone 2%, pH 9.5 (adjusted initially), and incubation time 60 h with a predicted activity of 3,213 U/ml/min. As such, the value of the enzyme activity in the optimized medium was 3.6-fold the value under basal conditions, thereby emphasizing the necessity and value of an optimization process. Similarly, the response surface methodology has also been used to optimize the alkaline protease production by Bacillus sp. RKY3 and Bacillus sp. L21, where the yields reached to 939 U/ml and 269 U/ml, respectively, under optimized conditions [35, 39]. Moreover, it has been reported that the
AC CE PT ED
to be added either continuously or in aliquots throughout the fermentation to supplement the exhausted component, keep the volume limited, and thereby reduce the power requirement. The incubation time showed a high significant positive effect on the enzyme production, as well as the pH. In previous literature, the effect of individual physical factors and varying the optimal incubation time and pH values are generally reviewed, although depending on the species producing the enzyme [10, 12, 29, 36, 39]. Based on the Plackett-Burman results, a preliminary experiment was carried out using different formulations of trial number 12, which gave the highest yield (903 U/ml/min), to find the most promising formula (data not shown). A medium with the composition (%) of Glucose, 0.2; Starch, 0.2; Yeast extract, 1; Peptone, 1; KH2PO4, 0.1; and MgSO4.7H2O, 0.01 was found to be the most potent and gave 2,623 U/ml/min after 48 h under shaking at 30oC and pH 11. Thus, it was used as the basal medium for the Box-Behnken design.
Response Surface Methodology for Optimization of Alkaline Protease Production by B. pseudofirmus Mn6
The response surface methodology is widely applied to optimize enzyme production and has already been reported in many studies [1, 2, 9, 11, 13]. Thus, to determine the optimum response region for alkaline protease activity, the significant independent variables (peptone, pH, and incubation time) were further studied at three levels: -1, 0, and +1. The 13trial design matrix illustrating the Box-Behnken design is represented in Table 3, along with the experimental results of protease activity. All the trials were performed in triplicate and the average observation was used. Presenting the experimental results in the form of surface plots, Fig. 3 shows that a lower pH supported a high protease activity level, whereas higher enzyme levels were attained
Box-Behnken factorial experimental design representing response of alkaline protease enzyme activity as influenced by peptone (g%), pH, and incubation time (h). Protease activity (U/ml/min) pH (X2) Incubation time (X3) Trial Peptone (X1) Measured Predicted 01 -1 (1)0. -1 (9)− −0 (48) 2,831 2,581 02 −1 (2)0. -1 (9)− −0 (48) 3,341 3,090 03 -1 (1)0. −1 (11) −0 (48) 1,002 1,253 04 −1 (2)0. −1 (11) −0 (48) 2,164 2,414 05 -1 (1)0. −0 (10) -1 (24) 1,210 1,196 06 −1 (2)0. −0 (10) -1 (24) 1,608 1,748 07 -1 (1)0. −0 (10) −1 (72) 2,566 2,580 08 −1 (2)0. −0 (10) −1 (72) 3,271 3,132 09 −0 (1.5) -1 (9)0 -1 (24) 1,656 1,845 10 −0 (1.5) −1 (11) -1 (24) 1,008 0694 −1 (72) 1,920 2,234 11 −0 (1.5) -1 (9)0 12 −0 (1.5) −1 (11) −1 (72) 1,004 0816 13 −0 (1.5) −0 (10) −0 (48) 2,326 2,326 Table 3.
OPTIMIZATION OF
B.
PSEUDOFIRMUS PROTEASE BY NUMERICAL MODELING
predicted optimal conditions, while monitoring the growth, alkaline protease activity, and residual glucose concentration in the optimized medium. As shown in Fig. 4, the basal medium showed a typical growth pattern and recorded a relatively low enzyme activity with the maximum (920 U/ml/min) attained after 20 h. Owing to the presence of two carbon sources in the optimized medium, namely glucose and starch, a diauxic growth pattern was exhibited as these carbon sources were successively consumed. Moreover, since Bacillus pseudofirmus is already known as a starch-degrading species [18], the presence of α-amylase resulted in the consumption of starch and an increase of alkaline protease in the medium. Furthermore, the glucose consumption in the optimized medium and continuation of growth after its complete depletion led to the conclusion that the production of the protease enzyme in the optimized medium was growth associated and controlled by the rate of carbon source consumption, where the maximum enzyme yield (3,360 U/ml/min) was attained after 60 h. Similarly, enzyme production was found to correspond with growth and reached a maximum level (410 U/ml) during the early stationary phase in the case of another newly isolated haloalkaliphilic Bacillus sp. [30]. The optimal conditions realized from the optimization experiment were verified experimentally and compared with the predicted optimum from the model. As a result, the estimated alkaline protease activity was 3,391 U/ml/min, where the predicted value from the polynomial model was 3,360 U/ml/min. Therefore, this high degree of accuracy (98%) confirmed the validity of the model under the following optimal conditions: Peptone 2%, Yeast extract 1%, Glucose 0.2%, Starch 0.2%, KH2PO4 0.1%, MgSO4 0.01%, at pH 9.5, with a cultivation temperature of 30oC and incubation time of 60 h. When screening the factors affecting the production of certain secondary metabolites, it is very important to test as many factors as possible and identify their individual significance. Thus, a Plackett-Burman design offers an effective and fast screening procedure that can mathematically compute the significance of a large number of factors in one experiment, thereby saving time and providing credible information on each component. Although interaction is not included in this design, it is not the first priority when screening a large number of variables. Thus, only the key factors with positive significance are selected for additional optimization, whereas those with a high negative effect on the bioprocess can be dropped from all further experiments. This highlights the value of a Plackett-Burman design as an effective tool for elucidating the most important variables affecting the response. Consequently, this design is recommended when more than five factors are under investigation. Meanwhile, applying a Box-Behnken design to optimize the selected factors for maximal production is an efficient method that evaluates the interactive effect of each factor.
AC CE PT ED Three-dimensional response surfaces representing alkaline protease enzyme yield (U/ml/min) from B. pseudofirmus Mn6 as affected by culture conditions. Fig. 3.
presence of peptone at a concentration of 0.075 g% and incubation time of up to 144 h are optimal for Bacillus sp., giving a yield of 750 U/ml [33]. In the present study, the maximum yield was attained optimally at an initial pH of 9.5 and after an incubation time of 60 h, which agrees with the reported classification of Bacillus pseudofirmus as an obligate alkaliphile, making it unable to grow well at neutral pH values [19].
Verification of Model and Growth Pattern
To determine the accuracy of the quadratic polynomial, a verification experiment was carried out under the basal and
7
Abdel-Fattah
et al.
AC CE PT ED
8
Fig. 4.
Time course of growth and alkaline protease activity by B. pseudofirmus Mn6 in basal and optimized media.
In addition, it converts the bioprocess factor correlations into a mathematical model that predicts where the optimum is likely to be located. Therefore, applying such experimental designs is strongly recommended to microbial industry sponsors to enable highly efficient and profitable bioprocesses.
Acknowledgment
The authors would like to acknowledge the Arab Science and Technology Foundation (ASTF) and Abdul Latif Jameel Community Services Program (ALJCSP) for their funding of the present work within the framework of grant No. BT06105.
REFERENCES
1. Abdel-Fattah, Y .R. and Z. A. Olama. 2002. L-Asparaginase produ3.ction by Pseudomonas aeruginosa in solid-state culture: Evaluation and optimization of culture conditions using factorial designs. Proc. Biochem. 38: 115-122. 2. Abdel-Fattah, Y. R., H. M. Saeed, Y. M. Gohar, and M. A. El-Baz. 2005. Improved production of Pseudomonas aeruginosa uricase by optimization of process parameters through statistical experimental designs. Proc. Biochem. 40: 1707-1714.
3. Anson, M. L. 1938. Estimation of pepsin, papain and cathepsin with hemoglobin. J. Gen. Physiol. 22: 79-89. 4. Anwar, A. and M. Saleemuddin. 1998. Alkaline proteases: A review. Biores. Technol. 64: 175-183. 5. Ausubel, F. M., R. Brent, R. E. Kingston, D. D. Moore, J. G. Seidam, J.A. Smith, and K. Struhl, K. (eds). 1999. Short Protocols in Molecular Biology. John Willey and Sons, Inc. NY. 6. Beg, Q. K., V. Sahai, and R. Gupta. 2003. Statistical media optimization and alkaline protease production from Bacillus mojavensis in a bioreactor. Proc. Biochem. 39: 203-209. 7. Beg, Q.K., R. K. Saxena, and R. Gupta. 2002. De-repression and subsequent induction of protease synthesis by Bacillus mojavensis under fed batch operations. Process Biochem. 37: 1103-1109. 8. Box, G. E. P. and D. W. Behnken. 1960. Some new three level designs for the study of quantitative variables. Technometrics 2: 455-475. 9. Chang, Y.-N., J.-C. Huang, C.-C. Lee, I.-L. Shih, and Y.-M. Treng. 2002. Use of response surface methodology to optimize culture medium for production of lovastatin by Monascus rubber. Enz. Microbial Technol. 30: 889-894. 10. Denizci, A. A., D. Kazan, E. C. A. Abeln, and A. Erarslan. 2004. A newly isolated Bacillus clausii GMBAE 42: An alkaline protease producer capable to grow under highly alkaline conditions. J. Appl. Microbiol. 96: 320-327. 11. El-Helow, E. R., Y. R. Abdel-Fattah, K. M. Ghanem, and E. A. Mohamad. 2000. Application of the response surface methodology
OPTIMIZATION OF
12.
13.
27. 28. 29. 30.
PSEUDOFIRMUS PROTEASE BY NUMERICAL MODELING
15.
16.
17.
18.
19. 20.
21.
22.
23.
24. 25.
26.
31.
32.
33.
34.
35.
36.
37.
38.
39.
40.
41.
9
slant, age, transfer and isolate number and physiological state of culture. Biotechnol. Lett. 7: 413-418. Nobuaki, F. and Y. Kazuhiko. 1987. Decomposition of gelatin layers on x-ray films by the alkaline protease from Bacillus sp. Hakkokogaku Kaishi 65: 531-534. Page, R. D. M. 1996. TREEVIEW: An application to display phylogenetic trees on personal computers. Comp. Appl. Biosci. 12: 357-358. Patel, R., M. Dodia, and S.-P. Singh. 2005. Extracellular alkaline protease from a newly isolated haloalkaliphilic Bacillus sp.: Production and optimization. Proc. Biochem. 40: 3569-3575. Patel, R., M. Dodia, and S. P. Singh. 2005. Extracellular alkaline protease from a newly isolated haloalkaliphilic Bacillus sp.: Production and optimization. Process Biochem. 40: 3569-3575. Patel, R. K., M. S. Dodia, R. H. Joshi, and S. P. Singh. 2006. Production of extracellular halo-alkaline protease from a newly isolated haloalkaliphilic Bacillus sp. isolated from seawater in Western India. World J. Microbiol. Biotechnol. 22: 375-382. Plackett, R. L. and J. P. Burman. 1946. The design of optimum multi-factorial experiments. Biometrika 33: 305-325. Puri, S., Q.-K. Beg, and R. Gupta. 2002. Optimization of alkaline protease production from Bacillus sp. by response surface methodology. Curr. Microbiol. 44: 286-290. Rao, M. B., A. M. Tankasle, M. S. Ghatge, and V. V. Deshpande. 1998. Molecular and biotechnological aspects of microbial proteases. Microbial Mol. Biol. Rev. 62: 597-635. Reddy, L. V. A., Y.-J. Wee, J.-S. Yun, and H.-W. Ryu. 2008. Optimization of alkaline protease production by batch culture of Bacillus sp. RKY3 through Plackett-Burman and response surface methodological approaches. Biores. Technol. 99: 2242-2249. Shikha, S. A. and N.-S. Darmwal. 2007. Improved production of alkaline protease from a mutant of alkalophilic Bacillus pantotheneticus using molasses as a substrate. Biores. Technol. 98: 881-885. Sinha, N. and T. Satyanarayana. 1991. Alkaline protease production by thermophilic B. licheniformis. Indian J. Microbiol. 31: 425-430. Stowe, R. A. and R. P. Mayer. 1966. Efficient screening of process variables. Ind. Eng. Chem. 58: 36-40. Tari, C., H. Genckal, and F. Tokatli. 2006. Optimization of a growth medium using a statistical approach for the production of an alkaline protease from a newly isolated Bacillus sp. L21. Proc. Biochem. 41: 659-665. Varela, H., M. D. Ferrari, L. Belobradjic, R. Weyrauch, and M. L. Loperena. 1996. Effect of medium composition on the production by a new Bacillus subtilis isolate of protease with promising unhairing activity. World J. Microbiol. Biotechnol. 12: 643-645. Vidyasagar, M., S.-B. Prakash, and K. Sreeramulu. 2006. Optimization of culture condition for the production of haloalkaliphilic thermostable protease from an extremely halophilic archaeon Halogeomericum sp. TSS101. J. Lett. Appl. Microbiol. 43: 385-391.
AC CE PT ED
14.
for optimizing the activity of an aprE-driven gene expression system in Bacillus subtilis. Appl. Microbiol. Biotechnol. 54: 515520. Falahatpishe, H., M. Jalali, N. Badami, N. Mardani, and K. Khosravi-Darani. 2007. Production and purification of a protease from an alkalophilic Bacillus sp. 2-5 strain isolated from soil. Iranian J. Biotechnol. 5: 110-113. Francis, F., A. Sabu, K.-M. Nampoothiri, S. Ramachandran, S. Ghosh, G. Szakacs, and A. Pandey. 2003. Use of response surface methodology for optimizing process parameters for the production of α-amylase by Aspergillus oryzae. Biochem. Eng. J. 15: 107-115. Gupta, R., Q. K. Beg, S. Khan, and B. Chauhan. 2002. An overview on fermentation, downstream processing and properties of microbial alkaline proteases. Appl. Microbiol. Biotechnol. 60: 381-395. Haaland, P. D. 1989. Statistical problem solving, pp. 1-18. In P. D. Haaland (ed.). Experimental Design in Biotechnology. Marcel Dekker, Inc., New York. Hall, T. A. 1999. BioEdit: A user-friendly biological sequence alignment editor and analysis program for Windows 95/98/NT. Nucl. Acids Symp. Ser. 41: 95-98. Hameed, A., T. Keshavarz, and C. S. Evans. 1999. Effect of dissolved oxygen tension and pH on the production of extracellular protease from a new isolate of Bacillus subtilis K2, for use in leather processing. J. Chem. Technol. Biotechnol. 74: 5-8. Horikoshi, K. 1971. Production of alkaline enzymes by alkalophilic microorganisms. Part II. Alkaline amylase produced by Bacillus No. A-40-2. Agric. Biol. Chem. 35: 1783-1791. Horikoshi, K. 2006. Alkaliphiles, Genetic Properties and Applications of Enzymes, p. 4. Kodansha Ltd., Tokyo. Johnvesly, B. and G. R. Naik. 2001. Studies on production of thermostable alkaline protease from thermophilic and alkaliphilic Bacillus sp. JB-99 in chemically defined medium. Proc. Biochem. 37: 139-144. Joo, H.-S., C. G. Kumar, G.-C. Park, S. R. Paik, and C. S. Chang. 2003. Oxidant and SDS-stable alkaline protease from Bacillus clausii I-52: Production and some properties. J. Appl. Microbiol. 95: 267-272. Kojima, M., M. Kanai, M. Tominaga, S. Kitazume, A. Inoue, and K. Horikoshi. 2006. Isolation and characterization of a feather-degrading enzyme from Bacillus pseudofirmus FA30-01. Extremophiles 10: 229-235. Kole, M. M., I. Draper, and D. F. Gerson. 1988. Production of protease by Bacillus subtilis using simultaneous control of glucose and ammonium concentrations. J. Chem. Technol. Biotechnol. 41: 197-206. Kumar, C. G. and H. Takagi. 1999. Microbial alkaline protease: From a bioindustrial view. Biotechnol. Adv. 17: 561-594. Mehta, V. J., J. T. Thumar, and S. P. Singh. 2006. Production of alkaline protease from an alkaliphilic actinomycete. Biores. Technol. 97: 1650-1654. Nehete, P. N., V. D. Shah, and R. M. Kothari. 1985. Profiles of alkaline protease production as a function of composition of the
B.