Journal of Materials and Environmental Sciences ISSN : 2028-2508
J. Mater. Environ. Sci., 2017 Volume 8, Issue 12, Page 4199-4212
http://www.jmaterenvironsci.com Copyright © 2017, University of Mohammed 1er Oujda Morocco
Biosorption of amaranth red in aqueous solution onto treated and untreated lignocellulosic materials (pineapple peelings and coconut shells) N. G. Ndifor-Angwafor1, I-H. Kuete Tiotsop1, D. R. Tchuifon Tchuifon1, C. Ngakou Sadeu1, A. Bopda1, S. G. Anagho1,2*, T. A. Kamdem1 1
Laboratory of Noxious Chemistry and Environmental Engineering, Department of Chemistry, Faculty of Science, University of Dschang, P.O. Box 67, Dschang, Cameroon 2 Department of Chemistry, Faculty of Science, University of Bamenda, P.O. Box 39, Bamenda, Cameroon
Received 18 Feb 2017, Revised 09 Jun 2017, Accepted 11 Jun 2017
Keywords
Biosorption; Amaranth red; Lignocellulosic materials; Pineapple peeling; Coconut shell
ANAGHO Solomon GABCHE
[email protected] +237 677 578 567
Abstract The removal of amaranth red dye from aqueous solution by untreated and treated pineapple peelings and coconut shells with phosphoric acid was studied in batch mode at room temperature. The study highlighted several parameters such as the contact time, the mass of the adsorbent, the pH of the solution, and the initial concentration of the dye. The results showed that the removal of dyes by the bioadsorbents depended on the pH and the initial concentration of the adsorbate. The adsorption capacity increased with increasing amaranth red dye concentration and the mass of the bioadsorbent. It was also established that maximum adsorption took place at pH = 2 for different adsorbents. The treated raw materials have greater surface area than the untreated materials. In order to deduce the adsorption mechanism, four simplified kinetic models were investigated. The kinetic data were well represented by the pseudo second order kinetic model giving high correlation coefficients R² values for all the biosorbents suggesting that chemisorption was the rate determining step. An equilibrium study of the adsorption process also showed that the Langmuir model best described the adsorption on all the biosorbents. The values of energy obtained from the Temkin isothermare also positive, this shows that the adsorption process isexothermic. These results indicate that pineapple peelings and coconut shells have a high potential as adsorbents for removing amaranth red dye from aqueous solution
1. Introduction The intensive industrialization considered as key to economic development, started in the last century and is at the origin of the proliferation in the environment of various pollutants difficult to eliminate. The products resulting from the industrial activities represent a danger to man and his environment (water, land and air pollution), because of their very low biodeterioration and the slowness of their elimination. One then identifies pollutants such as: the phenolic derivatives, heavy metals, pesticides, dyes... They are however recognized to have harmful effects on human and also contribute to the destruction of the environment [1]. The dyes show chemical resistance, long lifespan on the products to which they are built-in, photolytic stability and great resistance to micro-organisms [2]. They are largely used by human in the process of variation of colours in multiple sectors: textile industries, printing, photography colour, beauty products and pharmaceutical, leather industries, the food additives and drinks [3,4].Their presence in water means a considerable pollution and man is directly or indirectly exposed. Amaranth red dye is recognized as being able to cause in humans beyond 0.15 mg/kg [5], acute and chronic toxicity, tumours, allergies, respiratory problems and defects at birth [6]. It is also suspected to be carcinogenic, mutagenic and genotoxic [7]. It became a major call for concern for most researchers, the environmental agency of the industrialized and developing countries. Wastewater treatment methods such as: flocculation, advanced oxidation processes (AOP), ion exchange, electrolysis, membrane processes, coagulation, photocatalytic processes, biological treatments and adsorption [6,8] have been employed. The majority of these techniques are very expensive and difficult to implement especially when they are applied to effluents of high flow or having weak concentrations of pollutants. Adsorption proves to be more effective and cheaper, equipment easy to implement. However the choice of the adsorbent remains a significant Ndifor-Angwafor et al., J. Mater. Environ. Sci., 2017, 8 (12), pp. 4199-4212
4199
worry. The activated carbon, often proves to be less accessible to all the researchers, one is then directed to the use of materials coming from the biomass which is largely available for the elimination of the pollutants in solution by the process of biosorption [9]. Several works already carried out with these materials showed that they are characterized by various chemical functions on their surfaces, of appreciable specific surfaces and have good adsorbent properties [3,8,10]. Thus Guerrero-Coronilla et al. 2014 [7] used materials of maritime origin, Adii et al. 2013 [10] used the grenade peeling and Al-Sultani et al.2012 [8] used rice husks for the elimination of the amaranth red and phenol respectively. In this study, pineapple peelings and coconut shells untreated and treated with phosphoric acid were used for the biosorption of amaranth red from water. The optimization of sorption parameters, sorption isotherms and kinetics were investigated in batch mode. 2. Materials and methods 2.1. Preparation of biosorbents Pineapple peelings (PAB) and coconut shells (BCB) were collected from a pre-consumer agricultural product in the Mungo Division, Littoral Region of Cameroon. They were dried under sunlight until all the moisture evaporated. The material was ground to fine powder. The leaves were washed under running water to remove dirt, air-dried for a week and ground into fine powder. The resulting material was sieved in the size 250 mesh. One part (8 g) of dried pineapple peelings and coconut shells were mixed with concentrated phosphoric acid (1 M). The mixing are agited at 200 rpm during 5h. The pineapple peelings (PAH) and coconut shells (BCH) were filtered out, washed with distilled water to remove free phosphoric acid and dried at 80°C in hot air oven for 2 h. The materials were placed in an airtight container for further use. 2.2 Characterization of materials Surface area: The specific surface areas of the biosorbent were determined by the adsorption of acetic acid. For this, 20 mL of acetic acid solution of concentration range between 4.10-3 and 8.10-3 mol/L are agited with 40 mg of each material. The various mixtures were filtered after 60 min of agitation. The residual concentration was determined by volumetric titration using sodium hydroxyde [11]. Specific surfaces Sf (m2/g) were calculated using equation 1 [11]: 𝑆𝑓 = 𝑄𝑚𝑎𝑥 𝑁𝑆𝐴 (1) where N = 6.02 x 10²³ mol-1 (Avogadro number), SA = 21Å2 , Qm (mg/g) is the maximum capacity of acid adsorbed. pH and pHZPC: The pH at the point of zero charge (pHZPC) of biosorbents was determined and carried out by adding 50 mg of each material to 25 mL solution of 0.1 mol/L NaCl whose initial pH had been measured and adjusted with NaOH or HCl between 2-12. The containers were sealed and placed on an agitator for 48 hours at ambient temperature, after which the pHfinal was measured. The pHZPC being the point where the curve pHfinal according to the pHinitial intercepts the line pHfinal = pHinitial Fourier Transform Infra-Red: Adsorbents were characterized by Infra-Red Fourier Transform Spectroscopy to identify the functional groups and chemical bonding on the adsorbents. The FT-IR was recorded in the wave number range 4000 cm-1 – 400 cm-1 using a Bruker, Alpha-P Spectrometer in Attenuated Total Reflectance mode 2.3. Preparation of dye solution Amaranth red (E123) or Acid Red 27 (C20H11N2Na3O10S3), is an anionic sulphonated azo dye derivate was used to prepare the simulated wastewater. An accurately weighed quantity of amaranth red was dissolved in distilled water to prepare the stock solution (500 mg/L). Experimental solutions were obtained by successive dilutions. 2.4. Batch adsorption experiments Adsorption experiments were carried out by mechanical agitation at room temperature. For each run, 20 mL of amaranth red dye solution of known initial concentration (between 20 -60 mg/L) was treated with a known weight of each biosorbents. After agitation, the solution was filtered, and the filtrate analyzed to obtain the residual concentration amaranth red using a UV/Vis spectrophotometer (Jenway, model 6715). Ndifor-Angwafor et al., J. Mater. Environ. Sci., 2017, 8 (12), pp. 4199-4212
4200
HO Na+ -O3S
SO3- Na+
NN
SO3- Na+-
Figure 1: Chemical structure of amaranth red Similar measurements were carried out by varying adsorbent doses, pH of the solution, biosorbent treatment and the initial concentrations of the solution. The percentage removal (%R) of dye, and the amount (Q e) of dye adsorbed were calculated using the following expressions: (𝐶 −𝐶 ) %𝑅 = 0 𝑡 𝑥100 (2) 𝐶0 (𝐶0 −𝐶𝑡 ) 𝑥𝑉 𝑚
𝑄𝑡 = (3) C0 is the initial concentration of the dye, Ce is its equilibrium concentration, Ct is the concentration of the dye at the time t, V is the volume of the solution, and m is the mass of the absorbent 2.4.1. Effect of contact time To determine the effect of agitation time on the adsorption process, 0.03 g of ground adsorbent was agitated in a 20 mL solution of amaranth red of initial concentration 50 mg/L for different time intervals. At each time t, the solution was rapidly filtered and the residual concentration determined by UV/Vis spectrophotometry. The amount (Qt) of amaranth red adsorbed was calculated using equation (3). 2.4.2 Effect of amount of adsorbent In this set of experiments, different masses of the adsorbents ranging from 0.01 to 0.08g were treated with 20 mL solution of amaranth of initial concentration 50 mg/L. 2.4.3. Effect of initial pH For each adsorbent, the optimal mass of adsorbent obtained at the end of the preceding study was treated with 20 mL of aqueous solution of 50 mg/L of amaranth red in the pH range from 2.0 – 11.0. pH adjustment was done by adding either HCl or NaOH. 2.4.4. Effect of biosorbent treatment To investigate the effect of biosorbent treatment, adsorption of amaranth red on biosorbent was carried out using 80 mg of biosorbent, 20 mL of solution of concentration 50 mg/L at initial pH = 2, agitation speed 175 rpm at 60 min equilibrium time. 2.4.5. Batch equilibrium experiments Isotherm experiments were carried out by agitating 20 mL of amaranth red dye of concentration ranging from 20 to 60 mg/L with 30 mg of each biosorbent in a 100 mL flasks at room temperature at optimum pH of 2 and a constant agitation speed of 175 rpm for 60 minutes.
3. Results and discussion 3.1. Characterization of materials The surface characteristics of the untreated and treated biosorbents used in this study are shown in table 1. According in the result in table 1, the acid treatment permitted the development of surface micropores on the materials because the treated biosorbents have a higher surface area than the untreated biosorbents. The increase in the specific surface testifies important modifications which have taken place at the level of the porous structure of these materials. All the biosorbents have acidic character
Ndifor-Angwafor et al., J. Mater. Environ. Sci., 2017, 8 (12), pp. 4199-4212
4201
Table 1: Characteristics of the biosorbents PAB (untreated pineapple peeling)
PAH (treated pineapple peeling)
BCB (untreated coconut shells)
BCH (treated coconut shells)
Surface area (m2/g)
31.52
42.82
30.22
31.38
pH pHpzc
6.57 5.00
6.45 4.01
6.86 5.85
6.76 4.71
parameters
a
0.05
0.10
Absorbance Units 0.15 0.20
0.25
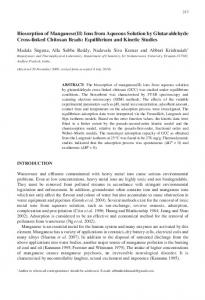
IR spectra The IR spectroscopy was used to determine the various functional groups present in adsorbent materials. The spectra obtained are shown below.
b
3500
3000
2500 2000 Wavenumber cm-1
1500
1000
500
Figure 2: IR Spectra of the untreated (PAB in a) and treated (PAH in b) pineapple peelings C:\Documents and Settings\LCA\Application Data\OPUS_65\Data\Search\PABIR.0
PABIR
Instrument type and / or accessory
04/09/2015
C:\Documents and Settings\LCA\Application Data\OPUS_65\Data\Search\PAHIR.0
PAHIR
Instrument type and / or accessory
04/09/2015
0.05
Absorbance Units 0.10
0.15
Seite 1 von 1
c d 3500
3000
2500 2000 Wavenumber cm-1
1500
1000
500
Figure 3: IR Spectra of untreated (BCB in c) and treated (BCH in d) coconut shells C:\Documents and Settings\LCA\Application Data\OPUS_65\Data\Search\BCBIR.0
BCBIR
Instrument type and / or accessory
04/09/2015
C:\Documents and Settings\LCA\Application Data\OPUS_65\Data\Search\BCHIR.1
BCHIR
Instrument type and / or accessory
04/09/2015
Comparing the adsorption peaks with those obtained for lignocellulosic materials by (Al-Sultani et al. 2012 and Seite 1 von 1 Hameed et al. 2009) [8,12], the following analyses can be obtained: 3323 cm-1 for PAB and PAH; 3332 cm-1 for BCB and BCH: -OH vibration of chelate and phenolic groups in the main constituents of lignocellulosic materials; 2950-2800 cm-1 for PAB, PAH, BCB and BCH: CH3, -CH and -CH2 elongation vibration in cellulose, hemicelluloses and lignin; 1800-1500 cm-1 for PAB, PAH, BCB and BCH: -C=O elongation vibration; 1500-1200 cm-1 for PAB, PAH, BCB and BCH: O-H or –C-O deformation vibration of alcohols and – NO2 of aromatic nitro compounds; 1200-1000 cm-1 for PAB, PAH, BCB and BCH: –C-O elongation vibration in carboxylic acids, lactones, esters or aliphatic amines; Ndifor-Angwafor et al., J. Mater. Environ. Sci., 2017, 8 (12), pp. 4199-4212
4202
Figures 2 and 3 shows that, all the spectra have the same peaks. This is proof that both biosorbents have identical functional groups on their surfaces. 3.2. Biosorption of amaranth red in batch mode Effect of initial pH pH is one of the most important parameters affecting the adsorption process of the dye in aqueous solution, which affects surface charge on the adsorbent and ionization in solution. The influence of pH on the quantity of amaranth red dye adsorbed is presented in figure 4 below. It is expected that the rate of amaranth red dye adsorption onto the biosorbent with pH when ion exchange is one of the sorption processes. According to figure 4, the removal of amaranth red from aqueous solution is higly dependent on pH of the solution which affects the surface properties of biosorbents and the dye structure. 25 PA B PA H
Qads (mg/g)
25 20
A
15 10
Qads (mg/g)
30
20
10 5
0
0
pH
7
12
B
15
5
2
BC B BC H
2
pH
7
12
Figure 4: Effect of initial pH on adsorption capacity of amaranth red on pineapple peeling (A) and coconut shells (B). Conditions: C0 = 50 mg/L; m = 30 mg; t = 60 min; V = 20 mL; Speed = 175 rpm. The adsorption capacity of amaranth red on the four materials decreases with increase in pH 2-11. At pH = 2, high adsorption takes place (27.481 mg/g; 25.481 mg/g; 21.235 mg/g and 18.37 mg/g respectively for PAB; PAH; BCB and BCH). This can be explain by the fact that at pH = 2, the positive charge dominates the surface of the biosorbents, and high electrostatic attraction between the positive charge of the surface of the biosorbents and the negative charges of the amaranth red. This phenomenon can also be explained by the fact that at pH 2, lower than the pHPZC of the four biosorbents, the surface of materials are positively charged and consequently the adsorption of the anion compounds creating a strong electrostatic interaction between the surface of materials and the molecule of the adsorbate [13]. The concentration of the hydrogen ions H + affects the ionization level of the amaranth red and the surface properties of the biosorbents. This is in agreement with the results of Al-Sultani et al.2012 [8] and Nanganoa et al. 2014 [6] on the adsorption of phenol and amaranth red respectively. However, the more pH increases, the more OH- free which are able to compete with the anionic species of amaranth red active sites. it was reported previously that some acidic dyes such as amaranth red are negatively charged even in highly acid solution due to the presence of sulfonicgroups (pKa < 0) and N=N bonds in their structure. But at pH 7, we observe a light increase of adsorption capacity, which is explained by the diffusion of the pollutant on the surface of the materials. Effect of agitation time The time of agitation is a very significant parameter in the adsorption process, because it makes it possible to determine the time necessary to reach adsorption equilibrium and study adsorption kinetic models. The results are presented in figure 5. Figure 5 shows the evolution of the adsorption capacity of amaranth red with time at room temperature. The results show that the adsorption process took place in three phases. The first phase occurred very fast, and takes place during the first 05 minutes of adsorption. This is explained by the great availability of all the adsorption sites of the biosorbents. Ndifor-Angwafor et al., J. Mater. Environ. Sci., 2017, 8 (12), pp. 4199-4212
4203
35 PAB PAH BCB BCH
30
Qads(mg/g)
25 20 15 10 5 0 0
20
40
60
t (min)
80
100
120
Figure 5: Effect of contact time on adsorption capacity of amaranth red by pineapple peeling and coconut shells. Conditions: C0 = 50 mg/L; m = 30 mg; t = 60 min; V = 20 mL; Speed = 175 rpm. The second phase that occurred was less fast, and takes place within 05-60 minutes for the four materials where the adsorption capacity at the equilibrium point (60 minutes) is 29.8 mg/g for PAB; 26.567 mg/g for PAH; 17.296 mg/g for BCB and 15.574 mg/g for BCH. This can be explained by the fact that the molecules of amaranth red obstruct the pores and slow down the rate of adsorption. The third phase was slow adsorption, and takes place within 60-100 minutes for PAB, PAH, BCH and BCB, and the adsorption capacities are almost constant representing the formation of a layer. Effect of amount of biosorbent To deduce the influence of the mass of biosorbent material on the adsorption of amaranth red, different masses of the materials were varied between 10 mg and 80 mg for 60 min. Both concentration and volume of pollutant solution were kept fixed at 50 mg/L and 20 mL respectively at pH=2. The results are presented in figures 6A and 6B. 120
100 90 80 70 60 50 40 30 20 10 0
A
100
% adsorbed
% adsorbed
80 60 PA B PA H
40 20 0 0
m (mg) 50
B
100
BC B BC H
0
m (mg) 50
100
Figure 6: Effect of adsorbent dose on the adsorption capacity of amaranth red by pineapple peelings (A) and coconut shells (B). Conditions: C0 = 50 mg/L; m = 30 mg; t = 60 min; V = 20 mL; speed = 175 rpm. The effect of varying the biosorbent dose is shown in figure 6, the percentage of amaranth red removed increased with the biosorbent amount. For fixed initial dye concentration, the percentage of dye removal increased with increasing amount of biosorbents which provides greater surface area and increased the number of active sites. The percentage adsorbed are: 99.42 for PAB; 97.101 for PAH; 89.321 for BCB and 88.062 for BCH corresponding to a maximum amount of 80 mg for all four materials. It was also observed that the Ndifor-Angwafor et al., J. Mater. Environ. Sci., 2017, 8 (12), pp. 4199-4212
4204
percentage of the dye removed by the untreated material is greater than that of the treated material. This shows that the adsorption of the dye doesn’t depend on the surface area but depends on the functional group on the biosorbent. The same results were reported by Adiiet al.2013 [10] and Nanganoa et al.2014 [6], who also worked on the adsorption of the red amaranth by pomegranate peel and smectite clay respectively. Biosorbents treatment Figure 7 shows the retention of amaranth red on raw and processed materials 120
% adsorbed
100
PAB
PAH BCB
80
BCH
60 40 20 0 1
2
Adsorbents
3
4
Figure 7: Uptake of amaranth red onto treated and untreated pineapple peelings and coconut shells. C0= 50 mg/L; m = 80 mg; pH = 2; t = 60 min; V= 20 mL; speed = 175 rpm. The analysis of this histogram shows that the percentage adsorption of amaranth red by the biosorbents treated with phosphoric acid was less than those obtained with untreated materials. This result can be explained by the fact that during the treatment, some components of the lignocellulosic materials present before the treatment having great affinity towards amaranth red, has been solubilized or destroyed. However, it was observed that PAB has a higher percentage adsorption than BCB, which explains the fact that BCB has more extractibles than PAB. Moreover PAB has a better specific surface than BCB. 3.3. Kinetic studies Modeling of kinetic data is important for industrial application of the adsorption process, because it gives information that can be used to compare different adsorbents under different operating conditions [14]. The kinetic models used to investigate and describe the adsorption of amaranth red dye are the pseudo-first order, pseudo-second order, intra particle diffusion and Elovich models. Pseudo-first order The pseudo-first order equation is generally expressed as [15,16]: 𝑑𝑄𝑡 = 𝐾1 (𝑄𝑒 − 𝑄𝑡 ) 𝑑𝑡
(4) where 𝑄𝑒 and 𝑄𝑡 are the adsorption capacities at equilibrium and at time t, respectively (in mg/g) and K 1 is the rate constant for the pseudo-first order adsorption (1/min). After integration and applying boundary conditions t = 0, Qt = 0; and at t = t, Qt = Qt, the integrated form of equation (4) becomes: ln 𝑄𝑒 − 𝑄𝑡 = ln 𝑄𝑒 − 𝐾1 𝑡 (5) The linear form of the pseudo-first order model is given in figures 8A and 8B respectively. Pseudo-secondorder The pseudo-second order chemisorption kinetic equation [17,18] is expressed as in equation 6: 𝑑𝑄𝑡 = 𝐾2 (𝑄𝑒 − 𝑄𝑡 )2 (6) 𝑑𝑡 where 𝐾2 is the rate constant for the pseudo-second order adsorption (g/mg.min). Ndifor-Angwafor et al., J. Mater. Environ. Sci., 2017, 8 (12), pp. 4199-4212
4205
For boundary conditions are that, at t = 0, Qt= 0; and at t = t, Qt = Qt, the integrated and rearranged form of equation (6) is: 𝑡 1 𝑡 = 𝐾 𝑄2 + 𝑄 (7) 𝑄 𝑡
2 𝑒
𝑒
In equation (7), 𝐾2 𝑄𝑒2 = ℎ is the initial rate of adsorption The linear form of the pseudo-second order model is given in figures 9A and 9B respectively 2
2
1.5
A
1 ln (Qe-Qt)
ln (Qe -Qt)
PA B PA H
0.5
BC B BC H
B
1.5 1 0.5
0 0
20
40
60
0
-0.5
0
20
40
60
-0.5
-1
t(min)
t(min)
7
4.5 4 3.5 3 2.5 2 1.5 1 0.5 0
PA B PA H
A
6
t/Qt (min.g/mg)
t/Qt (min.g/mg)
Figure 8: Kinetics of amaranth red adsorption according to the pseudo-first order model onto pineapple peelings (A) and coconut shells (B). BC B BC H
B
5 4 3 2 1 0
0
50
t (min) 100
150
0
50
t (min) 100
150
Figure 9:Kinetics of amaranth red adsorption according to the pseudo-second order onto pineapple peelings (A) and coconut shells (B) Intraparticle diffusion model The intraparticle diffusion model was proposed by Weber and Morris 1963 [19]. One attends a transport of the molecules in aqueous phase towards the surface of the solid phases in the pores by diffusion [3]. The equation is: 1
𝑄𝑡 = 𝐾𝑖𝑛𝑡 𝑡 2 + 𝐶 (8) where 𝐾𝑖𝑛𝑡 is the rate constant of the diffusion intraparticle in (mg/g min1/2) The diffusion coefficient D is deduced from the following formula: 0.03𝑟 2
𝑡1/2 = 𝐷 0 (9) where: 𝑡1/2 = time of half-reaction (reaction of adsorption to equilibrium) in second; 𝑟0 diameter of the grains of adsorbent in cm;D = coefficient of intraparticle diffusion (cm2/s). The linear form of the intraparticle diffusion model is given in figures 10A and 10B respectively
Ndifor-Angwafor et al., J. Mater. Environ. Sci., 2017, 8 (12), pp. 4199-4212
4206
PA B PA H
32
A
28
Qe (mg/g)
Qe (mg/g)
30
26 24 22 20 1
6 1/2 t
19 18 17 16 15 14 13 12 11 10
11
BC B BC H
B
1
6 t1/2
11
Figure 10: Kinetics of amaranth red adsorption according to the intraparticule diffusion model onto pineapple peelings (A) and coconut shells (B). Elovich kinetic model The Elovich model is based on a kinetic development on the basis of the hypothesis that the sites of adsorption increase exponentially with adsorption, which implies a multi-layer adsorption [20]. The equation is: 𝑑𝑄𝑡 = 𝛼𝑒 −𝛽𝑄𝑡 (10) 𝑑𝑡 The linear form after integration at (Qt = 0, Qt = Qt, t = 0 and at t = t) is: 1 1 𝑄𝑡 = 𝛽 ln 𝛼𝛽 + 𝛽 ln 𝑡 (11) where𝑄𝑡 is the adsorption capacity at time t (mg/g); α is the initial adsorption rate (mg/g.min); β is the adsorption constant (g/mg) and t the time of adsorption. The linear form of Elovich model is given in figure 11A and 11B respectively 32
18
PA B PA H
30
BC B BC H
17
Qe (mg/g)
Qe (mg/g)
16 28
A
26 24
14 13 12
22
11
20
10 1
2
ln t
3
4
5
B
15
1
2
3
ln t
4
5
Figure 11: Kinetics of amaranth red adsorption according to the Elovich model onto pineapple peelings (A) and coconut shells (B). The table below gives the various constants obtained starting from the exploitation of the studied kinetic models. From the above table, the adsorption of amaranth red by the biosorbents is having a positive relationship with the pseudo-second order kinetic model, since the correlation coefficients are close to the one: 0.998 for PAB; 0.999 for PAH and 0.997 for BCB and BCH. The applicability of the pseudo-second order kinetic model shows that, the rate limiting step is chemisorption [16]. According to this model, the interactions can be said to be chemical in nature; this same tendency was reported by Nanganoa et al. 2014 [6] and Guerrero-Coronilla et al. 2014 [7], which also worked on the adsorption of amaranth red by smectite clay and four biosorbents of aquatic origin respectively. However, the time of half-reaction and initial speed show that the kinetic of accumulation of the pollutant is faster on the surface of materials treated than on the surface of materials untreated. The fact that linear plots for intraparticle diffusion model (Q t versus t1/2)for each sample did not pass through the origin is indicative that the intraparticle diffusion doesn’t controlled biosorption process. Ndifor-Angwafor et al., J. Mater. Environ. Sci., 2017, 8 (12), pp. 4199-4212
4207
Table 2: Kinetic parameters of adsorption of amaranth red onto pineapple peelings and coconut shells treated and untreated Biosorbents PAB PAH BCB BCH C0 (mg/L) 50 Qe (mg/g) 4.836 3.473 4.545 3.114 R2 0.825 0.636 0.606 0.627 1/2 Pseudo-first order t (min) 28.875 15.065 23.897 20.382 K1 (1/min) 0.024 0.046 0.029 0.034 Qe (mg/g) 29.412 26.316 17.241 15.385 R2 0.998 0.999 0.997 0.997 1/2 t (min) 41.523 18.868 40 25 Pseudo-second order h (mg/g.min) 20.762 36.704 7.432 9.468 K2 (g/min.mg) 0.024 0.053 0.025 0.04 C (mg/g) 24.07 23.61 12.23 11.99 Weber intraparticle R2 0.710 0.477 0.714 0.682 diffusion model Kintd (mg/g.min) 0.547 0.283 0.540 0.372 β (g/mg) 0.658 1.261 0.645 0.935 2 R 0.772 0.531 0.837 0.800 Elovich model α (mg/g.min) 3.33x10⁶ 1.94x10¹² 1123.22 21551.67 3.4. Adsorption isotherm studies Equilibrium adsorption isotherm is one of the most important data used in understanding the mechanism of adsorption systems. To determine the capacity of adsorption of the compounds on various biosorbents, the experimental data was verified using the Langmuir, Freundlich, Temkin and Dubinin-Radushkevich (D-R) isotherms. The parameters for these adsorption models were calculated using the linear form of the isotherms equations. Langmuir Isotherm The Langmuir adsorption isotherm is often used for the equilibrium of the adsorption of solutes from solutions. It is expressed as [21]: 𝑄 𝐾 𝐶 𝑄𝑒 = 𝑚 𝐿 𝑒 (12) 1+𝐾𝐿 𝐶𝑒
where, Qe is the adsorption capacity at equilibrium (in mg of adsorbate per g of adsorbent); Ce is the equilibrium concentration of adsorbate (mg/L), while Qm is the maximum adsorption capacity corresponding to complete monolayer coverage expressed in mg of solute adsorbed per g of adsorbent, 𝐾𝐿 is the Langmuir constant in L of adsorbate per mg of adsorbent, and it is related to the energy of adsorption. Equation (12) can be rearranged in the linear form: 𝐶𝑒 1 𝐶 = 𝐾 𝑄 + 𝑄𝑒 (13) 𝑄 𝑒
𝐿 𝑚
𝑚
The linear form of Langmuir model is given in figures 12A and 12B respectively The factor of separation of Langmuir, RL, which is an essential factor characteristic of this isotherm is calculated by using the relation of Hall et al [22] shown in equation 14: 1 𝑅𝐿 = 1+𝐾𝑄 𝐶 (14) 𝑚 0
Where C0 is the higher initial concentration of paracetamol, while KL and Qm are the Langmuir constant and the maximum adsorption capacity respectively. The parameters indicate the shape of the isotherm as follows: RL values indicate the type of isotherm. To be irreversible, RL = 1; to be favorable 0 < RL< 1; to be linear RL = 1; while to be unfavorable, RL> 1. Freundlich Isotherm The Freundlich isotherm is based on adsorption on a heterogeneous surface, as expressed by Freundlich and show in equations 15 and 16 [23]: 1/𝑛 𝑄𝑒 = 𝐹𝐶𝑒 (15) Ndifor-Angwafor et al., J. Mater. Environ. Sci., 2017, 8 (12), pp. 4199-4212
4208
where 𝐹 and 𝑛 are empirical constants. By taking logarithms on both sides, the equation gives the more convenient linear form. 1 𝑙𝑛𝑄𝑒 = 𝑙𝑛𝐾𝑓 + 𝑛 𝑙𝑛𝐶𝑒 (16) The 1/𝑛 values indicate the type of isotherm as follows: irreversible 1/𝑛 = 0; favorable 0 1. 0.6
1.6
Ce/Qe(g/L)
Ce/Q (g/L)
B
1.4
A
0.5 0.4
PA B PA H
0.3 0.2
1.2 1 0.8 BC B BC H
0.6 0.4
0.1
0.2
0
0 0
5
10
15
0
20
10
20
30
40
Ce (mg/L)
Ce (mg/L)
Figure 12: Linear plot of Langmuir isotherm models of pineapple peelings (A) and coconut shells (B) The linear form of the Freundlich model is given in figures 13A and 13B respectively 3.2
3.6 3.4
A
B
3
3.2 2.8
2.8
ln Qe
ln Qe
3 PA B PA H
2.6
BC B
2.4
2.4
BC H
2.2
2.2
2.6
2 -4
-2
0
ln Ce
2
4
2 -1
0
1
2
ln Ce
3
4
Figure 13: Linear plot of Freundlich isotherm models of pineapple peelings (A) and coconut shells (B). Dubinin-Radushkevich (D-R) Isotherm Langmuir and Freundlich isotherms are insufficient to explain the physical and chemical characteristics of adsorption. The Dubinin-Radushkevich isotherm is commonly used to describe the sorption isotherms of single solute systems. The Dubinin-Radushkevich isotherm, apart from being an analogue of the Langmuir isotherm, is more general than Langmuir isotherm because it does not apply to the homogeneous surfaces or surfaces of constant adsorption potential. The Dubinin-Radushkevich isotherm as expressed by Benhammou et al. [24] is show in equation 17. 1 𝐶𝑒 −2𝐸𝑎2
(𝑅𝑇𝑙𝑛 1+
𝑄𝑒 = 𝑄𝑚 𝑒𝑥𝑝[
)2
](17)
where, 𝐸𝑎 is the main energy of adsorption and gives information about the physical and chemical features of adsorption. The linear form of the Dubinin-Radushkevich isotherm equation is: 𝑙𝑛𝑄𝑒 = 𝑙𝑛𝑄𝑚 − 𝐾′𝜀 2 (18) 1 where, 𝜀 = 𝑅𝑇𝑙𝑛 1 + 𝐶 is the Polanyi potential. 𝑒
Ndifor-Angwafor et al., J. Mater. Environ. Sci., 2017, 8 (12), pp. 4199-4212
4209
3.6 3.4 3.2 3 2.8 2.6 2.4 2.2 2
3.2
PA B PA H
BC B BC H
3 2.8
A
ln Qe
ln Qe
The linear form of the Dubinin-Radushkevich (D-R) model is given in figures 14A and 14B respectively
2.6 2.4
B
2.2 2 0
200
400
ε²
0
600
100
ε²
200
300
400
Figure 14: Linear plot of Dubinin-Radushkevich isotherm models of pineapple peelings (A) and coconut shells (B) Temkin Isotherm The Temkin isotherm developed by Temkin in 1941 [25] for an adsorption in gas phase was transposed to the liquid phase by Zarrouki in 1990 [26]. The Temkin isotherm is generally given as shown in equation 19. 𝑄𝑒 𝑅𝑇 = ∆𝑄 ln 𝐴𝐶𝑒 (19) 𝑄 𝑚
where
𝑄𝑒 𝑄𝑚
is the rate of covering the surface of the adsorbent, A is the equilibrium constant and ∆𝑄 is the
variation of the energy of adsorption. The linear form of equation (19) is: 𝑅𝑇 𝑅𝑇 𝑄𝑒 = 𝑄𝑚 ∆𝑄 𝑙𝑛𝐴 + 𝑄𝑚 ∆𝑄 𝑙𝑛(𝐶𝑒 )(20)
The value of 𝑄𝑚 is obtained from the Langmuir equation. The linear form of Temkin model is given in figures 15A and 15B respectively 35 30
A
Qe (mg/g)
20 15 10 5
-4
-2
BC B BC H
B
20
25
Qe (mg/g)
25
PA B PA H
15 10 5
0
ln Ce
2
4
-1
0
1
ln Ce
2
3
4
Figure 15: Linear plot of Temkin isotherm models of pineapple peelings (A) and coconut shells (B). In the following table, Langmuir model has a high correlation coefficient (above 0.980) than other models. We can say that the Langmuir model better describes the phenomenon of adsorption on the surface of these four materials. This is in agreement with the results of Al-Aoh et al.2013 [4]. This indicates monolayer biosorption [8]. The values of 1/n of the Freundlich model for the four materials are lower than 1. This indicates high affinity between biosorbent and pollutant. The results of Temkin model shows that the heat of adsorption is higher than zero, increases with the maximum adsorption capacity and shows that the process of adsorption is exothermic. These observations show that, the process of fixation of amaranth red on the biosorbent is chemisorption. The different values of RL (8.06 x10⁻³ for PAB; 0.010 for PAH; 0.047 for BCB and 0.056 for BCH) ranging between zero and one, indicates a favorable adsorption. The maximum adsorption capacities calculated from the Langmuir isotherm show that untreated materials adsorb more than the treated materials. These maximum adsorption capacities of the amaranth red by PAB, PAH, BCB and BCH were compared with those obtained by other adsorbents reported in the literature. Ndifor-Angwafor et al., J. Mater. Environ. Sci., 2017, 8 (12), pp. 4199-4212
4210
Table 3: Equilibrium parameters of adsorption of amaranth red onto pineapple peelings and coconut shells treated and untreated Model Langmuir
Freundlich
Dubinin-Radushkevich
Temkin
Parameters Qmax (mg/g) R2 KL (L/mg) KF (L/g) R2 1/n Qmax (mg/g) R2 E (kJ/mol) A (L/mg) R2 Q (J/mol)
PAB 31.250 0.994 2.461 19.668 0.946 0.200 41.595 0.961 22.361 197.225 0.977 3.974
PAH 28.571 0.994 1.944 17.514 0.917 0.183 36.342 0.938 22.361 211.637 0.959 3.466
BCB 23.809 0.987 0.404 11.012 0.978 0.205 27.004 0.949 18.257 27.687 0.943 3.231
BCH 22.727 0.981 0.336 10.697 0.922 0.183 23.926 0.876 22.361 43.101 0.881 2.766
Table 4:Comparison of adsorption capacity of amaranth red with other adsorbents Biosorbents Smectite Clay Pomegranate peel Bottom-ash Tamirad pod shells Alumina reinforced polystyrène Peanut hull BCH BCB PAH PAB
Quantity adsorbed (mg/g) 1.845 3.448 7.000 65.04 8.281 14.900 22.727 23.809 28.571 31.250
Reference [6] [10] [27] [28] [29] [30] Present Study Present Study Present Study Present Study
Conclusion The study of the biosorption of amaranth red on two lignocellulosic materials, pineapple peelings and coconut shells, untreated and treated with phosphoric acid was carried out in batch mode in order to understand the mechanism of adsorption of these compounds in aqueous solution. The effect of various parameters such as pH, contact time, amount of biosorbent, initial dye concentration was studied. The optimum pH for the dye removal is 2. Maximum biosorption was obtained within the first 60 min. The percentage eliminations is 99.42 for PAB; 97.10 for PAH; 89.32 for BCB and 88.06 for BCH corresponding to a maximum mass of 80 mg for all four materials. The present investigation revealed that the quantities of amaranth red adsorbed increases with increased in the initial concentration. The kinetic model study also showed that the biosorption follows the pseudo-second order equation. The Langmuir isotherm describes biosorption phenomenon with maximum adsorption capacities are 31.250 mg/g for PAB; 28.571 mg/g for PAH; 23.809 mg/g for BCB and 22.727 mg/g for BCH. They both show that the mechanism is chemisorption. The efficacy of untreated pineapple peelings and coconut shells is not dependenton chemical treatment.
Acknowledgements The authors are grateful for technical assistance rendered by Dr TCHIENO M. Francis Merlin of the Department of Chemistry, Faculty of Science of the University of Dschang, Dschang, Cameroon and The World Academy of Sciences (TWAS).
Ndifor-Angwafor et al., J. Mater. Environ. Sci., 2017, 8 (12), pp. 4199-4212
4211
References 1. Zaviska F.; Patrick D. ; Guy M. & Jean-François B., J. Water Sci., 22 (2009) 535.. 2. Barka N.; Qourzal S.; Assabbane, A. ; Nounah, A. ; Aît-Ichou, Y., J. Env. Sc., 20 (2008) 1268. 3. Said A. A.; Arefaly A. M. ; Mohamed M. ; Abdel-Wahab ; Soliman A. S. ; Aly A. A.; Helmey V. & Mohamed N. G., J. Water Res. Prot., 5 (2013) 10. 4. Al-Aoh, A. H.; Maah, M. J.; Yahya, R. & Bin Abas, M. R., Asian J. Chem., 25(2013) 9582. 5. European Food Safety Authority: EFSA.. EFSA Journal, 11 (2013) 1. 6. Nanganoa L.T.; Ketcha J.M., Ndi, J.N., Res. J. Chem. Sc., 4 (2014) 7. 7. Guerrero-Coronilla I. ; Morales-Barrera L.; Villegas-Garrido T. L., Cristiani-Urbina E., Env. Eng. Manag. J. 13 (2014) 1917. 8. Al-Sultani K. F. & Al-Seroury F. A. Res. J. Recent Sc. 1 (2012), 145. 9. Schiewer S. & Volesky, B. Env. Micr. – Metal Interactions. Washington, ASM Press. (2000) 329. 10. Adii A. H.; Kadhem E. H.; Mustafa K. N.; Abdulsaheb N. & Saleh M. M. Int. J. B. Appl. Sci. 13 (2013) 57. 11. Avom J. ; Ketcha, M. ; Matip M. R. L. & Germain P.. Afr. J. Sci. Tech. 2 (2001) 1. 12. Hameed B. H. ; Krishni, R. R. & Sata, S. A.. J. Hazard. Mat., 158 (2009) 65. 13. Tchuifon T. D. R.; Anagho S. G. ; Nche G. N. & Ketcha, J. M.. Int. J. Cur. Eng. Tech., 5 (2015) 1641. 14. Tchuifon T.D.R., Anagho S.G., Njanja E., Ghogomu J.N., Ndifor-Angwafor N.G., Kamgaing T. Int. J. Chem. Sci., 12 (2014) 741. 15. Lagergren S. Handlingar Band., 24 (1898) 1. 16. Ho Y.S. Scientometrics, 59 (2004) 171. 17. Ho Y. S. & McKay, G. Process Biochemistry, 34 (1999) 451. 18. Ho Y.S. J. Hazard. Mat., B136 (2006) 68. 19. Weber Jr.W.J., Morris J.C. J. San. Eng. Div. Am. Soc. 89 (1963) 31. 20. Kifuani K. M.; Noki P. V.; Ndelo J.D.; Mukana W. M. ; Ekoko B. I. L. & Mukinayi M.. Int. J. Biol. Chem. Sci., 6 (2012) 1337. 21. Langmuir I., J. Am. Chem. Soc., 38 (1916) 222. 22. Hall K.R., Eagleton L.C. Acrivos A. & Vermeulen T., Ind. Eng. Chem. Fund., 5 (1966), 212. 23. Freundlich H., Z. Phys. Chem., 57 (1906) 385. 24. Benhammou A., Yaacoubi A., Tanouti B., J. Hazard. Mat., 117 (2005) 243. 25. Temkin M. I., J. Phy. Chem., 15 (1941) 296. 26. Zarrouki M. Thèse de Doctorat de l'Ecole Nationale Supérieure des Mines de St Etienne (France). 1990. 27. Mittal A.; Kurup L. K. & Gupta, V. K., J. Hazard. Mat., B117 (2005) 171. 28. Ahalya N, Chandraprabha MN, Kanamadi RD, Ramachandra TV., J. Biochem Tech., 3 (2012),189 29. Ahmad R. & Kumar R., Clean-Soil, Air, Water, 39 (2011) 74. 30. Gong R.; Ding Y.; Li M.; Yang C.; Liu H. & Sun Y., Dyes and Pigments, 64 (2005) 187.
(2017) ; http://www.jmaterenvironsci.com
Ndifor-Angwafor et al., J. Mater. Environ. Sci., 2017, 8 (12), pp. 4199-4212
4212