Fabre et al., J Biotechnol Biomaterial 2011, 1:7 http://dx.doi.org/10.4172/2155-952X.1000119
Biotechnology & Biomaterials Research Article
Open Access
Is Saliva a Good Alternative to Blood for High Density Genotyping Studies: SNP and CNV Comparisons? Alban Fabre1,2, Emilie Thomas3, Sylvain Baulande4, Emilie Sohier6, Lyan Hoang1,2, Pascal Soularue4, Stéphane Ragusa5, Françoise Clavel-Chapelon1,2* and David G. Cox6
INSERM, Centre for Research in Epidemiology and Population Health, Gustave-Roussy Institute Villejuif, France Paris South University, UMRS 1018, France 3 Fondation Synergie-Lyon Cancer, Lyon, France 4 PartnerChip, Evry, France 5 Statlife, Institut Gustave Roussy, Villejuif, France 6 INSERM U1052, Lyon, France 1 2
Abstract Modern molecular genetic epidemiology is scaled towards large-scale analyses, including genome wide association studies (GWAS) containing hundreds of thousands to millions of single nucleotide polymorphisms. In addition to generating information on alleles at each SNP, GWAS can also be used to evaluate copy number variation (CNVs) across the genome. Traditionally, these studies have been carried out using DNA extracted from lymphocytes in blood samples. More recently, the use of DNA extracted from less invasive methods has become attractive in epidemiological studies. Here, we examine the feasibility of using DNA from saliva to assess CNVs in a pangenome study. We have compared SNP and CNV genotypes among 30 individuals genotyped with the Affymetrix GeneChip NspI genotyping array using DNA from blood and saliva samples of the same individual. In general, while we find that the DNA extracted from these cells is of sufficient quantity and quality to genotype SNPs in a GWAS setting, the results of CNV analyses differed between blood and saliva samples from the same individual, particularly for shorter CNV regions.
Keywords: ATP; Portable; Bioluminescence sensor system; Trichloroacetic acid; Luminescence intensity
Introduction The current trend of genomic methods used in molecular genetic epidemiology studies is towards hypothesis-free tests, such as genome wide association studies (GWAS) and exome or even whole genome sequencing. Consequently, very large data sets are required to counter the loss of statistical power due to the potentially millions of statistical tests that may be carried out in any given study. Obtaining biological samples suitable for DNA extraction from sufficiently large populations is challenging. This is particularly true in geographically dispersed prospective cohorts, where biological samples not only need to be collected, but stored for long periods of time while phenotypes are developed in the population.
this question in canines [4]. CNVs occur throughout the genome, and may influence gene expression and therefore disease risk. Genotyping CNVs has shown to be relatively robust both with respect to analyzing the same DNA sample multiple times on one platform as well as across platforms [5,6]. The majority of association studies using CNV data have mainly been carried out using blood, tumor, or cell line DNA. The suitability of DNA obtained from saliva for CNV analysis is relevant as the DNA is often of lower molecular weight and fragmented. This is mainly attributed to the fact that cells present in saliva are generally dead, often through apoptosis, and may even have severely damaged or altered genomes. While these alterations have little to no effect on SNP genotypes, they may have measurable effects on CNVs. In this study, we have compared both SNP and CNV genotyping in DNA extracted from blood and saliva from the same subject among 30 participants of the E3N cohort.
For decades, blood collection has been carried out in many studies. However, the logistics of collecting blood samples can prove daunting. In studies not based in medical settings, access to phlebotomists and transporting blood samples may be difficult and/or expensive. In addition, while drawing blood is minimally invasive, study participants may still not be willing to provide a sample due to the inconvenience and possible adverse effects (pain, bruising, etc.) Recently, the collection of buccal samples has provided the possibility to obtain cells suitable for DNA extraction, and methods of both saliva collection and DNA extraction have improved to the point where saliva is now used regularly in molecular genetic epidemiology studies [1-3].
Materials and Methods
It is generally accepted that DNA obtained from saliva, while generally of slightly lower quality than that obtained from blood samples, is suitable for use in high throughput genotyping assays, including GWAS platforms for SNP genotyping [3]. This is likely due to the qualitative nature of SNP genotyping (presence or absence of one allele or the other) as opposed to the quantitative nature of CNV calling. However, to our knowledge no studies of the suitability of saliva DNA for use in copy number variation (CNV) genotyping from GWAS platforms have been carried out in humans, and one recent study has examined
Received August 11, 2011; Accepted December 14, 2011; Published December 16, 2011
J Biotechnol Biomaterial ISSN:2155-952X JBTBM an open access journal
Participants and sample collection The E3N is a prospective cohort initiated in 1990 that includes 98,995 French women born between 1925 and 1950, who subscribe to a health insurance plan mainly covering teachers. Blood samples
*Corresponding author: Françoise Clavel-Chapelon, INSERM E3N/U1018, Institut Gustave, Roussy, 117 rue Edouard Vaillant, 94805 Villejuif Cedex, France, Tel: +33-14211-4148, Fax +33-14211-4000; E-mail:
[email protected]
Citation: Fabre A, Thomas E, Baulande S, Sohier E, Hoang L, et al. (2011) Is Saliva a Good Alternative to Blood for High Density Genotyping Studies: SNP and CNV Comparisons? J Biotechnol Biomaterial 1:119. doi:10.4172/2155952X.1000119 Copyright: © 2011 Fabre A, et al. This is an open-access article distributed under the terms of the Creative Commons Attribution License, which permits unrestricted use, distribution, and reproduction in any medium, provided the original author and source are credited.
Volume 1 • Issue 7 • 1000119
Citation: Fabre A, Thomas E, Baulande S, Sohier E, Hoang L, et al. (2011) Is Saliva a Good Alternative to Blood for High Density Genotyping Studies: SNP and CNV Comparisons? J Biotechnol Biomaterial 1:119. doi:10.4172/2155-952X.1000119
Page 2 of 4 sulting DNA pellet was washed with 70% ethanol, then resuspended in TE buffer.
were collected between 1995 and 1998 from 24,505 E3N participants, and were aliquoted into plasma, serum, buffy coat, and erythrocytes, then stored in liquid nitrogen [7]. Among these, we randomly selected 30 women who were participants, as controls, in an on-going genome wide association study. We first contacted them in 2010 by telephone to request their participation in a pilot test of exfoliated buccal cell collection, and all 30 responded positively. Each participant received a letter with information on the study, and informed consent form, and detailed instructions on how to deliver the saliva sample using the enclosed kit (Oragene, DNA Genotek Inc., Ottawa, Ontario, Canada). Additionally, the subjects were asked not to drink nor eat for 30 minutes prior to collection, and to provide approximately 0.5mL of saliva.
Picogreen dye (Quant-iT Pico Green, Invitrogen) was used in order to quantify double-stranded DNA in order to avoid possible contaminating RNA in samples according to the manufacturer’s protocol. DNA purity was measured using spectroscopy by Nanodrop (ThermoScientific), comparing the ratio of absorbtion between 260 and 280 nm.
Genotyping Sample genotyping was performed on the Affymetrix GeneChip platform using the NspI mapping array, with approximately 260,000 SNPs, according to the manufacturer’s instructions. Briefly, 250 ng of dsDNA was digested with NspI and ligated to adapters using T4 DNA ligase. Samples were then amplified using Titanium taq polymerase (Clonetech) and purified on Nucleofast 96-well plates (Clonetech). 90 µg of PCR products were then subjected to fragmentation with DNase I, and biotin-labeled using terminal deoxynucleotidyl transferase (TdT). Samples were then injected into cartridges, hybridized, washed and stained. Array images were obtained using the GeneChip Scanner 3000 and raw signals wedre deduced and compiled into CEL files. SNP genotypes were called using both the Affymetrix DM algorithm and the BRLMM basecalling algorithm analyzing all CEL files in one batch.
DNA extraction and quantification DNA was extracted from 200 µl lymphocyte samples using MiniExt-Blood-PK kits adapted from the NucleoSpin® 96 Blood Quick Pure Kit (Macherey Nagel) according to the manufacturers instructions, under contract with GenoScreen (Lille, France). Purification of genomic DNA from saliva was performed according to the manufacturer’s instructions. Briefly, 500 µl of saliva in Oragene conservative buffer were heated for 2 hours at 50°C to release DNA and inactivate nucleases. A 1/25th volume of Oragene-DNA Purifier (OG-L2P) was added before incubating the sample on ice for 10 minutes, followed by 5 minutes of centrifugation at 15,000 x g. The supernatant was then carefully transferred into a new microcentrifuge tube and room temperature absolute ethanol was added. After mixing gently, samples were allowed to stand at room temperature for 10 minutes to allow the DNA to fully precipitate. Tubes were then centrifuged for 2 minutes at 15,000 x g. The re-
CNV genotypes were called based on the Copy-number estimation using Robust Multichip Analysis (CRMA) version 1 from the R-package aroma.affymetrix with a corrected Gain and Loss Analysis of DNA (GLAD) model [8]. This model was corrected by subtracting the signal at a given probe from the mean signal of all probes in the same region.
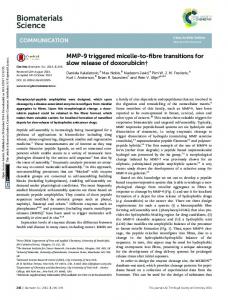
a. Cumulated effective of the number of blood regions according to the length in # of probes
300 200
Number
300 0
0
100
100
200
Number
400
400
500
500
b. Cumulated effective of the number of blood regions according to the length in bases pair
0
20
40
60
80
100
120
0
500000
1000000
1500000
Length
500 Number
200
300
400
500 400 300 0
0
100
100
200
20
40
60
80
100
0
500000
1000000
1500000
Length
Length
e. Cumulated effective of the number of common regions according to the length in # of probes
f. Cumulated effective of the number of common regions according to the length in bases pair
2000000
0
0
100
100
200
200
Number
300
400
400
500
500
0
300
Number
2500000
d. Cumulated effective of the number of saliva regions according to the length in bases pair
c. Cumulated effective of the number of saliva regions according to the length in # of probes
Number
2000000
Length
0
20
40
60
80 Length
100
120
140
0e+00
1e+06
2e+06
3e+06
4e+06
5e+06
Length
Figure 1:
J Biotechnol Biomaterial ISSN:2155-952X JBTBM an open access journal
Volume 1 • Issue 7 • 1000119
Citation: Fabre A, Thomas E, Baulande S, Sohier E, Hoang L, et al. (2011) Is Saliva a Good Alternative to Blood for High Density Genotyping Studies: SNP and CNV Comparisons? J Biotechnol Biomaterial 1:119. doi:10.4172/2155-952X.1000119
Page 3 of 4
0.8
a. SE proportion according to the regions length (Reference = Blood) o
a.
o o o
0.4
SE proportion
0.6
o
0.2
o
o
1
o
5
10
15
20
25
45
65
140
Length (# of probes)
b. SE proportion according to the regions length (Reference = Saliva) 0.8
o o
0.6
o
o
o
0.4
SE proportion
o
0.2
o
o
1
5
10
15
20
25
45
65
140
Length (# of probes)
Figure 2:
Signals within one standard deviation (SD) of the median value for a region were considered neutral, while those greater or less than one SD away from the medial were considered as gains or losses, respectively. The GLAD model was fit independently for each subject and each DNA type (blood or saliva). Regions were variation occurred (either a gain or loss in either DNA sample) were included in analyses. Events were considered equivalent in blood and saliva if a gain or loss was present in a given region (defined by > 80% overlap measured in base pairs or with n common probes in a region of no less than n + 2 overlapping probes) in both DNA samples. The distribution of the lengths of each region is shown in Figure 1.
comparisons of blood and saliva samples using the Wilcoxon signedrank test (Table 1).
Statistical analyses
Figure 2 shows that the larger a region of overlapping events between blood and saliva, the greater the proportion of same events is. Table 3 shows the concordance statistics between blood and saliva CNV calling. Concordance as measured by chi-squared testing was greatest when regions overlapping at 65 or greater probes were used (N regions total). Kappa and ROC analyses show that regions overlapping at 25 or more probes were most similar between blood and saliva. The kappa statistic in this instance was 0.67, and 87% of the regions evaluated were concordant. While concordance increased to 97% with larger overlapping regions, kappa declined to 0.59. Similarly, ROC testing showed that this analysis had 75% sensitivity and 97% specificity. While specificity increased to > 99% with larger overlapping regions, sensitivity declined to 50%. These observations are likely due to the lower number of regions in these analyses (see Table 3).
Wilcoxon signed-rank tests were used to evaluate differences of amount and purity between the two methods of collection. We compared reproducibility of SNP results using a Kappa score. Area under the Receiver Operating Characteristic curve, assuming the blood value was true in order to estimate true positives (same event in blood and saliva), false positives (event only in saliva), false negatives (events only in blood), and true negatives (neutral events in both saliva and blood), as well as chi-squared and Kappa statistics were used to evaluate the differences between CNV genotyping in blood and saliva samples.
Results Blood samples yielded a median concentration of 114.3 ng/µl of DNA, with a median 260/280 ratio of 1.85. Saliva samples were similar, with a median concentration of 133.6 ng/µL and median 260/280 ratio of 1.90. No difference between concentration or purity was observed in J Biotechnol Biomaterial ISSN:2155-952X JBTBM an open access journal
The median genotyping call rates between blood and saliva were also similar. On average, 97.8% of the SNPs were called across the blood samples, and 96.8% in the buccal samples. However, four samples from saliva failed to genotype for > 93% of the SNPs. Concordance between blood and saliva samples for SNP genotyping (AA, AB, and BB genotypes) was 98.1%, with a Kappa statistic of 0.98. Upon excluding the poorly performing saliva samples (with call rates < 93%), the concordance between blood and saliva was 98.5%, with a Kappa of 0.99 (Table 2).
Discussion In these analyses, we confirm prior evidence that using DNA ex-
Volume 1 • Issue 7 • 1000119
Citation: Fabre A, Thomas E, Baulande S, Sohier E, Hoang L, et al. (2011) Is Saliva a Good Alternative to Blood for High Density Genotyping Studies: SNP and CNV Comparisons? J Biotechnol Biomaterial 1:119. doi:10.4172/2155-952X.1000119
Page 4 of 4 Collection
Blood
DNA concentration (median ng/µL; range)
Saliva
p-value
114.3 (17.7 - 478.2) 133.6 (24.5 - 475.7) 0.15
260/280 ratio (median; range) 1.85 (1.42 - 2.15)
1.90 (1.71 - 2.04)
0.18
Table 1: DNA quantity and quality in bood and saliva samples. DM
BRLMM Concordance
Call Rate (%)
Call Rate (%)
AA (%)
AB (%)
BB (%) Percent Kappa
Median Blood 95.0 ± 1.3 97.8 ± 0.9
36.03 27.23
34.63
Saliva 93.1 ± 4.8 96.8 ± 2.9
36.14 26.48
34.72
98.10 ±1.91
0.98 ± 0.02
Table 2: SNP genotyping comparisons between blood and saliva DNA samples. ROC Chip Pairs
Sensitivity
Specificity
Chi-Squared P-value
Kappa K
% concordance
Global
0.15
0.43
1.59 x 10-54
-0.43
50.9
Global SE25
0.75
0.97
4.76 x 10⁻¹⁶
0.67
87.1
Global SE45
0.72
0.97
5.05 x 10⁻¹⁴
0.64
88.2
Global SE65
0.50
0.99
1.95 x 10⁻⁵
0.59
96.6
Table 3: CNV genotyping statistics between pairs of blood and saliva samples.
tracted from buccal cells is sufficient and satisfactory for use in large scale SNP analyses. This further reinforces the interest of collecting saliva samples from participants in large prospective studies in order to reduce costs and potentially increase participation. Indeed, within our cohort population, almost 70% of the participents accepted to give the saliva sample. Investigators need to be aware, however, how the choice to collect saliva samples may influence the types of studies that can be carried out. As with almost all biological samples, saliva and blood samples are not optimal for all types of studies. One advantage of using blood samples is the ability to examine biomarkers present in other fractions of the blood sample, such as erythrocytes, serum, or plasma. If properly preserved, handled and stored, blood samples can also be used to establish lymphoblastoid cell lines, which can be invaluable but costly in many study settings. Saliva sample collection, while potentially less flexible in the spectrum of potential biomarkers, has the advantage of being less expensive and less invasive than blood collection which can possibly lead to increased participation of volunteers. While we show that this tradeoff may be less influential on the ability to test hypotheses strictly related to germline genetic variation, more complex studies of biomarkers and the exposures that they represent may still require other biospecimens, including blood samples. This is the first study, to our knowledge, to examine the reproducibility of CNV genotyping between blood and saliva samples in humans in the context of a prospective cohort study. It is important to note that in the work of Rincon et al. [4] using canine DNA, comparisons between blood and buccal cell CNVs were carried out using all the loci available, regardless of whether any variation was observed at those loci. As the vast majority of the loci would not show any variation within the population studied, potentially inflated concordance rates may be observed. This is the reason we have chosen to attempt to restrict our comparisons to those loci where variation occurs in our population. While encouraging, our results show the need for caution when considering sources of DNA for large scale prospective genetic epidemiology studies. In particular, our blood samples were collected 12 to 15 years prior to the saliva samples. Therefore, it is possible that even greater differences may be observed with increased storage time due to further degradation of DNA present in the sample. J Biotechnol Biomaterial ISSN:2155-952X JBTBM an open access journal
As we move into the post-GWAS era, projects combining not only high throughput genotyping as described here, but also high-throughput sequencing will be the state of the art. While we have shown that in some situations DNA extracted from buccal cells in saliva samples is of sufficient quantity and quality to carry out large scale SNP genotyping and CNV analyses, further work needs to be carried out to evaluate the suitability of such samples for next generation sequencing. Acknowledgements The authors are indebted to all participants for providing data and to practitioners for providing pathology reports. The authors are grateful to R. Chaït, M. Fangon, M. Niravong, Gwenaëlle Guillas, Lyan Hoang and C. Kernaleguen for managing the data. The E3N study is being carried out with financial support from the French League Against Cancer, the Mutuelle Générale de l’Education Nationale, the Institut Gustave Roussy and the Institut National de la Santé et de la Recherche Médicale. The present study was financially supported by INCa-Lilly and the Agence Nationale de la Recherche. Financial support for the collection of saliva samples was given by the French League Against Cancer and the French Public Health Research Institute (through the Large Research Infrastructure Action Plan). Alban Fabre was supported by the Cancéropôle Région Ile de France. The authors are grateful to DNA Genotek for providing the saliva kits and 250K Affymetrix chips.
References 1. Paynter RA, Skibola DR, Skibola CF, Buffler PA, WiemelsJL, et al. (2006) Accuracy of multiplexed Illumina platform-based single-nucleotide polymorphism genotyping compared between genomic and whole genome amplified DNA collected from multiple sources. Cancer Epidemiol Biomarkers Prev 15: 25332536. 2. Feigelson HS, Rodriguez C, Welch R, Hutchinson A, Shao W, et al. (2007) Successful genome-wide scan in paired blood and buccal samples. Cancer Epidemiol Biomarkers Prev 16: 1023-1025. 3. Feigelson HS, Rodriguez C, Robertson AS, Jacobs EJ, Calle EE, et al. (2001) Determinants of DNA yield and quality from buccal cell samples collected with mouthwash. Cancer Epidemiol Biomarkers Prev 10: 1005-1008. 4. Rincon G, Tengvall K, Belanger JM, Medrano JF, Andre C, et al. (2011) Comparison of buccal and blood-derived canine DNA, either native or whole genome amplified, for array-based genome-wide association studies. BMC Res Notes 4:226. 5. Hong H, Shi L, Su Z, Ge W, Jones WD, et al. (2010) Assessing sources of inconsistencies in genotypes and their effects on genome-wide association studies with HapMap samples. Pharmacogenomics J 10: 364-374. 6. Bengtsson H, Ray A, Spellman P, Speed TP (2009) A single-sample method for normalizing and combining full-resolution copy numbers from multiple platforms, labs, and analysis methods. Bioinformatics 25: 861-867. 7. Engel P, Fagherazzi G, Boutten A, Dupré T, Mesrine S, et al. (2010) Serum 25(OH) vitamin D and risk of breast cancer: a nested case – control study from the French E3N cohort. Cancer Epidemiol BiomarKers Prev 19: 2341-2350. 8. Bengtsson H, Irizarry R, Carvalho B, Speed TP (2008) Estimation and assessment of raw copy numbers at the single locus level. Bioinformatics 24: 759-767.
Submit your next manuscript and get advantages of OMICS Group submissions Unique features: • • •
User friendly/feasible website-translation of your paper to 50 world’s leading languages Audio Version of published paper Digital articles to share and explore
Special features: • • • • • • • •
200 Open Access Journals 15,000 editorial team 21 days rapid review process Quality and quick editorial, review and publication processing Indexing at PubMed (partial), Scopus, DOAJ, EBSCO, Index Copernicus and Google Scholar etc Sharing Option: Social Networking Enabled Authors, Reviewers and Editors rewarded with online Scientific Credits Better discount for your subsequent articles
Submit your manuscript at: http://www.omicsonline.org/submission
Volume 1 • Issue 7 • 1000119