APPLIED PHYSICS LETTERS
VOLUME 81, NUMBER 20
11 NOVEMBER 2002
Bonding and mechanical properties of ultrathin diamond-like carbon films M. G. Beghi INFM and Nuclear Engineering Department, Politecnico di Milano, I-20133 Milan, Italy
A. C. Ferrari,a) K. B. K. Teo, and J. Robertson Engineering Department, Cambridge University, Cambridge, CB2 1PZ United Kingdom
C. E. Bottani and A. Libassi INFM and Nuclear Engineering Department, Politecnico di Milano, I-20133 Milan, Italy
B. K. Tanner Department of Physics, University of Durham, Durham, DH1 3LE United Kingdom
共Received 22 March 2002; accepted for publication 5 August 2002兲 Ultrathin 2-nm-thick carbon coatings are needed to increase the storage density in magnetic hard disks. We show how x-ray reflectivity, surface Brillouin scattering, resonant Raman scattering, and electron energy loss spectroscopy can measure consistently the structural and mechanical properties of these thin films. 2 nm films retain a Young’s modulus of 100 GPa. © 2002 American Institute of Physics. 关DOI: 10.1063/1.1510179兴 Diamond-like carbon 共DLC兲 films form a critical protective layer on magnetic hard disks, sliders, and their reading heads. Storage densities are presently doubling every year. This requires the read head to approach the magnetic layer, and ever thinner carbon layers. Film thicknesses ⭐ 2 nm are needed for storage densities ⭓ 100 Gbit/in2 . 1 To be protective, the films must be continuous and pin-hole free. This correlates to smoothness, atomic density, and s p 3 content. As film thickness reaches the nm range, it is unclear if carbon retains the bulk properties, and it is critical to have accurate methods of characterization.2 The s p 3 bonding is metastable and may not be stable at the surface. The integrity may be lost as the thickness approaches the roughness value. Electron energy loss spectroscopy 共EELS兲 on cross-sectional samples showed that the outer ⬃1 nm layer is less sp 3 bonded than the bulk because of the nature of the deposition mechanism.3,4 The key question for the hard disk industry is if sub-2 nm DLC films are more s p 2 bonded, are they still protective? EELS is a destructive technique. Nondestructive techniques are preferable. This letter shows how Raman, surface Brillouin scattering 共SBS兲, and x-ray reflectivity 共XRR兲 can successfully measure such thin films. In particular, by means of SBS, we can measure the elastic constants of a ⬃2 nm film. No other technique has to date been able to derive elastic constants for such thin films. The DLC films used are hydrogen-free tetrahedral amorphous carbon 共ta-C兲 deposited by filtered cathodic vacuum arc 共FCVA兲 at floating potential with an S-bend filter. Sets of films were grown for different times in the same run on bare Si and on Si covered by evaporated Al. Two bare substrates and four ta-C ultrathin films of different thickness h were analyzed, plus another two thicker films of ⬃15 and ⬃27 nm. SBS requires accurate values of film thickness and density. XRR is the method of choice for this.5–9 Figure 1 shows the reflectivity of bare Si 共covered with some native oxide兲 and two ultrathin films. A typical reflectivity curve consists a兲
Electronic mail:
[email protected]
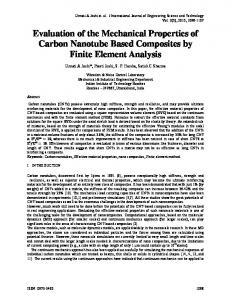
of a critical angle peak, followed by a decay with oscillations due to interference of waves reflected from the surface and the substrate interface. The thickness is derived from the oscillation period with good accuracy even on very thin films. On relatively thick films, the density is derived from the critical angle for external reflection.5–9 On films thinner than 20 nm, the x-ray evanescent wave reaches the substrate. The critical angle is now due to the substrate. The film density must be derived by fitting the whole reflectivity curve.9 In Fig. 1, the reflectivity curve of bare Si differs from the carbon coated Si. Sample C shows a broad fringe. For sample D, the fringe lies at smaller angles, consistent with a thicker film, and a second fringe appears. Thicker ta-C films (h⬎15 nm兲 have a mean density of ⬃3.2 g/cm3 , while the surface and substrate layers have lower densities.3,7–9 We use a three-layer model for the to fit the reflectivity. We find that the surface and interface layers are as in thicker films: 0.5–1.5 nm and 2.0–2.5 g/cm3 density. The central layer is denser, and its thickness increases with total thickness. This gives a mean density of ⬃2.8 g/cm3 for the 2.2 nm film due to these surface and interface layers. For SBS analysis we used the average film properties. SBS measures the elastic moduli. SBS a 514 nm laser in backscattering with a Sandercock interferometer.10–12 The in-
FIG. 1. Specular intensity multiplied by fourth power of the incidence angle, to enhance the visibility of low contrast fringes, for Si substrate 共b兲 and 2.2 nm 共c兲 and 3.5 nm 共d兲 films, see Table I.
0003-6951/2002/81(20)/3804/3/$19.00 3804 © 2002 American Institute of Physics Downloaded 28 Nov 2006 to 129.169.177.37. Redistribution subject to AIP license or copyright, see http://apl.aip.org/apl/copyright.jsp
Beghi et al.
Appl. Phys. Lett., Vol. 81, No. 20, 11 November 2002
3805
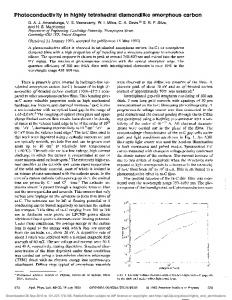
FIG. 2. Measured and computed dispersion relations for substrates covered by native oxide 共a兲 and 共b兲, and ta-C films of increasing thickness (C,D,E,F, see Table I兲. The error bars for sample C are similar to the others and not shown for clarity.
cidence angle determines the acoustic wave vector q 储 10 and the surface acoustic wave 共SAW兲 velocity v (q 储 ) is measured. SBS is time consuming, but probes wavelengths up to 100 times shorter than laser-induced SAW.13 This gives SBS unique potential for ultrathin films. The scattered waves consist of a Rayleigh wave10 modified by the film 关modified Rayleigh wave 共MRW兲兴. Figure 2 shows its velocity as function of q 储 h, where h is the film thickness. For thin films (q 储 h⬍1兲 the MRW lies mostly in the substrate. However, its maximum amplitude is at the surface, and this senses the film’s properties. The MRW is more confined in the film at large q 储 h. Hence, MRW velocity increases with q 储 h for films faster than the substrate, and decreases with q 储 h for slower films. The elastic constants are found by fitting computed velocities to measured ones.11–12 Amorphous films are assumed to be isotropic. Their elastic constants are defined by the Young’s modulus E and shear modulus G. Our analysis assumes that a positive Poisson’s ratio and a bulk modulus less than diamond. Figure 2 shows that SBS can distinguish the ⬃2 nm film from the bare Si. E,G values are given in Table I. The data from the two native oxide films fall on the same line; the MRW velocity decreases with q 储 h, as the oxide is slower than the substrate. The velocity for the 2.2 nm film also decreases, implying a film slower than Si, but stiffer than the oxide. The velocities for 3.5 and 4.5 nm films are increasing functions of q 储 h. The elastic constants of these films are similar, and larger than the 2.2 nm film. Data for the 8 nm film fall on a higher curve, indicating a significantly higher stiffness: the elastic moduli are comparable to thicker ta-C. As both SBS and XRR are pushed to their sensitivity limits, the robustness of the elastic constants was checked. A 5% change in film density or thickness results in overlapping TABLE I. Thickness, h, density, , from XRR. Single layer and three layer fits are tried for samples E and F. Young’s modulus E and shear modulus G are 90% confidence intervals from the SBS fit. Sample C D E E共layered兲 F F共layered兲
h 共nm兲
(g/cm3 )
E 共GPa兲
G 共GPa兲
2.2 3.5 4.5 0.6/3.3/0.6 8 1.5/4.8/1.8
2.8 2.8 2.8 2.1/3.1/2.25 2.8 2.5/3.1/2.3
95⫾30 195⫾30 220⫾40
40⫾20 85⫾30 100⫾30
380⫾40
170⫾45
FIG. 3. 共a兲 Young’s modulus as a function of film thickness. 共b兲 Density as a function of film thickness from XRR or derived from E, via the E-sp 3 and sp 3 -density relations for thick ta-C. 共c兲 sp 3 content as a function of film thickness derived from XRR density, via the density-sp 3 relation, or from E, via the E-sp 3 relation and directly measured by EELS.
confidence regions, with mean values shifted by ⬃5%, but much less than the confidence regions. Thus, our procedure is robust against inaccuracies.12 For very thin films, the results are very sensitive to errors in substrate properties. If we assume Si elastic constants to be ⬃1% lower, this gives 30% higher elastic constants for thinner films. However, we can test our accuracy of the substrate properties as we have measurements on both slow and fast films. The relations in Fig. 2 were fitted by linear or quadratic functions, with the velocity at q 储 h⫽0 as a common fitting parameter for all films. This showed that the elastic constants of the substrate could be overestimated by only a fraction of a percent. Thus the values of Table I are underestimated at most by a few percent. Figure 3共a兲 shows E vs. E ta-C film thickness for the ultrathin films and also for two films of intermediate thickness 共15 and 27 nm produced by single bend FCVA兲10 and data on other thicker ta-C films produced by single and S-bend FCVA from Ref. 11. Data from LISAW measurements on ultrathin films produced by high current arc are also included.13 Note how LISAW data lie above our SBS values for the thinnest films: this reflects the lower film sensitivity of this higher wavelength technique. Figure 3共a兲 shows that films ⭓10 nm behave mechanically like bulk ta-C. Now, in bulk ta-C, the density and E depend solely on sp 3 fraction. For bulk ta-C films, a general E-sp 3 relation and density-sp 3 relation were derived.9,11 Assuming these relations to hold for thin films, working backwards we can derive sp 3 fractions from E 关Fig. 3共c兲兴, and then the densities 关Fig. 3共b兲兴. Figure 3共b兲 also plots the density directly measured by XRR and Fig. 3共c兲 plots the sp 3 fraction derived from the density versus sp 3 relation applied to our XRR density. Figure 3共c兲 also shows the sp 3 content directly measured by cross-sectional EELS. Figure 3 allows some significant conclusions. The den-
Downloaded 28 Nov 2006 to 129.169.177.37. Redistribution subject to AIP license or copyright, see http://apl.aip.org/apl/copyright.jsp
3806
Beghi et al.
Appl. Phys. Lett., Vol. 81, No. 20, 11 November 2002
FIG. 4. Raman spectra at 514 nm 共A兲, 325 nm 共B兲, and 244 nm 共C兲, excitation for sample E 共4.5 nm兲 deposited on Si and Si⫹Al.
sity, s p 3 fraction and E all decrease for films below 8 nm thickness. Moduli measured by LISAW show the same trend.13 However, there are distinct trends. The XRR density of the 2.2 nm film, 2.8 g/cm3 , corresponds to ⬃60% sp 3 content, similar to that from EELS 共⬃45%兲. In contrast, its E would correspond to a much lower density of 1.9 g/cm3 and a s p 3 fraction of ⬃0. This is general. The s p 3 -density correlation of bulk ta-C still holds for ultrathin films. However, the thin films are softer than bulk films 共60–70 nm thick兲 of the same density. This is presumably due to the presence of the surface and interface layers but it could also be due to surface roughness. This is a different effect than the often observed difference of elastic constants in bulk samples and thin films. Raman spectroscopy measures the vibrational modes, and thereby the bonding.14 The Raman spectra in Fig. 4 were taken for 514, 325, and 244 nm excitation on Renishaw spectrometers. An Al layer below the ta-C was deposited to increase the Raman intensity by using the surface enhanced Raman 共SERS兲 concept.15,16 The UV Raman spectra of the thinner films on Si are very noisy, so SERS allows a clear measurement for the same acquisition time. We used low powers to minimize damage. A higher power gives low noise visible Raman spectra on DLC to 1 nm thickness,17 but produces damage in UV Raman. SERS is due to coupling to the surface plasmon field of a rough metal.15,16 The Al film is an assembly of 50–150 nm blob-like and rod-like shapes. The surface plasmon energy of flat or spherical Al surfaces coated by ta-C is 3.8 –5.3 eV. This gives the highest enhancement for 325 nm excitation 共3.8 eV兲, which matches the plasmon energy of an Al sphere coated with ta-C. We use Al instead of Ag as we mainly need to enhance UV Raman spectra. Ag has lower surface plasmon energy so Ag enhances Raman spectra in the visibleinfrared range. Figure 4 shows that simple evaporation of Al on Si allows detection of UV Raman spectra of the same quality as those of thicker films. The Raman spectra of all carbon systems show three features, the G, D, and T peaks. The G and D peaks, around 1560 and 1360 cm⫺1 , respectively, are due to s p 2 sites.14 The G mode is due to bond stretching of s p 2 bonds. The T
peak, around 1060 cm⫺1 , is detected only with UV excitation and is due to C–C sp 3 modes.14 For a given substrate, the G peak frequency at 514 nm excitation decreases from 1565 to 1510 cm⫺1 from bulk to 2.2 nm films. The I(T)/I(G) ratio in UV Raman decreases from 0.5 to 0. These trends are consistent with a lower sp 3 fraction and lower density in ultrathin films. Hence, there is a general consistency between the Raman, XRR, and EELS data. In the 4.5 nm film, the G peak frequency dispersion with excitation energy 共0.21 cm⫺1 /nm) is less than in the 8 nm sample 共0.45 cm⫺1 /nm, the same as bulk films兲.17 The UV Raman spectrum of the 8 nm film approaches that of thicker films and has a significant I(T)/I(G) ratio, consistent with a high sp 3 content 共⬎60%–70%兲 and with the sp 3 fraction derived from the XRR density. However, does SERS provide a representative spectrum? We compared the Raman spectra of a thick ta-C film grown on Al to a thick film on Si. They are similar for both visible and UV excitation, showing that Al does not effect the ta-C properties in this case. However, we could expect some differences for ultrathin films. Comparing spectra of ta-C films of the same thickness on Si or Si⫹Al shows that the latter have a slightly higher I(D)/I(G) ratio 共0.1–0.2兲, lower G peak dispersion 共max. 0.35 cm⫺1 /nm), and a lower I(T)/I(G) ratio 共max. 0.35兲. This is consistent with an enhancement of the interface layer with a lower density and lower sp 3 content. This change could also be due the Al modifying the films. Nevertheless, a comparison of surface enhanced and normal Raman spectra shows that it is possible to probe interface layers, achieving a nanometer vertical resolution. 1
P. R. Goglia, J. Berkowitz, J. Hoehn, A. Xidis, and L. Stover, Diamond Relat. Mater. 10, 271 共2001兲. 2 H. Han, F. Ryan, and M. McClure, Surf. Coat. Technol. 120, 579 共1999兲; J. Windeln, C. Bram, H. L. Eckes, D. Hammel, J. Huth, J. Marien, H. Rohl, C. Schug, M. Whal, and A. Wienss, Appl. Surf. Sci. 179, 167 共2001兲. 3 C. A. Davis, K. M. Knowles, and G. A. J. Amaratunga, Phys. Rev. Lett. 80, 3280 共1998兲. 4 Y. Lifshitz, S. R. Kasi, and J. W. Rabalais, Phys. Rev. Lett. 67, 1290 共1989兲. 5 M. F. Toney and S. Brennan, J. Appl. Phys. 66, 1861 共1989兲. 6 S. Logothetidis and G. Sterioudis, J. Appl. Phys. 71, 2463 共1997兲. 7 M. P. Siegal, D. R. Tallant, L. J. Martinez-Miranda, J. C. Barbour, R. L. Simpson, and D. L. Overmyer, Phys. Rev. B 61, 10451 共2000兲. 8 B. K. Tay, X. Shi, S. P. Lau, Q. Zhang, H. C. Chua, J. R. Shi, E. C. Lim, and H. Y. Lee, Int. J. Mod. Phys. 14, 181 共2000兲. 9 A. C. Ferrari, A. Libassi, B. K. Tanner, V. Stolojan, J. Yuan, L. M. Brown, S. E. Rodil, B. Kleinsorge, and J. Robertson, Phys. Rev. B 61, 11089 共2000兲. 10 F. Nizzoli and J. R. Sandercock, in Dynamical Properties of Solids, edited by G. Horton and A. Maradudin 共North-Holland, Amsterdam, 1990兲, p. 281. 11 A. C. Ferrari, J. Robertson, M. G. Beghi, C. E. Bottani, R. Ferulano, and R. Pastorelli, Appl. Phys. Lett. 75, 1893 共1999兲. 12 R. Pastorelli, S. Tarantola, M. G. Beghi, C. E. Bottani, and A. Saltelli, Surf. Sci. 468, 37 共2000兲. 13 D. Schneider, T. Witke, T. Schwarz, B. Schoneich, and B. Schultrich, Surf. Coat. Technol. 126, 136 共2000兲. 14 A. C. Ferrari and J. Robertson, Phys. Rev. B 61, 14095 共2000兲; 64, 075414 共2001兲. 15 M. Moskovits, Rev. Mod. Phys. 57, 783 共1985兲. 16 F. J. Garcia-Vidal and J. B. Pendry, Phys. Rev. Lett. 77, 1163 共1996兲. 17 S. S. Varanasi, J. L. Lauer, F. E. Talke, G. Wang, and J. H. Judy, J. Tribol. 119, 471 共1997兲.
Downloaded 28 Nov 2006 to 129.169.177.37. Redistribution subject to AIP license or copyright, see http://apl.aip.org/apl/copyright.jsp