May 15, 2018 - vibration of the robot itself with an embedded battery operating a ..... behavior of a gas of randomly distributed particles as shown in S. Fig 6.
SUPPLEMENTARY MATERIAL for “Boundaries Control Collective Dynamics of Inertial Self Propelled Robots” A. Deblais,1 T. Barois,1 T. Guerin,1 P. H. Delville,1 R. Vaudaine,1 J. S. Lintuvuori,1 J. F. Boudet,1 J. C. Baret,2 and H. Kellay1 2
1 Univ. Bordeaux, CNRS, LOMA, UMR 5798, F-33405 Talence, France CNRS, Univ. Bordeaux, CRPP, UPR 8641, 115 Avenue Schweitzer, 33600 Pessac, France (Dated: March 25, 2018)
This section gives additional information to accompany the main text. This document is organized as follows. We first describe in detail how the rods work and how their properties are analysed (A). We then describe our numerical simulations (B) and the definition of the Peclet number used to compare both the numerics and the experiments (C). We then highlight the role of inertia in the system (D) and the coexistence conditions for the cluster and the gas phase (E) and the analysis of the cluster properties (F). We end up with the details of the experiments with biased trajectories (G) and flexible walls (H) and the derivation of the analytical solution for the cluster dynamics (I).
A.
The robots and their tracking:
The rods used are small plastic robots. These robots are commercial systems (see https://www.amazon.de/Mad-Bugs-electronischeMini-Insekten/dp/B004O2A500), purchased from a local toy-store (Spielzeugladen Papajule) located in Goettingen (D), S. Fig. 1. The motility of these plastic robots is induced by the vibration of the robot itself with an embedded battery operating a vibration module working at frequencies f between 150Hz (fresh battery) and 60Hz (after 80min). The plastic robots have asymmetric soft legs which after a few vibration cycles give rise to a directed movement with velocities which depend on the frequency of vibration and can be varied from roughly V = 40 to 20cm/s. The mechanism of propulsion of such robots has been described in [1]. The bottom plate on which the robot vibrates and its defects as well as the dynamics of the asymmetric legs of the robots give rise to noise in this directed movement. The robots generally move along straight or mildly curved lines, collide with boundaries and with each other. The experiments are carried out using a fixed number N of these robots confined in a circular container, fixed to the bottom plate, of radius R = 30cm with 1mm thick metal walls and their dynamics is followed by video imaging for different values of N . The surface of the container walls can be coated with a sheet of 2mm thickness sponge to reduce the collision intensity of the rods with the walls or it can be made deformable by using thinner metal sheets or paper sheets (0.1mm in thickness). This arena can be solidly fixed to its support or left free to move depending on the experiment carried out. These robots have dimensions of 4.3 by 1.5cm (S. Fig 1) and a mass of 7g. The embedded vibration device vibrates at frequencies fixed by the voltage of the battery. This voltage decreases with time of operation making the frequency of vibration and the velocity decrease (roughly 15% for the first 20min and faster afterwards)(S. Fig 1).
Both the driving speed and the frequency change with battery time but the two quantities are correlated. The tracking was carried out over periods of 10min where the variation of frequency and velocity are considered small. On short time scales, the directed motion of the robots has a small but persistent lateral motion at the frequency of vibration but with an amplitude that does not vary in time (S. Fig. 1). This amplitude is larger at the level of the head than for the center of mass. To track these rods, two colored spots are stuck on their backs. Tracking both spots simultaneously and on all visible rods in color video recordings done at different rates (going from 1kHz down to a few frames per second) provides a means to measure both the orientation of the rods and the position of their center of mass as a function of time from which we derive their instantaneous translation velocity. Video recordings over time periods from minutes to over an hour leads to statistically representative velocity distributions and spatial properties such as local densities, spatial configurations of clusters or clustering probabilities An important property of these rods, is their inability to align their orientations upon a collision: the contact time during a collision event is small and the orientation of the two rods is not parallel once the collision has ended (S. Fig. 2). For a single collision the two rods quickly lose their parallel orientation. In the right plot, we show the distribution of travel distances over which the two rods are within a small distance from each other (slightly larger than a rod width as for the calculation of clustering probabilities (see below)) and can therefore be considered to be within a small cluster. Statistically relevant data are obtained from a large number of collisions leading to the distribution of contact times over which the two rods are considered as part of a small cluster. The contact time measured was converted into a distance scale using the velocity of the colliding rods during the collision process. Note that the two rods remain in close proximity, on average, for a distance much smaller than the rod length. It is clear from these statistics that
2
FIG. S 1. Photo of the robot and its dimensions as well as its trajectory measured at a high frame rate of 1000Hz. Time dependence of the robot properties. Translation velocity, frequency of the Lateral oscillation and its amplitude versus battery time.
the rods do not remain aligned for long enough distances. Considering our rods to be 4.3cm long, the statistics show that for distances larger than 2 particle sizes, barely any events are detected. B.
Langevin Dynamics simulations:
The self propelled rods were modeled as rigid spherocylinders of total length l + d and diameter d, built from 6 spherical particles of mass m and a diameter d fused together. The cylinder length to width ratio was fixed l/d = 2. The ratio of total length to width is therefore close to the experimental ratio which is 3. The individual spherical particles interact with each other and with the boundary via a repulsive Weeks-Chandler-Andersen (WCA) potential: "� U (rij ) = 4�
d rij
�12
� −
d rij
�6 # + �,
(1)
for rij ≤ 21/6 d and U (rij ) = 0 for rij > 21/6 d. � fixes the energy scale of the system. Each rod like particle indexed by i obeys a Langevin equation for translation and rotation: d2 r i dri b +η(t) mi 2 = −OUi − γr +F n dt dt
Ii
dθi d2 θi = Ti − γθ +Γ(t) 2 dt dt
Note that in these equations we have kept the inertial terms proportional to the mass mi of the rods and to their moment of inertia Ii . The vectorial noise η and the scalar noise Γ are both of zero mean and delta correlated in time, with amplitudes η0 and Γ0 . Here F n ˆ is the active force giving a constant translation velocity for the b . γr and γθ are the rods in the direction of the long axis n translational and the rotational friction coefficients, Ti is the torque exerted by the other particles and related to the repulsive potential Ui . An additional constant torque T0 can be added to the second equation to simulate the effect of a rotating trajectory. We fixed the mass m = 1, the energy � = 1 and the length d = 1. The simulations were carried using the parameters, unless otherwise specified, mi = 6, γr = 3 , F = 10, γθ = 1.4 and I = 2.8 in reduced√units. The amplitudes of the noise terms are η0 = 2α�γr and √ Γ0 = 2α�γθ where α is a constant. The value of α was varied leading to P´eclet numbers Pe = V d/Ds ∈ [30, 300] where Ds = α�/γr is the translational diffusion constant and V = F/γr is the unperturbed speed of the particles. The equations of motion were solved using a modified version of LAMMPS (Large scale Atomic/Molecular Massive Parallel Simulator) [10], where the active force was included, using a time-step ∆t = 0.001.
C.
P´ eclet number
(2)
(3)
For the purpose of comparison of experiments and simulations, a P´eclet number is defined. The P´eclet number is the ratio of advection to diffusion given by the noise term. In the Langevin equation this ratio is P e = V d/Ds .
3
FIG. S 2. Left: Collision between two rods: orientation angle before and after the collision as well as photos of the colliding rods.The rods do not remain oriented and their velocities do not align following a collision. Right: Histogram of the distance over which two rods, during a collision are considered to be part of the same cluster. Note that the distribution falls off rapidly and for distances larger than the length of the rod, few events are recorded. This histogram was obtained in a fixed circular arena with R = 30cm at a surface fraction of 0.11 (60 rods in the arena and at f = 140Hz).
The diffusion constant is given by the ratio of the energy scale of the imposed noise to the friction coefficient Ds = α�/γr . For the experiments, it is difficult to measure directly the diffusion coefficient for a single particle as its displacement is dominated by ballistic motion. However, an energy scale can be obtained from the observed vibration (measured in section A) as .
Ec = 21 I < θ2 > where I is the moment of inertia of the rod and θ is the angle of the oscillation. The brackets are an average over time and the dot is the temporal derivative. By considering the robots as thin rods of length l, knowing the vibration amplitude a and its 1 frequency f (which are measured), Ec = 12 ma2 (2πf )2 . The friction coefficient γr is then estimated as m/τ using the mass m of the rods and the characteristic time scale for a particle to reach the velocity V from rest. This τ 2 gives an effective diffusion constant Ds ∼ 12 a (2πf )2 . The experimental Peclet number can then be obtained as P e = 12V l/(τ a2 (2πf )2 ). The value of τ was measured experimentally by measuring the temporal variation of the velocity of a rod starting from rest and was found to be around 0.1s. The amplitude of the oscillations was found to be close to 0.3mm (see above). The phase diagram is plotted versus the inverse of P e for both simulations and experiments in Fig. 2.
D.
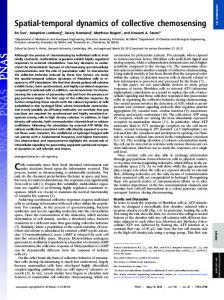
above and for a rod with the wall in S. Fig. 3 below) coupled to large changes in the velocity are a clear sign that inertia is important in the system used here. To show this quantitatively alongside S. Fig. 2, we show the result of a collision with a wall in S. Fig. 3 below using fast video imaging at 1000f ps. Note that the rod bounces off abruptly and its velocity goes from almost 30cm/s to zero at collision before climbing up again to its stationary value near 30cm/s. The velocity component perpendicular to the wall changes rapidly near the collision and ends up changing sign signaling that the rod is moving away from the boundary. Estimates of the deceleration at collision gives at least 10 m/s2 . The rise time from near zero up to the cruise velocity is nearly 0.1s as mentioned above. Using the estimate of the damping term γr V /m, we find roughly 3m/s2 . It is clear that the accelerations at play have to be taken into account. In the same figure, we have also plotted the orientation angle of the rod during the collision where the angle changes from nearly 60◦ with respect to the normal to the wall to nearly -120◦ after the collision before climbing up to an angle of -60◦ . A similar observation can be made from estimates of deceleration upon a collision between two rods. Because collisions are nearly elastic without further alignement, coupled to velocity and orientation change during collision, we conclude that inertial effects must be included in the dynamics.
Importance of inertia E.
In order to reproduce the experimental observations, we have kept the inertial terms in the Langevin equation. The importance of inertia is shown by the fact that collisions between two rods and with the walls of the arena are quasi elastic whereby the rods do not align upon a collision and that the rods may bounce off the wall. The change in orientation (see changes in orientation angle for a collision between two rods in S.Fig.2
Calculation of clustering probabilities and their properties:
This calculation was carried out using home made software whereby the rods are represented by segments along their main axis. From the positions of these segments and for all the rods in the recorded images, we calculate the probability that one rod belongs to a cluster. The relative distances between a chosen segment and all
4
30
22
Y (cm)
18
40
16 14
10
12 12
13
0
14
15
16
17
18
19
20
0
X(cm)
-40
-10
500
-20
V
y
-30
dt (deg/s)
0
-80
-500
-1000
d
[cm/s] y x
V , V
80
collision
20
20
-1500
V
-120
x
-40 0.0
0.2
0.4
-2000 0.0
0.5
1.0
t(s)
0.6
0.8
1.0
1.2
Time [s]
0.0
0.2
0.4
0.6
0.8
1.0
1.2
Time [s]
FIG. S 3. Example of a collision of a rod with a wall. Left: velocity parallel Vy and perpendicular Vx to the wall versus time. Note the large change in velocity and its direction at collision. The inset shows the trajectory of the rod with the wall being in the vertical direction. Right: orientation angle of the rod during the collision. Note again the rapid change upon a collision giving rise (see inset) to large changes in the angular velocity of the rod. Here 0◦ indicates a rod parallel to the wall.
FIG. S 4. Pdfs that a randomly selected rod belongs to a cluster of size n for different surface fractions. The inset shows the values of Nc and γ. The plots to the right show the variation of the residue of the fit (upper) and the weight of the power law contribution (bottom). Note that a fit using the power law and the exponential contributions is better than a simple exponential.
the other segments are calculated and if this distance is smaller than a certain threshold (basically a distance comparable (20% larger) to the rod width) the rods are considered to belong to the same cluster. The statistics are then averaged over all the rods in the container. The obtained histograms are then normalized to obtain probability density functions. As mentioned in the main text, this probability is a monotonic and decreasing function of n, Fig. 1, approximated as P (n) ∼ n−γ exp(−n/Nc ) for low φ,. Here Nc increases with φ and the exponent γ is roughly 1.7 (S. Fig. 4). Note here that the quality of the fit is much better for the functional shape proposed than with a single exponential as shown in the right plots of S. Fig. 4.
Further increase in φ results in a drastic change of P (n) which becomes non monotonic with a smooth decrease for small n along with a marked peak for large clusters. Note here that the exponent observed is larger than in previous realizations on bacteria where γ is near 0.8 but may depend on surface fraction and P´eclet number [2– 4](for the last two references this is for the pdf of cluster sizes which scales as n−γ−1 exp(−n/Nc ) ). Further, the value of this exponent is believed to depend on the exact details of cluster growth and ejection of particles [5]. It is clear that the clusters here being quasi one dimensional as they are near the boundary and growing only at their ends makes any comparison with previously measured exponents delicate.
5
FIG. S 5. Cluster positions in the arena (R = 30cm). Note that most clusters reside near the walls (at position r/R = 1). The black line shows the mean position of a randomly distributed collection of particles in the circular arena. In this scale, the length of a rod is at 0.86 and its width is at 0.95. Most clusters reside at roughly a rod’s length from the wall.
As mentioned in the text, the clusters reside mostly near the boundary. By examining the spatial distribution of clusters in the arena (S. Fig. 5), large clusters seem to assemble near the boundaries only. After the transition (Fig. 1), the rods self assemble at the boundary with a well defined ’hedgehog’ structure. Even before the transition, large transient clusters are confined to a small area near the boundary only (S. Fig. 5). It is thus the boundary which is inducing clustering in these experiments. To test this assertion quantitatively, we count only particles residing at a distance from the wall larger than the rod length. Removing boundary effects affects not only the bimodal distributions above the transition (which becomes monotonic) but it also affects the functional shape of the monotonic distributions. In both cases, P (n) becomes, to a good approximation, exponential (Inset of Fig. 1 and S. Fig 6). Further, the observed increase of Nc with φ in the disordered state is compatible with the behavior of a gas of randomly distributed particles as shown in S. Fig 6. Additional simulations under similar conditions as the experiments further confirm this assertion as in the absence of boundaries (by using periodic boundary conditions) monotonic probability distributions are observed even for the overdamped case (S. Fig 7).
F.
ferent sizes for experiments and simulations. Both show an S like structure. This S like structure favors detachment at the two ends where the orientation deviates from normal to the wall. The rods at the two ends exert a force on each end of the cluster; it is this force which mechanically stabilizes the cluster. This cluster structure does not allow rods to enter the cluster near its central region. Only rods on the boundary can be inserted near the two ends to make the cluster grow. Only the two rods at the two ends are free to detach from the cluster. The rods in the central region are confined and remain in the cluster. The structure for a cluster of identical rods is computed with a mechanical model of self propelled ellipses in 2D. The ellipses are subject to a constant force aligned with their major axis. The mechanical equilibrium is computed in the limit of a flat wall without force fluctuations (zero noise limit). The contact forces between the particles are assumed to be normal and frictionless. The procedure to obtain a stable cluster from a set of n ellipses pushing against a wall is the following: 1) Initialization of the ellipse orientation: A list of n angles ϑi (t=0) are chosen to form a first guess cluster configuration. The index i goes from 1 to n. 2) Positioning of the n ellipses: The n ellipses with orientations ϑi (t=0) are placed in contact with the wall and in contact with their neighbors. 3) Estimation of the contact forces: The magnitude of all the contact forces (ellipse/ellipse and ellipse/wall) are computed from the mechanical equilibrium in the 2 directions of space. The orientations of the forces are known because the forces are normal to the contacts. 4) Estimation of the torque: The torque Γi (t=0) is computed for each ellipse knowing the locations, magnitudes and orientations of the contact forces. 5) Modification of the orientation: The orientation of the ellipse is modified after the estimated torque: ϑi (t=dt) = ϑi (t=0) + dt*Γi (t=0) 6) Convergence: The steps 2-3-4-5 are repeated until a stationary structure is found. A typical structure for a small cluster is shown in S.Fig. 8 along with the results for different cluster sizes. The qualitative agreement between experiments, simulations, and the mechanical model is very good.
Mechanical cluster model: G.
The clusters observed here have a particular hedge hog structure which we describe in detail here: S. Fig.8 shows this structure. The experimental determination of the angle between the wall normal and the rod long axis versus distance along the cluster is shown for clusters of dif-
Obtaining biased trajectories:
In order to obtain rods that have circular trajectories, their legs are shortened on a single side. The shortening of the legs on one side makes the rods rotate in the direction of the shortened legs. We therefore obtain popu-
6
FIG. S 6. P (n) from the central part only avoiding boundary effects (upper left plot). Results from simulations for the central part are included (bottom left plot). P (n) becomes roughly exponential. Division by an exponential function gives a flat variation versus n as shown in the bottom plot on the right. The right upper plot shows the variation of the value of Nc versus surface fraction compared to expectations from a gas of point like particles distributed randomly in the arena.
lations of rotating robots in either directions. The shortening of the legs was done manually so the exact length was difficult to control. Nevertheless, we produced both left turning and right turning rods as shown in Fig. 3, S. Fig. 9 and S. Movie 5.
S. Fig. 9.
For such particles, their trajectories present particular features. Take for example a rod with a trajectory turning clockwise. As it gets trapped near the boundary, and if it is moving along the boundary in the clockwise direction, its own rotation will lead it to leave the boundary. On the other hand if it is moving counterclockwise along the boundary, its own rotation will stabilize the trajectory as seen in S. Fig. 9 for the trajectory marked with a red dashed line. Similarly, for counter clockwise turning rods (blue trajectories) they are more stable if they move up the boundary in the clockwise direction (dashed blue trajectory in S. Fig. 9). Since clockwise rotating rods will have a larger residence time if moving counterclockwise along the boundary and the counterclockwise rotating ones will have a larger residence time if moving clockwise along the boundary, the cluster will grow with one chirality on one side and the opposite chirality on the other, leading to chirality sorting through aggregation,
The boundary in the experiments presented is made of 1mm thick steel. This boundary is difficult to deform. However, by using 0.1mm thick boundary, a rich phenomenology can be obtained in the case where the boundary is not fixed. The boundary is then able to deform and move. These results are shown in Fig. 4 in the main text. Experiments have been carried out with a boundary made of 0.1mm thick paper which is even more flexible. These experiments examine the link between the deformability of the arena and its mobility. Indeed, in a free to move and flexible arena, once a cluster forms, the arena gets highly deformed and becomes asymmetric. The cluster pushes the arena and makes it move. By examining the correlation between the eccentricity of the arena and its mobility (velocity), a clear correlation is obtained with a correlation coefficient near 0.7 indicating a clear link between symmetry breaking and mobility as illustrated in Fig. 4 of the main text. Further and
H.
Effects of flexibility of the boundary
7 1
1
φ= φ= φ= φ=
1 1 % 2 2 % 1 1 % 2 2 % F i t γ=
, U n , U n , O v , O v -0 .6 ;
d e r d e r e r d e r d N c=
F i t γ= - 1 . 3 ; N F i t γ= - 1 ; N
P (n )
P (n )
0 .0 1
c
F i t γ= - 1 . 3 ; N
d a m d a m a m p a m p 1 .1
c
= 4 .2
c
= 7 .7
p e d p e d e d e d
= 1 .8
0 .0 1
1 E -4
1 E -6 -3 0
0
3 0
n
φ= 1 1 % , O v e r d a m p e d φ= 2 2 % , O v e r d a m p e d
1 E -4 6 0
9 0
1 2 0
0
5
1 0
n
1 5
2 0
2 5
FIG. S 7. Effects of high damping: The left plot shows P (n) for similar surface fractions and similar noise amplitude as Fig.1 for the simulations but for very high damping (γr = 100 instead of γr = 3 for Fig.1. Note the presence of a cluster for both densities with few if any particles in the gas phase. Right Plot: For periodic boundary conditions in the simulations, no clustering occurs as the P (n) remain monotonic and close to exponentials (dashed lines) for low surface fractions. The solid lines are fits to the expression given in the text with the exponent and Nc given in the caption. It is thus the boundaries which favor clustering in both the overdamped and the underdamped cases. The overdamped case does favor clustering as the value of Nc is larger.
FIG. S 8. Cluster structure: a) experimental determination of the angle between the wall normal and the rod long axis versus distance along the cluster. b) determination of cluster structure in simulations. Both show an S like structure. This S like structure favors detachment at the two ends where the orientation deviates from normal to the wall. The rods at the two ends exert a force from each end; it is this force which mechanically stabilizes the cluster. This cluster structure does not allow rods to enter the cluster near its central region. Only rods on the boundary can be inserted near the two ends to make the cluster grow. Only the two rods at the two ends can detach from the cluster. The rods in the central region are confined and remain in the cluster. c) cluster structure for different cluster sizes from experiments, d) and e) mechanical model results.
while for hard boundaries, the rods may bounce off the boundary and go into the central area (short residence time at the boundary due to rod/boundary collisions), for flexible boundaries these collisions do not induce a bouncing effect. On the contrary, the particle remains parallel to the boundary for long times (see S. Fig. 10).
Clearly the flexibility of the boundary and its ability to move, reduces the collision efficiency of the rods with the boundary and leads to increased residence times. Also, and because the cluster deforms the boundary and gives rise to a radius of curvature smaller than the initial radius of the arena, the walls stabilize the cluster as the
8
FIG. S 9. Illustration of the trajectories of two rods of different chiralities. The lines (blue or red) indicate the trajectories. The rods with the blue trajectories rotate counterclockwise while the rods with red trajectories rotate clockwise. In the left image, a rod with a blue trajectory moving along the wall in the clockwise direction remains at the boundary for a long time. On the contrary, and for clockwise turning rods (red trajectories), they remain at the boundary when they go in the counterclockwise direction. This effect gives rise to the separation of the two populations in the cluster where the red ones arrive from the right using counterclockwise trajectories while the blue ones arrive from the left using clockwise trajectories.
FIG. S 10. Collision of a rod with a flexible boundary. The whole duration from the upper left to the bottom right image is 1.3s. The images are separated by 0.2s except for the last two where the interval is 0.1s.The boundary is 0.1mm thick paper. Note that the rod deforms and pushes the boundary before reorienting to become parallel to it and move along the wall before escaping.
wall exerts an additional force on the ends of the cluster. This will lead to an increase of the residence time in the cluster and inhibit the rods at the two ends of the cluster from escaping the cluster. The phase diagram for cluster formation will naturally shift to smaller surface fractions.
I.
Details of theoretical model 1.
General equations
Here we introduce a simple theoretical description of an assembly of self-propelled particles in a confined medium. We call N the number of particles, V the available volume which will be assumed to be a disk of radius R. We distinguish between 3 populations of particles: Nv particles in the volume, nc particles in a surface cluster, and to take into account the effects of the surface
we introduce Ns = Ns+ + Ns− which are particles moving freely on the surface (Ns+ and Ns− are the populations with positively and negatively oriented velocities, respectively). In the volume, we assume that shocks between particles occur with a frequency that is high enough to consider that the particles diffuse: the length between two shocks is assumed to be small compared to the other lengths in the system. We call nV (x, t)dx the average number of particles in a surface element dx around x, the equation for nV is ∂t nV = ∇[D∇nV ],
(4)
where D is the effective diffusion coefficient due to collisions between the particles, which can be estimated to D ∼ V 2 τshocks ∼
V , nV `
(5)
where V is the spontaneous velocity of the particles and ` is the typical size of an individual particle. We could consider that D varies with x (because it is inversely proportional to nV ) but, to a first approximation, we will consider that D is independent of x. Actually this diffusion constant can be measured in experiments and its variation with nV is borne out experimentally as shown in S. Fig. 11. At the boundary, the equations for the densities n+ S and n− S (of particles per unit length) with respectively positively or negatively oriented velocities read µ nV (x, t), 2 µ − − ∂ t n− nV (x, t). S = +V ∂s nS − λnS + 2 + + ∂t n+ S = −V ∂s nS − λnS +
(6) (7)
Here, s is the curvilinear coordinate along the boundary, for a disk it is simply s = Rθ. λ is the rate at which particles detach from the surface and is inversely proportional to the residence time τs which can be obtained experimentally. We have assumed that the particle velocity along the boundary is similar to that in the volume. The parameter µ appears in all theories of surface mediated transport [6–9], it has dimension of a velocity and represents the efficiency at which particles that reach the surface will attach to it (see below). Another interpretation is that µ2 /D is the typical length that the particles move with a ballistic motion when escaping from the surface before diffusion becomes dominant again. The parameter µ should be viewed as a phenomenological parameter whose order of magnitude is roughly the spontaneous velocity V of the particles. As we will see below, this parameter can be obtained experimentally. We also assume the presence of a cluster at the boundaries, in which the particles do not move. Only two particles, located at the cluster boundary, can detach from it, with a detachment rate denoted by λc . This hypothesis
9
FIG. S 11. a) Determination of the rods diffusion constant due to collisions with other rods versus surface fraction. Note the variation in φ−1 .The inset shows representative Mean Square Displacements for rods at different surface fractions. The value of D was determined from the linear region. b) The reduced diffusion coefficient versus surface fraction. Note that the value of this coefficient is systematically smaller than 1.
is motivated by experimental observations of the cluster structure (S. Fig. 8) where the rods at the center of the cluster, with orientation normal to the boundary are confined within the cluster by the rods at the two ends of the cluster. There is a time scale associated with a rod leaving the cluster from one of the two ends, and this time scale is denoted τc such that λc = 1/τc . This time scale can be estimated from experiments as shown in Fig. 2 and S. Fig. 12. This is done by counting the number of jumps from a cluster of size n to a cluster of size n − 1 for a fixed period of time. This gives the frequency of detachment of a single rod from the cluster. The variation of the measured estimates of τc versus the rod frequency f is given in S. Fig.12. If the cluster is located in the interval [s1 , s2 ] (with s1 < s2 ), we obtain
− ∂t nc = −2λc + V [n+ S (s1 ) + ns (s2 )],
(8)
(note here that we assume that the velocity of the cluster boundaries is small compared to V ). We also have
n+ S (s2 )
=
n− s (s1 )
= 0.
(9)
The last equation of the model describes the continuity of the flux near the boundary:
−D∇nV · next = µnV −
(n+ S
+
n− S )λ
− λc [δ(s − s1 ) + δ(s − s2 )]
(10)
2.
Conservation of the total number of particles
Let us check that these equations are consistent with the conservation of the total number of particles,
Z
N = Nv + Ns + nc = Z − dxnV (x, t) + ds(n+ S + nS ) + nc
(11)
∂S
We have indeed Z ∂t N =
Z dx∇[D∇nV ] + ∂S
− ds[−V ∂s n+ S + V ∂ s nS
− + − −λ(n+ S + nS ) + µnV ] − 2λc + V [nS (s1 ) + nS (s2 )] (12) Using the divergence formula and the boundary conditions written above, it is straightforward to check that ∂t N = 0.
3.
Solution in absence of clusters and interpretation of the parameter µ
In absence of cluster, the stationary solution is the uniform solution nV (x) = nV =
− (n+ S + nS )λ . µ
(13)
This means that, in the absence of a cluster, the ratio of the number of particles in the volume and in the surface is controlled by λ and µ: Nv Rλ = . Ns 2µ
(14)
10
FIG. S 12. Comparison to theoretical model: The parameters of the model τs , τc and µ can be obtained from experiments and simulations. The upper plot shows the arena, a rod trajectory at a surface fraction of 0.16, and the region delimited by a dashed circle and the boundary where these parameters are measured. The region where we consider the rods to be at the boundary was determined by plotting the radially averaged surface fraction versus distance from the center (upper right plot). This surface fraction shows a surplus near the boundary over a characteristic length scale (dashed line). The extent over which the particles were considered to reside near the surface is determined by this length (the dashed circle in the schematic). a) the ratio NS /NV versus frequency and number of rods in the arena (inset) b) and c) the variation of τs and τc versus the frequency of vibration of the rods. The inset in b) also shows the variation of τs versus the number of rods in the arena.
This relation can be tested experimentally and an important feature is that the ratio is independent of the total density as well as the characteristic properties of the rods used in the experiments such as their vibration frequency f . This test is shown in S. Fig. 12 where v the ratio N Ns is determined from experiments for different densities and different vibration frequencies. Note that this ratio remains constant and allows to determine the ratio µλ unambiguously. Since in experiments the value of λ can also be estimated from the residence time τs near the surface (S. Fig. 12) the parameter µ can also be estimated. This parameter µ is standard in all theories of surface mediated transport [6–9] but it is not easy to interpret its physical origin. We can however interpret it by comparing to the predictions of a more complicated model in which one explicitly takes into account the angular diffusion of the particles. The problem is that this complicates the model which becomes difficult to solve analytically. Let us restrict ourselves here to the case that no cluster is present. Even in this simple case, the model with angular diffusion cannot be solved analytically. We note however that there is one simple case in which one can integrate it: it is the case that the particles that escape from the surface are all emitted in the volume with a probability distribution for the angle ψ between the normal and the different directions
q(ψ) = (cos ψ)/2 (−π/2 < ψ < π/2)
(15)
If q(ψ) has this simple form, one can easily check that − uniform functions nV , n+ S , nS are solutions of the equations. The relation between the bulk density and the surface densities is then
nV (x) =
− π(n+ S + nS )λ 2ηV
(16)
with V the spontaneous velocity of the active particles and 2η the probability for a particle which touches the surface to remain trapped on it. We can compare with our model of surface mediated transport, and identify µ to be µ = 2ηV /π ∼ ηV
(17)
The parameter µ has therefore a simple interpretation in terms of the particles spontaneous velocity V and the probability η to attach to the surface when touching it. Form our estimates in experiments the value of η turns out to be roughly 0.35 and independent of the surface fraction and frequency of the rods.
11 4.
Stationary solution for a cluster of negligible size
In this section we give the solution of the model in the case that the size of the cluster is negligible. In this simple case the model can be used to analyze the shape of the stationary density in a non-trivial geometry. The finite size of the cluster considerably complicates the geometry of the problem and we shall first neglect it: s1 = s2 (modulo the perimeter L = 2πR of the confinement volume). We restrict the analysis to the stationary states, in which no quantity depends on time. Let us first consider the stationary state of Eq. 3:
∂s n+ S +
µ λ + n = nV (x, t). V S 2V
µ = 2V
s
Z
0
ds e
−(s−s0 )λ/V
n0q (r) nq (r) = q2 2 . r r
(26)
where nq satisfies
n00q (r) +
The only solution of the above equation that is finite for all r < R is Aq � r �|q| . R2 R
nq (r) =
(19)
˜
n ˜+ S (θ) =
where we have expressed nV (x) = nV (r, θ) in polar coordinates, and the cluster position is taken at s = 0. The solution of the above equation is
n+ S (s)
(25)
0
nV (R, s /R).
µe−θλ 2V =
θ
µe 2V
µ 2V
µR = 2V
˜ −(θ−θ 0 )λ
0
dθ e
0
(21)
=
nV (R, θ ),
0
˜ = λR . λ V
(22)
∞ X
f (θ) =
fq eiqθ ,
(23)
q=−∞
with the inversion formula
fq =
1 2π
Z
eθλ+iqθ − 1 , ˜ + iq λ
Aq
eiqθ − e−θλ . ˜ + iq λ
(28)
˜
q=−∞
1 2π
Z
2π
dθe−iqθ
0
=
µ Aq − ˜ 2V (λ + iq)
=
µ 2V
∞ X k=−∞
Z 2π 1 dθe−iqθ n ˜+ S (θ) 2π 0 ∞ ˜ X eikθ − e−θλ Ak , ˜ + ik λ k=−∞ ! # ˜ 1 − e−2πλ Ak . ˜ + ik 2π λ
(29) Exploiting the symmetry of the problem, we see that − n ˜+ ˜+ ˜− S (θ) = nS (−θ), so that n S,q = n S,−q . Hence
We now use a decomposition in Fourier modes, defined for any 2π-periodic function f (θ) by ∞ X
˜
Aq
q=−∞
"
in which we have defined the dimensionless quantity
0
The mode amplitudes of n ˜+ S can now be calculated
+ n ˜+ S (θ) = nS (θR)R θ
Aq eiqθ
q=−∞ ∞ X
n ˜+ S,q Z
∞ X
0˜
dθ0 eθ λ
0
=
(20)
Let us define now n ˜+ S (θ)dθ the average number of particles on the surface, between angles θ and θ + dθ, which reads
Z
˜ −θ λ
0
2
(27)
Using this decomposition, we have
µ sλ/V e nV (R, θ = s/R), 2V
∂s [esλ/V n+ S] =
nq (r)eiqθ ,
q=−∞
(18)
We can write the above equation as
∞ X
nV (r, θ) =
n ˜ S,q = n ˜+ ˜− S,q + n S,q =n ˜+ ˜+ S,q + n S,−q # ˜ −2π λ ˜ µλ 1−e = Aq − J , ˜2 + q2 ) ˜ V (λ 2π λ "
(30)
where we have defined the quantity J as
2π
dθf (θ)e−iqθ .
(24)
0
∗ Note that for real f we have fq = f−q . Furthermore, if f (θ) = f (−θ) we also have fq = f−q . We can write
J=
∞ X ˜ k ˜ 2 Ak λA 2λ . = A0 + ˜ + ik ˜ 2 + k2 λ λ k=1 k=−∞ ∞ X
We also introduce J1 such that
(31)
12 and finally J = A0 + J1 .
(32)
Consider now the boundary condition given above:
"
˜ 2π λ 1 − e−2πλ˜
− µnV + D(∂r nV )r=R = (n+ S + nS )λ + 2λc δ(s) λc λ = (˜ n+ + 2 δ(θ). ˜− S +n S) R R
˜c A0 = J − J1 = 2λ # ∞ X ˜2q 2λ − 2 2 ˜2 ˜ ˜2 q=1 [λ + q ][q + D(λ + q )] ˜ c F (λ, ˜ D) ˜ = 2λ
(33)
where the last equality defines the dimensionless function F . The number of particles in the volume the cluster is
In Fourier space, with our notations, we obtain � � λ 2λc 2λc V ˜ D|q| Aq = n nS,q + ˜ S,q + = 2 λ˜ . (34) µ+ R R2 R R R R
Z
2π
Nv = Inserting in this expression the previously obtained expression of n ˜ S,q yields �
" # ˜ ˜2 2λc Aq 1 − e−2πλ µλ Aq − J = + . 2 2 2 ˜ ˜ R2 R R (λ + q ) 2π λ (35) We can simplify this result:
D|q| µ+ R
(42)
R
Z dθ
0
drr nV (r, θ) = πA0 .
(43)
0
The number of particles on the boundaries, outside the cluster is
�
Z NS =
2π
dθ n ˜ S (θ) = 2π˜ nS,0 .
(44)
" # ˜ 1 − e−2πλ µ A0 − J = 2π ˜ ˜ Vλ 2π λ h i ˜ D) ˜ c 2πµ F (λ, ˜ −1 . = 2λ ˜ Vλ
(45)
0
This leads to �
D|q| q2 + ˜2 + q2 ) Rµ (λ
˜ −2π λ
�
˜2J 1 − e λ ˜2 + q2 ) ˜ (λ 2π λ
2λc R . µ (36) Writing the above equation for q = 0 provides the value of J: Aq = −
+
˜
J
1 − e−2πλ 2λc R , = ˜ µ 2π λ
(37)
and we thus deduce �
q2 D|q| + 2 2 ˜ Rµ (λ + q )
� Aq =
2λc R q2 . ˜2 + q2 ) µ (λ
(38)
NS = 2π˜ nS,0
We find that NS and Nv are positive for all parameter values. However our description is consistent only when there is a sufficient number of particles to form a cluster. Since Ns and Nv do not depend on N , the theory seems to predict that there is a critical number of particles, N ∗ under which no cluster is possible (because for N < N ∗ the theory would predict a negative number of particles in the cluster). This critical number is
Defining the dimensionless quantities ˜ c = λc R , λ µ
˜ = D , D µR
(39)
our final result for Aq is
Aq =
˜c q 2λ ˜2 + q2 ) ˜ λ q + D(
(q ≥ 1)
(40)
J1 = J − A0 can thus be expressed as
J1 =
∞ X q=1
∞ X ˜2 ˜2q 2λ 2λ ˜c Aq = 2λ . 2 2 ˜2 + q2 ˜2 ˜ ˜2 λ q=1 [λ + q ][q + D(λ + q )] (41)
� � ˜ c π F + 2µ (F − 1) N ∗ = Noutside = NV + NS = 2λ ˜ Vλ (46) Let us now evaluate the function F . In fact, since one ˜ ∼ D/(RV ), D ˜ is comparable to the ratio can estimate D of the length traveled before reorienting in the bulk, over the diameter of the volume. We already assumed that this ratio is small. In S. Fig.11, experimental determina˜ shows that it is much smaller than 1, which tion of D ˜ This must be done suggests to evaluate F for small D. ˜ carefully, since λ can be large or small compared to 1. We find that ( ˜ 1 + πλ F ' ˜ 2π λ
˜ � 1/D] ˜ [λ ˜ � 1/D(� ˜ [λ 1)]
(47)
13 Inserting this value into our expression for the number of particles outside the cluster at leading order, we find
Noutside
Rλc = 2π µ
( ˜ + 2µπ/V 1 + πλ ˜ 2π λ
˜ � 1/D] ˜ [if λ ˜ ˜ [if λ � 1/D(� 1)] (48)
[1] L. Giomi, N. Hawley-Weld, and L. Mahadevan, Proc. R. Soc. A 469, 20120637 (2013). [2] F. Peruani, et al., Phys. Rev. Lett. 108, 098102 (2012). [3] Y. Yang, V. Marceau, and G. Gompper, Phys. Rev. E 82, 031904 (2010). [4] H. P. Zhang, A. Be’er, E. -L. Florin, and H. Swinney, PNAS, 107, 13626 (2010). [5] F. Peruani and M. Bar, N.J.Phys. 15, 065009 (2013).
[6] A Guide To First- Passage Processes, S. Redner (Cambridge University Press, Cambridge, England 2001) [7] A. M. Berezhkovskii and A. V. Barzykin, The Journal of chemical physics, 136, 054115,5 (2012) [8] T. Calandre, O. Benichou, and R. Voituriez, Phys. Rev. Lett. 112, 230601 (2014) [9] O. Benichou, D. Grebenkov, P. Levitz, C. Loverdo, and R. Voituriez, Phys. Rev. Lett., 105, 150606 (2010). [10] S. Plimpton, J Comp. Phys., 117, 1 (1995).