Mar 2, 2002 - Experimental studies of air entrainment by breaking waves are essential for ... are: bow wave breaking, air entrainment into the ship's turbu-.
Journal of Ship Research, Vol. 46, No. 1, March 2002, pp. 1–15
Journal of Ship Research Bow Wave Dynamics T. A. Waniewski, C. E. Brennen, and F. Raichlen California Institute of Technology, Pasadena, California
Experimental studies of air entrainment by breaking waves are essential for advancing the understanding of these ows and creating valid models. The present study used experimental simulations of a ship bow wave to examine its dynamics and air entrainment processes. The simulated waves were created by a de ecting plate mounted at an angle in a supercritical free-surface ow in a ume. Measurements of the bow wave geometry at two scales and also for a bow wave created by a wedge in a towing tank are presented. Contact line and bow wave pro le measurements from the different experiments are compared and demonstrate the similarity of the ume simulations to the towing tank experiments. The bow wave pro le data from the towing tank experiments were used to investigate the scaling of the wave with the ow and the dependence on geometric parameters. In addition, surface disturbances observed on the plunging wave are documented herein because of the role they play in air entrainment. The air entrainment itself is explored in Waniewski et al (2001).
1. Introduction Wh en a displacement-type ship moves through the water, it typically creates a white-water (foamy, aerated, and turbulent) wake. The main sources of air bubbles in these white-water wakes are: bow wave breaking, air entrainment into the ship’s turbulent hull boundary layer at the free surface, and ventilation and cavitation of the propeller(s). In recent years, a speci c interest in these ows arises from the need for signature estimation from white-water wakes created by U.S. Navy destroyers. These ships travel at over 16 m/s (30 knots), creating wakes which can be several kilometers in length. In addition to being visible to the naked eye, these wakes may be observed by other methods, including microwave radar, synthetic aperture radar, and infrared radiometry (Peltzer 1984). Despite the complexity of these multi-phase ows, numerical models have been developed and computations performed. Carrica et al (1998) demonstrated that the bubbles introduced at the bow of the ship have signi cant effects on the wake; however, this study and others lack an accurate model for the bow wave air entrainment process and use arbitrary bubble sources unrelated to the ow parameters. Increasing the realism of these calculations depends on including accurate models for the bow wave air entrainment process (perhaps similar to Baldy’s (1993) model for Manuscript received at SNAME headquarters August 5, 1999; revised manuscript received August 14, 2001. MARCH 2002
bubbles created by wind waves), and experimental work is the key to developing them. The present study used a simulated bow wave produced using a stationary de ecting plate in a supercritical free surface ow in a recirculating free surface water channel. This stationary, simulated bow wave allowed for detailed examination of the breaking process. Additional towing tank experiments using similar models and ow conditions con rmed that this was a valid simulation. This paper focuses on how the bow wave changed with the ow and geometric parameters. An earlier paper describes the measurements of the air entrainment process (Waniewski et al 2001).
2. Experimental equipment Stationary model experiments were conducted in a 40 m long recirculating and tilting ume with a slope of 1 vertical to 50 horizontal; it is referred to herein as the large ume. It was 109 cm wide with 1.3 cm thick tempered glass sidewalls and a stainless steel bottom plane to within 205 mm. The large ume was lled with city tap water at about 23 C. The ow rate, Q, was measured to within 000014 m3 /s using a 41 cm Venturi meter in the recirculating system; the maximum discharge was approximately 00394 m3 /s. To create the supercritical ow needed for this type of experiment, a two-dimensional spillway section was installed at the upstream end of the ume, downstream of a 8.1 m long reservoir. The mean velocity of this ow was U D Q=A
0022-4502/02/4601-0001$00.55/0
JOURNAL OF SHIP RESEARCH
1
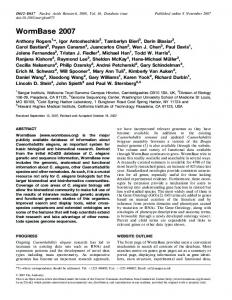
Fig. 2 Fig. 1
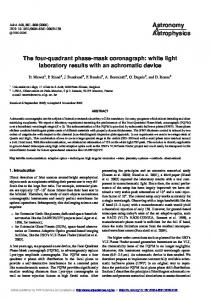
View of de ecting plate with wave gages marked
Plan view of test section in 40 m ume
where A D 1009 d m2 and d was the depth measured upstream of the de ecting plate using a point gage. The test section was located approximately 24 m, or over 200 depths, downstream of the spillway. A 75 cm long and 50 cm high Lucite plate was mounted in the test section at an angle ˆ to the oncoming ow to simulate a wedge-shaped hull with half angle ˆ (Fig. 1). Its leading edge was displaced 12 cm from the ume sidewall. The dihedral angle, ”, the angle between the plate surface and the undisturbed free surface, also could be changed. A steady breaking wave similar to that observed at the bow of a ship is created as the ow rides up on the plate. Stationary model experiments also were conducted in a much smaller recirculating glass bottom tilting ume, 265 cm long and 45.9 cm wide which will be termed the small ume. It was lled with tap water at about 23 C. The ow was adjusted using both a ow control valve downstream of the pump and a ap nozzle located at the entrance to the ume. This generated supercritical ows approximately 1 cm deep. A mercury/water manometer connected to an ori ce meter was used to determine the ow rate, Q, to within 100 cm3 /s; the maximum ow rate was about 0.01 m3 /s. The velocity of the ow was U D Q=A where A D 00459 d m2 . The 12 cm high and 42 cm long Lucite de ector plate was 35 cm downstream of the ume inlet, and its leading edge was located a few centimeters from the ume side wall. The towing tank experiments were conducted in a 126 m long, 7.5 m wide, and 3.7 m deep tank at Hydronautics Research, Inc. in Fulton, Maryland. This was lled with fresh water at about 16 C. Two wedge models with bow half angles of 13 deg and
26 deg were used, each with 1.3 cm thick Lucite sidewalls and 0.64 cm thick aluminum bottoms. The maximum velocity of the towing carriage was approximately 5.2 m/s, and the draft could be changed from about 5 cm to 25 cm. In the ume experiments, the elevation of the surface of the bow wave was measured using an electronic point gage. The tip of this gage was a sharpened stainless steel rod 1.64 mm in diameter, and the water surface elevation was de ned when the tip of the rod was in contact with the water surface 50% of the time. In the small ume, the point gage was positioned manually to within 1 mm in the streamwise direction, 005 mm in the cross stream direction, and 1 mm in the vertical direction. In the large ume, the point gage was positioned to within 0003 mm in the streamwise direction and 006 mm in the cross stream direction using stepper motors. A feedback system activated a motor which adjusted the vertical position of the gage to the pre-set contact time percentage (Waniewski 1999). The expected error in these elevation measurements is also less than 1 mm. In the large ume, three ush-mounted wave gages were used to measure the oscillation of the free surface height on the de ecting plate. Each wave gage consisted of a pair of electrodes spaced 0.64 cm apart. Figure 2 shows the de ecting plate with the location of the gages marked. Although there was some run up and splashing on the wave gages, the oscillations of the free surface could be measured. Free surface oscillations in the ume reservoir upstream of the spillway also were measured using a resistance type wave gage. Further details are given in Waniewski (1999).
Nomenclature d D upstream depth or model draft (m) F D Froude number based on upstream p conditions, F D U = gd F1 D Froude number based on upstreampwater depth, F1 D U = gd F2 D Froude number based on model p draft, F2 D U = gd g D gravitational acceleration (m/s2 ) lmax D location of maximum elevation in r-direction (cm) 2
MARCH 2002
Q D ume volumetric ow rate (m3 /s) r D horizontal coordinate along de ecting plate r 0 D nondimensional coordinate along de ecting plate, r 0 D r=Fd D R Reynolds number, R D U d=Œ U D upstream velocity (m/s) Ui D jet velocity at impact (m/s) W D Weber number, W D U 2 d=‘ x D streamwise coordinate y D cross stream coordinate z D vertical coordinate Z D free surface height
Z * D nondimensional free surface elevation, Z * D Z=4F105 d 2ˆ=1805 D Zmax maximum free surface elevation (cm) ‚ D angle of impingement (deg) Œ D dynamic viscosity (kg/ms) D kinematic viscosity (m2 /s)
” D dihedral angle (deg) D density (kg/m3 )
ˆ D wedge half-angle (deg) JOURNAL OF SHIP RESEARCH
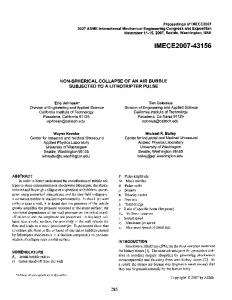
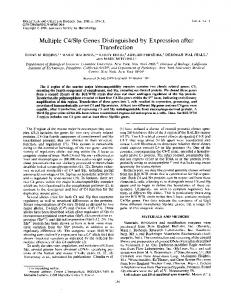
Fig. 3
Schematic of main features of bow wave. Undisturbed free surface is z D 0 cm and leading edge of de ecting plate is at 4x1 y 5 D 401 05
3. Experimental observations In the ume experiments, the bow wave generated by the de ecting plate transitioned through three distinct regimes depending on the Froude number, F1 . For subcritical ow conditions, the plate created a disturbance extending 5 cm to 10 cm upstream of the leading edge. At critical ow conditions, a wave similar to an oblique hydraulic jump was observed ahead of the plate. Then, for supercritical ow conditions, a wave similar to a bow wave was formed. Figure 3 presents an exaggerated schematic of the bow wave with the key features labeled. In all cases, the free surface was unsteady and turbulent on and behind the wave front. These ow regimes also were observed in the towing tank experiments where a Froude number based on draft rather than depth characterized the ow. Miyata & Inui (1984) observed similar waves in their towing tank experiments. It is important to emphasize the key role which the ow at the leading edge plays in determining the geometry and height of the bow wave. Noblesse et al (1991) demonstrated this analytically, and concluded that the ow direction must be vertical at the free surface/leading edge intersection. Just how critical this local ow is to subsequent development of the bow wave is demonstrated by the photographs in Fig. 4. In Fig. 4(a), the leading edge of the de ecting plate is against the ume wall and “turns” the ow creating a wave similar to an oblique hydraulic jump. On the other hand, in Fig. 4(b) the de ecting plate is at the same angle to the ow as in Fig. 4(a), but it is displaced from the ume wall by 2.5 cm. In contrast to Fig. 4(a) (where the vertical velocity at the intersection of the wall and the de ecting plate must be zero), the vertical velocity at the bow in Fig. 4(b) creates a liquid sheet which has an elevation above the free surface at the leading edge! This initial elevation has been reported by other researchers as well (see, for example, the photographs of the recent towed ship model experiments by Dong et al (1997)). The liquid sheet then continues to ride up on the plate before it separates and forms MARCH 2002
the bow wave. Note that the height of the run-up is much greater than in Fig. 4(a), presumably because the leading edge is outside the wall boundary layer. In Fig. 4(b), as the ow moves away
(a) Leading edge against the flume wall.
(b) Leading edge displaced 2.5 cm away from the flume wall. Fig. 4 Photographs of bow waves in 2.6 m ume; ow is from left to right. The grid on de ecting plate is 2 cm by 2 cm, and ˆ D 25 deg, ” D 0 deg, U D 1058 m/s, d D 1021 cm, and F1 D 4059 JOURNAL OF SHIP RESEARCH
3
from the plate, it continues in the upward direction so that the maximum height of the bow wave is located a few centimeters away from the de ecting plate. A thin secondary liquid sheet is observed on the plate surface in the experiments as shown schematically in Fig. 3(b). The water in this secondary liquid sheet seemed to result from the unsteadiness of the contact line on the plate. Returning now to the general description depicted in Fig. 3, once the wave has reached its maximum height, gravity causes it to plunge back towards the free surface as shown in cross section B-B in Fig. 3(b). Moreover, inspection of the breaking wave jet reveals almost equally spaced striations along the surface oriented perpendicular to the wave crest; these will be discussed further in section 9 and in Waniewski et al (2001). The edge of the breaking wave is irregular and decomposes into individual jets or strings of droplets as it impacts the free surface along a line we call the impact line (Fig. 3(a)). The impact causes a splash region shown schematically in Fig. 3. Although the majority of the splash is formed by the wave jet “bouncing” off the undisturbed free surface, ow visualization tests showed that some of the freestream ow also enters the splash. The waves generated in the towing tank experiments, where the ratio of the wedge draft to the tank depth varied from 0.014 to 0.068, were similar to the waves generated in the ume experiments. Quantitative similarities will be discussed in section 5. Also, even though the waves created in towing tank experiments had a glassier appearance and a steadier contact line (since the water in the towing tank was quiescent), roughnesses or striations were still observed on the bow waves in these experiments. Photographs of the waves from the ume experiments and the towing tank experiments are included as Fig. 5.
(a) Large flume experiment.
(b) Towing tank experiment. Fig. 5 Photographs of bow waves for conditions with similar velocity and draft in 40 m ume ( ow is from right to left) and in towing tank (wedge is moving to right)
4. Contact line and bow wave pro le results The contact line of the bow wave on the plate surface was measured in both the large and small ume experiments using the free surface probe (section 2) and these data are shown in Fig. 6. Table 1 lists the corresponding ow conditions. The bow wave pro le, the pro le of the maximum free surface height of the wave, was measured in the towing tank and the large ume experiments. The pro les were determined using digitized images of the bow wave; each point along the pro le could be speci ed to the nearest pixel, or 4 mm. The camera was oriented perpendicular to the model sidewall, and its eld of view encompassed the entire wall. Initial measurements con rmed the repeatability of these measurements (Waniewski 1999). Figure 7 presents a summary of the data from the towing tank experiments, and Table 2 lists the ow conditions corresponding to each symbol. Here r D 0 corresponds to the leading edge, and z D 0 corresponds to the location of the undisturbed free surface. For some of the higher velocity runs in the towing tank experiments, the crest of the bow wave was not in the eld of view of the camera. In these runs, the model generated a spray sheet which was quite different from the bow wave shown in Fig. 5(b); the sheet would often break up into droplets before the maximum elevation was achieved. These data from the ume and the towing tank experiments will be presented and compared in nondimensional form later in sections 5 and 8. 4
MARCH 2002
5. Comparison of ume and towing tank measurements We rst address the issue of whether the ume experiments generated waves similar to those created by a ship’s bow in the towing tank experiments. To do so, we compare the maximum elevations of the wave pro les above the undisturbed free surface, Zmax , in the large ume and towing tank experiments. For reasons discussed later in section 8, a nondimensional Zmax denoted by * Zmax is de ned as * D Zmax
Zmax F105 d
2ˆ 180
(1)
* The resulting values of Zmax are presented as a function of Froude number in Fig. 8. Ogilvie’s (1972) results from towing tank experiments also have been added in addition to the maximum height of the contact line in the present small ume experiments. This gure suggests that the ume and towing tank experiments yield similar results and that the water depth and model draft to depth ratio does not have a signi cant effect on the bow wave pro le.
6. Theoretical analyses of contact line Two different theoretical analyses of the contact line were explored in Waniewski (1999). The rst approach was an JOURNAL OF SHIP RESEARCH
Table 1
Fig. 6 Summary of contact line results from ume experiments. The error in r was 0.9% for small ume experiments and ?% for large ume experiments. In both experiments, elevation was measured to 1 mm
extension of Ogilvie’s (1972) slender body theory to the case of a wedge-shaped bow in a ow of nite depth which is equal to the draft. This approach essentially linearizes the problem in the ydirection, and cannot capture the sudden changes in free surface height which occur near the bow particularly at the leading edge. The solution underestimates our experimental wave heights by an order of magnitude, and does not predict the discontinuity in the free surface elevation observed at the leading edge (see Fig. 4). It was also compared to the contact line elevation solution for a MARCH 2002
Conditions explored in ume experiments
vertical wave maker moving horizontally with a step velocity in a uid of nite depth presented by Joo et al (1990). Their contact line solution is closer both in shape and in magnitude to the experimental results. Using the results they present in their Fig. 5, for a ow with U D 2050 m/s, d D 7054 cm, and F D 2091 a maximum elevation of 25.9 cm is predicted at a distance r D 2107 cm downstream of the leading edge. This compares well with the data presented in Fig. 4.6 in Waniewski (1999). For this reason, it appears that the analyses explored by Waniewski has other de ciencies in addition to those arising from the linearization, for example, the neglect of surface tension which Joo et al include. Note that Joo et al’s solution is not valid for very small times which corresponds to regions very close to the bow. They emphasize that the nonlinear effects must be considered here. Other researchers, including Noblesse (1983), used slender body theory and reported similar dif culties predicting bow wave shapes especially at the leading edge. We conclude that slender body theory is inappropriate for ows around a wedge shape bow; according to Fontaine (1997) this is because the theoretical uid acceleration is in nite at the leading edge. The second approach pursued by Waniewski (1999) considered perturbations of planar potential ow around a nite hull body but is valid only for Froude numbers less than unity. Other researchers have used a “parabolic” approximation of the equations called the “2D C t” (two dimensions plus time) theory. This approach reduces the three-dimensional nonlinear stationary problem to a set of two-dimensional transient problems; a literature review may be found in Fontaine & Tulin (1998). In fact, the rst analytical approach explored by Waniewski (described above) corresponds to the 2D C t linear solution taking into account the nite depth of the tank. A physical interpretation of the 2D C t approximation is given in Fontaine & Tulin (1998) as follows. First, ow cross sections perpendicular to the velocity of the ship and stationary with respect to the uid are considered. In these cross sections, the ow appears to be generated by a two-dimensional wave maker which corresponds to the ship hull. In other words, the time variation of the hull crosssectional area (in the aforementioned ow cross section) generates nonlinear diverging waves. Results for the ow around a wedge shaped bow using this approximation may be found in Fontaine & Cointe (1997) and also Fontaine & Faltinsen (1997), and the numerical results appear promising. The free surface at the leading edge is predicted; however, the elevation is less than JOURNAL OF SHIP RESEARCH
5
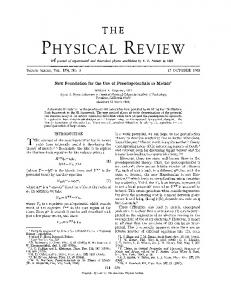
Fig. 7
Summary of bow wave pro le results from towing tank experiments, ˆ D 26 deg. Each point along pro le was speci ed to nearest pixel, or 4 mm
the experimental measurement by approximately a factor of two. Perhaps this is because their expression is valid for high Froude numbers (F 1) whereas their experiments were performed for Froude numbers ranging from 0.56 to 1.5.
7. Plunging jet shape In the ume experiments, the free surface elevation was measured for different ow cross sections to study the developing shape of the plunging wave jet. Describing this feature of the bow wave is important not only for understanding the threedimensional structure of the waves, but also for understanding the air entrainment process. As described in Waniewski et al (2001), many researchers have identi ed the jet size, jet velocity, and 6
MARCH 2002
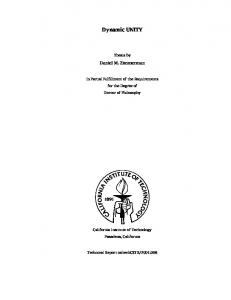
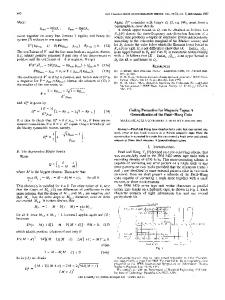
impingement angle as key parameters for modeling air entrainment by plunging jets. In these experiments, the jet size and impingement angle were measured directly, and the jet velocity was calculated (Waniewski 1999). In the large ume experiments, cross sections were measured along sections perpendicular to the direction of the upstream ow using the free surface probe (section 2) at three different streamwise locations for each ow condition. Figure 9 presents a typical result which shows both the exterior and interior surfaces of the jet. The data describing the interior surface is limited by the large amount of splash in this region of the ow which caused incorrect gage readings; however, there were adequate data to de ne the jet thickness to be about 3 cm. It should also be noted that, for these measurements, the jet did not break up into the strings of droplets described later in section 10. JOURNAL OF SHIP RESEARCH
Table 2 Bow wave pro le experimental conditions, ˆ D 26 deg
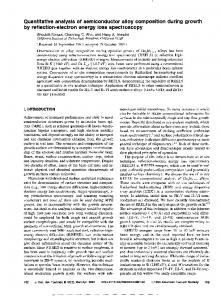
In the towing tank experiments, ow frontal aspects were measured from digitized images of the bow wave. The camera was secured to the carriage and oriented with the axis of the lens parallel to one side of the wedge so that its eld of view encompassed the entire wave cross section. A typical image is shown in Fig. 10. Figure 11 shows the bow wave frontal aspects for ve different run conditions having nearly the same velocity. Note that the y * -coordinate is perpendicular to the side of the wedge rather than the oncoming stream as in the large ume results. The leading edge of the wedge is located approximately at y * D 0, and the undisturbed free surface at the leading edge of the wedge
Fig. 9 Cross sections of plunging wave jet in large ume experiments (ˆ D 2504 deg) for different distances downstream of the de ecting plate leading edge; U D 2039 m/s, d D 9047 cm, and F1 D 2048
* Fig. 8 Nondimensional maximum wave pro le elevation, Zmax , as a function of Froude number, F, for ume and towing tank experiments. Small ume experiments (s) have ˆ D 1304 deg, large ume experiments (n) have ˆ D 2608 deg, and towing tank experiments ( ¦ ) have ˆ D 26 deg. For Ogilvie’s towing tank experiments, ˆ D 15 deg and () for d D 1002 cm, (4) for d D 2004 cm, (&) for d D 3005 cm, and (C) for d D 4006 cm
MARCH 2002
is located at z D 0. These results demonstrate the repeatability of this measurement technique, and show a jet which is about 2 cm to 3 cm thick with an angle of impingement, ‚, relative to the undisturbed free surface of about 58 deg. Note the many similarities of the jets formed in the ume and towing tank experiments as shown in Figs. 9, 10, and 11. Since the plunging wave jet is in free-fall just before impact, it is possible to calculate the horizontal water particle velocity at the crest of the plunging breaker, Ub , using the angle of impingement, ‚, and the free-fall height, hf , determined from Fig. 11 and the JOURNAL OF SHIP RESEARCH
7
8. Scaling analysis and considerations Understanding the manner in which these waves scale is necessary to extend laboratory experiments to ows for ship hulls of various shapes operating at different speeds and drafts. In this section, we develop a relation for the maximum free surface elevation, Zmax and its distance from the leading edge of the de ecting plate, lmax . The functional relationship which describes the wave shape is
Exterior surface Interior surface
z D f 4U 1 g1 d1 r1 Œ1 1 ˆ1 ”5
(4)
which also can be expressed by equations Fig. 10 A frame from video of plunging jet in towing tank experiments for ˆ D 26 deg, U D 2050 m/s, and d D 7054 cm. Camera is looking at bow of model parallel to starboard side
tan4‚5 D
2ghf Ub
(2)
The jet velocity at impact, Ui , also can be calculated from Ui D
q
Ub2 C 2ghf
(5)
r D f2 4U 1 g1 d1 Œ1 1 ˆ1 ”5 for a given z
(6)
and
equation p
z D f1 4U 1 g1 d1 Œ1 1 ˆ1 ”5 for a given r
By the Buckingham Pi theorem, equations (5) and (6) are equivalent to z r D f3 4F1 R1 ˆ1 ”5 for a given d d
(7)
r z D f4 4F1 R1 ˆ1 ”5 for a given d d
(8)
and (3)
For ‚ D 58 deg and hf D 20 cm, equations (2) and (3) give Ub D 102 m/s and Ui D 203 m/s, reasonable values since the towing speed was 2.5 m/s.
where R D 4U d5=Œ is the Reynolds number based on upstream ow conditions. Thus, the normalized maximum free surface elevation, Zmax =d, and the normalized distance from the leading edge to the maximum, lmax =d, can be expressed independently as functions of the ow parameters F and R and the geometric parameters ˆ and ” as Zmax D f5 4F1 R1 ˆ1 ”5 d
(9)
lmax D f6 4F1 R1 ˆ1 ”5 d
(10)
and
Fig. 11 Frontal aspects of plunging wave jet in towing tank experiments for d D 7054 cm and ˆ D 26 deg. Symbols indicate velocity: (´ ) for U D 2048 m/s, () for U D 2050 m/s, (*) for U D 2050 m/s, ( ) for U D 2050 m/s, and (4) for U D 2050 m/s. The dotted line separates exterior jet surface data from interior jet surface data 8
MARCH 2002
We continue this section by using the experimental data to seek functions f5 and f6 . We examine rst the bow wave pro le data from the towing tank experiments since these encompassed a wider range of ow conditions (velocities and drafts) than the ume experiments. The maximum elevation of the bow wave pro le, Zmax , is plotted against velocity in Fig. 12(a). Note that these are the same data that were presented in Fig. 8. Figure 12(a) demonstrates quite convincingly that Zmax / U 105 ; the linear curve t was Zmax D 5064U 1049 using the method of least squares. Consequently, Zmax =U 105 was plotted against draft in Fig. 12(b). This suggests that Zmax =U 105 / d 0025 ; the linear curve t was Zmax =U 105 D 3067d 00189 . We conclude that Zmax / U 105 d ƒ0075 d JOURNAL OF SHIP RESEARCH
A similar procedure was applied to the lmax =d data to investigate the scaling in the r -direction. The result (Waniewski 1999) was that lmax / U 2 d ƒ 105 d thus, equation (10) becomes lmax D F 7=3 R ƒ1=3 f8 4ˆ1 ”5 d
Fig. 12 Scaling of maximum wave elevations from towing tank experiments with velocity and draft shown on logarithmic scales
therefore, equation (9) becomes Zmax D F105 f7 4ˆ1 ”5 d
(11)
and this normalized maximum appears to be independent of the Reynolds number within the parameter range investigated. This relationship also is apparent in Fig. 8 for the ume experiments and Ogilvie’s towing tank experiments. MARCH 2002
(12)
The results from this scaling analysis do not agree with the scaling derived by Ogilvie (1972), nor with the scaling derived by Waniewski (1999) using an alternative analytical approach. For a given ˆ and ”, Ogilvie derived the nondimensionalization Z 0 D Z=Fd and Waniewski (1999) derived the nondimensionalization Z 0 D Z=d. Intuitively, it seems that distances in the z-direction should scale with some combination of the velocity head, U 2 =2g (or F2 d), and the draft, d, though it is unclear which length would be more important. Perhaps both Ogilvie’s and Waniewski’s analyses include assumptions which mask the true scaling seen in the experiments. We are particularly suspicious of the treatment of the ow near the leading edge for the reasons described in section 3. In the r -direction, Ogilvie derived the nondimensionalization r 0 D r=Fd. The scaling relation in equation (12) includes a Reynolds number and is quite different. The Reynolds number provides an appropriate scaling with velocity and draft (for the towing tank experiments), but it is not possible to verify this using the present database. We speculate, however, that viscous effects could in uence ow at the leading edge, and therefore, the location of the maximum wave elevation, lmax . For example, if the kinematic viscosity, , increased, the Reynolds number would decrease, and according to the scaling relation lmax would move downstream from the leading edge. This seems correct because an increase in would also cause an increase in the shear stress on the plate. Then, the ow would lose energy in overcoming this shear stress and take longer to achieve its maximum. The scaling described in the preceding paragraphs was then applied to the data from all of the bow wave pro le experiments, and the results for ˆ D 26° are presented in Fig. 13. Theoretically, all of the data should collapse onto a single pro le. Figure 13 demonstrates good agreement of the wave pro les near the leading edge; however, the pro les deviate somewhat further downstream, particularly for d D 4095 cm and 7.54 cm. Nevertheless, the experimental data suggest a scaling with ow parameters which is not explained by the existing theoretical analyses but makes some intuitive physical sense. The preceding discussion was con ned to a particular wedge angle, ˆ, and dihedral angle, ”; however, we now seek functions f7 and f8 from equations (11) and (12). We begin by examining the effects of the model bow half angle, ˆ, on the contact lines of the waves using the ume results. Recall that Ogilvie suggested the free-surface height scaled linearly with bow half angle as in equation (1). Using this idea along with the ow parameter scaling discussed above, the free surface height was nondimensionalized by Z Z * D 105 2ˆ F d 180 and the distance in the r -direction was nondimensionalized by lmax . The resulting dimensionless pro les are presented in Fig. 14. JOURNAL OF SHIP RESEARCH
9
Fig. 13 Nondimensional bow wave pro le data for ˆ D 26 deg shown as z/4F105 d5 plotted against r /4F203 Rƒ003 d5. Open symbols represent towing tank experiments and lled symbols represent large ume experiments. Flow conditions for all of different symbols are listed in Table 2
For the small ume experiments, the scaling appears to work reasonably well. For the large ume experiments, the scaling seemed to overcompensate for the larger bow half-angle. This might be due simply to experimental error in measuring the contact line which was very unsteady in those experiments. However, it is also possible that the bow wave does not scale linearly with angle ˆ as suggested by Ogilvie and that a more complicated nonlinear relationship exists. We now examine the effect of the model dihedral angle, ”, on the waves using results from the small ume experiments. The dihedral angle, the angle between the face of the de ecting plate and the vertical plane, was varied from 0 deg to 15 deg. The results are presented in Fig. 15: Fig. 15(a) is for F1 3, Fig. 15(b) for F1 4, and Fig. 15(c) for F1 5. The data show that the contact line is only weakly dependent on the dihedral angle; however, the elevation of the contact line does appear to increase as the dihedral angle increases, and one hypothesis could be that Z / 1= cos4”5. In summary, the experimental data indicate that the free surface elevations scale approximately linearly with the bow half-angle, ˆ, and are only weakly dependent on the dihedral angle, ”.
9. Surface disturbances Surface disturbances were observed on the plunging face of the bow wave in both the ume and towing tank experiments, and were recorded using various photographic techniques. The surface disturbances appeared as striations or “ nger-like” structures on the plunging face of the wave in all of the experiments. The “ ngers,” the crests of the disturbances, were aligned perpendicular to the wave jet pro le and the spacing between successive “ ngers” seemed regular as shown schematically in Fig. 16. The disturbances were barely visible near the leading edge of the plate and grew in amplitude as they convected downstream along the crest of the bow wave. They also grew in length, stretching as the 10
MARCH 2002
Fig. 14
Nondimensional contact lines from ume experiments for different bow half angles
liquid sheet fell away from the plate to form the plunging face of the wave. The upstream ow conditions signi cantly affected the appearance of the surface disturbances. In the large ume experiments, the surface of the wave was visibly rough due to the upstream ow conditions and this obscured the surface disturbances. Figure 5(a) demonstrates this point. The upstream conditions could be more carefully controlled in the small ume JOURNAL OF SHIP RESEARCH
Fig. 15
Effect of dihedral angle on the contact line for small ume experiments; (C) for ” D 0 deg, (*) for ” D 5 deg, () for ” D 10 deg, and (´ ) for ” D 15 deg
experiments and the disturbances on the wave can be seen in Fig. 4. The waves in the towing tank experiments had the smoothest surface; therefore, it was easier to distinguish the
Fig. 16
Schematic of top view of bow wave indicating crests of surface disturbances
MARCH 2002
surface disturbances. Frames of a video from these experiments are included in Fig. 17. High speed videos were used to estimate the wavelength and velocity of the disturbances. Figure 18 reproduces one frame from a high speed video of the large ume experiments. From this frame and others, the wavelength was found to range from 7 cm to 16 cm at the wave pro le baseline. By tracing the progress of these surface disturbances from frame to frame, it was determined that their average velocity was 2.4 m/s, approximately the velocity in the direction of the de ecting plate, namely 206 cos(25 deg). Dividing the average velocity by the average wavelength yielded a characteristic frequency for these disturbances of 22 Hz. The same high speed videos also were used to produce water surface time histories at two locations along the wave crest, and an example is shown in Fig. 19. Although the resolution of these time histories is poor, both a lower frequency component and a higher frequency component can be observed. The lower frequency is approximately 1 Hz, and it is likely that it originates JOURNAL OF SHIP RESEARCH
11
Crests of disturbances
Baseline
(a) Leading portion of wave.
Fig. 18 A frame from high speed video of surface disturbances at trailing edge of de ecting plate. Flow is from right to left and F D 30181 U D 2064 m/s, and d D 701 cm
(a) Middle portion of wave.
reservoir to de ne the water surface time history there. The wave gage voltage signals were sampled at a rate of 100 Hz for 164 seconds, and post-processed using a fourth-order Butterworth lter with a cutoff frequency of 50 Hz. Examples of the ltered voltage signals are shown in Fig. 20. Autocorrelations of the signals demonstrated that they each contained a 1 Hz component, a perturbation which was endemic throughout the ume (Waniewski 1999). Cross-correlations between wave gage records also were computed, and an example is presented in Fig. 21 for the cross-correlation between gages 1 and 3. The dominant peak occurs at 0.186 sec which, given
(a) Trailing portion of wave. Fig. 17 A frame from video of surface disturbances observed in towing tank experiments. The wedge is moving to left and ˆ D 26 deg, ” D 0 deg, U = 2.49 m/s, d D 7054 cm, and F1 D 2090
from the ow conditions in the 40 m ume. The higher frequency component, estimated by counting local maxima within xed time intervals, was between 15 Hz and 20 Hz. This is close to the surface disturbance frequency measured from video images of the traveling wave disturbances mentioned earlier. Three wave gages ush-mounted on the surface of the de ecting plate also were used to produce time histories of the free surface height at the plate surface. In addition, a wave gage consisting of two stretched wires was located in the upstream 12
MARCH 2002
Fig. 19 Water surface time histories for two locations along surface of de ecting plate; (- -) for r D 5302 cm and (—) for r D 7500 cm. Flow conditions were U D 2064 m/s, d D 7003 cm, F1 D 3018, and ˆ D 25 deg JOURNAL OF SHIP RESEARCH
Fig. 21
A typical cross correlation for signals from wave gages 1 and 3 on de ecting plate (wg1 and wg3) shown in Fig. 20
Table 3 summarizes the measurements of frequency, velocity, and characteristic length of the surface disturbances using the two techniques on the bow wave and using the wave gages on the plate. All techniques yielded similar results, a 1 Hz frequency induced by ow conditions and higher frequencies from the surface disturbances. Fig. 20 Typical wave gage signals from three wave gages ush mounted on de ecting plate. Wave gage 1 (wg1) is 2.5 cm downstream of leading edge, wave gage 2 (wg2) is 20 cm downstream of leading edge, and wave gage 3 (wg3) is 40 cm downstream of leading edge. Reservoir wave gage (res) is located in upstream reservoir of 40 m ume. For these tests: ˆ 26 deg, ” D 0 deg, U D 2069 m/s, d D 7018 cm, and F1 D 3021
the distance of 37.5 cm between these gages, corresponds to a surface disturbance traveling at about 2.0 m/s. Since the liquid sheet is approximately 6 cm to 16 cm above the undisturbed free surface height, the velocity of the liquid along the contact line should be about 10% to 25% less than the incident ume, or 2.0 m/s to 2.5 m/s. Thus, it appears that the disturbances move along the face of the plunging wave at the ow velocity. The other cross-correlations yielded similar results (Waniewski 1999). To further examine the frequencies of the surface disturbances, fast Fourier transforms (FFTs) of the signals were calculated. Figure 22 presents typical averaged, smoothed FFTs for the four wave gages. It clearly shows a difference in the frequency content of the signals from the reservoir and the three wave gages on the plate. The spectra from the plate wave gages show greater energy and a more uniform distribution of energy between 10 Hz and 25 Hz than the spectrum from the reservoir gage. It is believed that this frequency range corresponds to the surface disturbances. Using this frequency range and the velocity calculated from the cross-correlations, a range of characteristic lengths for the disturbances was found to be 8 cm to 20 cm. MARCH 2002
10. Discussion of surface disturbances The surface disturbances were observed in both the ume and the towing tank experiments; therefore, we would expect to see them on bow waves caused by moving ships. Similar surface
Fig. 22 Averaged fast Fourier transform over ve data runs for ow conditions listed in Fig. 20. Each line represents data from a different gage: (- -) for wg1, (–) for wg2, ( ) for wg3, and (- ) for res JOURNAL OF SHIP RESEARCH
13
Table 3 Summary of results from different measurement techniques used to study surface disturbances observed on bow wave
disturbances also can be observed in the photographs of plunging jets during wave breaking shown by Tulin & Waseda (1999). We postulate that the surface disturbances are gravity waves which propagate along the bow wave oriented as shown in Fig. 16. Longuet-Higgins (1995) describes a similar situation in his analytical discussion of the disintegration of the jet in a plunging breaker. He begins by assuming a perturbation in the form of short surface waves, or gravity waves, which propagate across the jet surface perpendicular to the plunging jet direction. As the wave breaks and the jet stretches, the uid begins a state of freefall. This causes the perturbation waves to transition from gravity to capillary waves, and this transition increases their amplitude substantially. In the case of perturbations symmetric on both sides of the jet, Longuet-Higgins found that they will grow again relative to the jet thickness as the jet is stretched even further and can pinch the sheet into “cylindrical drops” or “jets.” This hypothesis and discussion are a plausible explanation for the breakup of the present plunging wave jet by the surface disturbances. In the present experiments, strings of droplets similar to Longuet-Higgins’ “cylindrical drops” were seen to form on the edge of the plunging wave jet as illustrated in the photographs
Fig. 23 A frame from video of breakup of plunging wave jet into strings of droplets (indicated by arrows) in towing tank experiments. The wedge is moving to left and ˆ D 26 deg, ” D 0 deg, U D 2099 m/s, d D 25014 cm, and F2 D 1091 14
MARCH 2002
from the large ume in Fig. 5(a) and from the towing tank in Fig. 23. It seems that the size and spacing of the strings of droplets are controlled by the size of the surface disturbances. It is also possible that the disturbances originate from an instability in the ow as it passes over the de ecting plate. Observations of instabilities developing in liquid sheets on solid surfaces are not unique. For example, Shroff & Liepmann (1997) reported two-dimensional instabilities on a water sheet which developed as the sheet moved over a curved solid surface and persisted even after it left the surface.
11. Conclusions Experimental measurements of the geometry of breaking bow waves were obtained from the waves generated by a de ecting plate in a supercritical ow in umes at two scales and also from the bow wave created by a towed wedge with a half angle equal to the de ecting angle of the stationary plate in the ume. The contact line was measured using free-surface probes in the small and large ume experiments, and the bow wave pro le was measured in the towing tank and large ume experiments using videos. These experimental results and those of Ogilvie (1972) were compared and demonstrate that the ume experiments with a depth equal to the draft produce bow waves similar to towing tank experiments with nite draft and essentially in nite depth for the same Froude number, F. The bow wave ow is highly nonlinear, and there appears, at present, to be no satisfactory analytical solution to this ow. The experimental data describing the bow wave shape scales with U 2 d 1=2 in the vertical direction and with U 2 d ƒ3=2 in the direction along the plate. This does not agree with any theoretical scaling reported in the literature. Scaling with geometric parameters such as bow half angle and dihedral angle were investigated using contact line data, and it was found that the wave is only weakly dependent on dihedral angle and depends on the bow half-angle according to a relationship which is close to linear. Surface disturbances with crests oriented in the cross-stream direction were observed on the plunging face of the bow wave in both the ume and the towing tank experiments. In the large ume experiment, the disturbances appear to be related to water surface oscillations on the de ecting plate. The disturbances had wavelengths which ranged from 7 cm to 16 cm. They were convected downstream with the ow velocity in the direction of the de ecting plate, and had a frequency of about 22 Hz as determined using three different experimental techniques. The disturbances are likely gravity waves on the surface of the bow wave. They grow in amplitude as the plunging jet stretches toward the free surface, and seem ultimately responsible for the breakup JOURNAL OF SHIP RESEARCH
of the jet into strings of droplets and for the periodic nature of the bubble clouds produced by the wave breaking process. The correlation between the surface disturbances and the bubble clouds is discussed in a companion paper (Waniewski et al 2001).
Acknowledgments The authors wish to acknowledge undergraduate student Don Kwak for his assistance with the ume experiments. They also acknowledge Rod Barr, Bob Kowalyshyn, and Jim McGurrin of Hydronautics Research for their assistance with the towing tank experiments. In addition, they are grateful for the support of the Of ce of Naval Research under grant number N00014-94-1-1210, technical monitor Dr. Edwin Rood.
References Ba l dy, S. 1993 A generation-dispersion model of ambient and transient bubbles in the close vicinity of breaking waves. Journal of Geophysical Research, 98, C10, 18277–18293. Ca r r ica , P., Bon et t o, F., Dr ew, D., a n d Lah ey, R., Jr . 1998 A polydisperse approach to the two-phase ow around a ship. Third International Conference on Multiphase Flow, Lyon, France, June. Don g, R., Kat z , J., a n d Hua n g, T. 1997 On the structure of bow waves on a ship model. Journal of Fluid Mechanics, 346, 77–115. Fon t a in e, E. a n d Coin t e, R. 1997 A slender body approach to nonlinear bow waves. Phil. Trans. R. Soc. London A, 355, 565–574.
MARCH 2002
Fon t a in e, E. a n d Fa l t in sen, O. 1997 Steady ow near a wedge shaped bow. 12th International Workshop on Water Waves and Floating Bodies, Marseille, 75–79. Fon t a in e, E. a n d Tu l in, M. 1998 On the prediction of nonlinear freesurface ows past slender hulls using 2d C t theory: the evolution of an idea. Symposium NATO/AVT on Fluid Dynamics problems of vehicles operating near or in the air sea interface, Amsterdam, 26.1–26.10. Joo, S., Sch u l t z , W., a n d Messit er , A. 1990 An analysis of the initialvalue wavemaker problem. Journal of Fluid Mechanics, 214, 161–183. Lon gu et -Higgins, M. 1995 On the disintegration of the jet in a plunging breaker. Journal of Physical Oceanography, 25, 10, 2458–2462. Miyat a , H. a n d In u i, T. 1984 Non-linear ship waves. Advances in Applied Mechanics, 24, 215–288. Nobl esse, F. 1983 A slender-ship theory of wave resistance. Jou r na l of Ship Resea r ch , 27, 1, 13–33. Nobl esse, F., Hen dr ix, D., a n d Ka h n, L. 1991 Nonlinear local analysis of steady ow about a ship. Jour n a l of Sh ip Resea r ch , 35, 4, 288–294. Ogil vie, F. 1972 The wave generated by a ne ship bow. 9th Symposium on Naval Hydrodynamics, 1483–1524. Pel t z er , R. 1984 White-water wake characteristics of surface vessels. NRL Memorandum Report 5335. Naval Research Laboratory, Washington, DC, June. Sh r off, S. a n d Liepma n n, D. 1997 Spray generation over curved surfaces. ASME Fluids Engineering Division, June. Tu l in, M. a n d Waseda , T. 1999 Laboratory observations of wave group evolution, including breaking effects. Journal of Fluid Mechanics, 378, 197–232. Wan iewski, T. 1999 Air entrainment by bow waves. Doctoral dissertation, California Institute of Technology, Pasadena, California. Wan iewski, T., Br en n en, C., a n d Ra ich l en, F. 2001 Measurements of air entrainment by bow waves. Journal of Fluids Engineering, 123, 57–63.
JOURNAL OF SHIP RESEARCH
15