448
J Neurol Neurosurg Psychiatry 2001;71:448–454
Brain temperature, body core temperature, and intracranial pressure in acute cerebral damage S Rossi, E Roncati Zanier, I Mauri, A Columbo, N Stocchetti
Department of Anesthesia and Intensive Care, Ospedale Maggiore Policlinico IRCCS, Milano, Italy S Rossi E Roncati Zanier I Mauri A Columbo N Stocchetti Correspondence to: N Stocchetti, Terapia Intensiva Neuroscienze, Servizio Anestesia e Rianimazione, Ospedale Maggiore Policlinico IRCCS Via F Sforza, 3520122 Milano, Milano 19-07-01
[email protected] Received 9 October 2000 and in revised form 18 April 2001 Accepted 20 May 2001
Abstract Objectives—To assess the frequency of hyperthermia in a population of acute neurosurgical patients; to assess the relation between brain temperature (ICT) and core temperature (Tc); to investigate the eVect of changes in brain temperature on intracranial pressure (ICP). Methods—The study involved 20 patients (10 severe head injury, eight subarachnoid haemorrhage, two neoplasms) with median Glasgow coma score (GCS) 6. ICP and ICT were monitored by an intraventricular catheter coupled with a thermistor. Internal Tc was measured in the pulmonary artery by a Swan-Ganz catheter. Results—Mean ICT was 38.4 (SD 0.8) and mean Tc 38.1 (SD 0.8)°C; 73% of ICT and 57.5% of Tc measurements were >38°C. The mean diVerence between ICT and Tc was 0.3 (SD 0.3)°C (range −0.7 to 2.3°C) (p=0. 0001). Only in 12% of patients was Tc higher than ICT. The main reason for the diVerences between ICT and Tc was body core temperature: the diVerence between ICT and Tc increased significantly with body core temperature and fell significantly when this was lowered. The mean gradient between ICT and Tc was 0.16 (SD 0.31)°C before febrile episodes (ICT being higher than Tc), and 0.41 (SD 0.38)°C at the febrile peak (p25 mm Hg after that were considered as thresholds for treatment. Treatment included sedation, CSF drainage, mild or moderate hyperventilation, and mannitol. In cases of refractory intracranial hypertension barbiturates or surgical decompression were considered. In patients with SAH ventriculostomy was performed to treat acute hydrocephalus. In these patients CSF was drained for 50 minutes/hour and ICP was recorded for the remaining 10 minutes. In two patients with tumours the ventricular catheter was placed to control intracranial hypertension by CSF drainage. In 15 patients the internal jugular bulb was cannulated, in 10 of them by a 4F catheter for intermittent determination of oxyhaemoglobin saturation in the jugular vein (SjO2). In five patients SjO2 was continuously monitored by a fibreoptic catheter (Abbott Oximetric). The correct position of the tip of the catheters was checked radiologically. When hyperventilation
Summary data of temperatures and discrepancies between intracranial temperature (ICT) and core temperature (Tc)
Patient
Catheter position
Count of measures
ICT mean (SD)
ICT max
Tc mean (SD)
Tc max
ICT-Tc mean (SD) ICT-Tc min
ICT-Tc max
1 2 3 4 5 6 7 8 9 10 11 12 13 14 15 16 17 18 19 20
Ventricular Ventricular Ventricular Ventricular Ventricular Ventricular Ventricular Parenchymal Ventricular Ventricular Ventricular Ventricular Ventricular Ventricular Ventricular Parenchymal Parenchymal Ventricular Ventricular Ventricular
185 102 108 94 183 196 117 140 157 60 106 244 70 139 94 49 60 126 106 141
38.46 (0.48) 38.09 (0.79) 38.96 (0.45) 38.75 (0.56) 39.46 (0.88) 37.42 (0.67) 38.05 (0.40) 38.62 (0.76) 38.40 (0.74) 38.60 (0.69) 38.53 (0.55) 38.57 (0.49) 38.29 (0.47) 38.19 (0.37) 38.69 (0.36) 37.05 (0.52) 38.56 (0.52) 37.6 (0.5) 39.27 (0.76) 38.06 (0.43)
39.4 39.8 39.9 39.8 41.2 38.9 38.8 40.4 39.9 40.0 40.0 39.4 39.5 39.2 39.7 38.2 39.4 39.2 41.1 39.3
37.91 (0.47) 37.34 (0.71) 38.35 (0.5) 38.49 (0.58) 39.20 (0.81) 37.14 (0.74) 37.84 (0.47) 38.45 (0.66) 38.00 (0.65) 38.00 (0.60) 38.41 (0.76) 38.10 (0.44) 37.82 (0.43) 37.93 (0.40) 38.05 (0.61) 36.48 (0.65) 38.70 (0.59) 37.59 (0.45) 39.10 (0.73) 38.00 (0.42)
38.9 38.9 39.5 39.9 40.9 38.5 38.7 39.9 39.2 39.4 39.5 38.9 38.8 39.1 39.4 38.4 39.6 38.8 41 39
0.48 (0.13) 0.45 (0.17) 0.55 (0.27) 0.26 (0.37) 0.27 (0.22) 0.39 (0.14) 0.21 (0.21) −0.04 (0.17) 0.39 (0.24) 0.68 (0.50) 0.29 (0.52) 0.39 (0.15) 0.47 (0.18) 0.26 (0.13) 0.61 (0.47) 0.50 (0.23) −0.23 (0.13) 0.01 (0.25) 0.17 (0.28) 0.10 (0.18)
0.8 0.9 1.8 1.2 0.8 1.0 1.3 0.5 2.3 2 1.6 1.0 0.8 0.8 1.6 0.7 0 0.9 0.9 0.6
www.jnnp.com
−0.1 −0.2 0 −0.6 −0.7 0.2 −0.1 −0.5 0 −0.4 −0.6 0 −0.5 −0.7 −0.3 −0.6 −0.6 −0.5 −0.7 −0.5
450
Rossi, Roncati Zanier, Mauri, et al
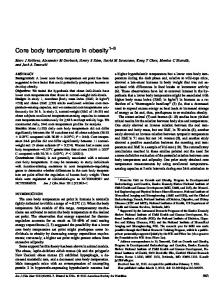
40
Mean ICT
A
Mean Tcore
40
39.5
39.5 39
°C
°C
39
38.5
38.5 38 37.5
38
37
37.5
1
2
3
4
5
6
7
8
9
10
11
12
3
5
7
9
11 13 15 17 19 21 23
Time (h)
Day
B 40
Time course of ICT and Tc.
was used to control ICP, it was set to preserve SjO2>55%. Haemodynamics were monitored using a Swan-Ganz catheter. None of the patients received antibiotic prophylaxis although antibiotics may have been used to treat diagnosed infections. Febrile episodes were treated at the physician’s discretion, using antipyretic drugs or physical therapy.
ICT Tcore
39.5 39
°C
Figure 1
1
13
38.5 38 37.5
1
3
5
7
9
TEMPERATURES
The ICT was continuously monitored by a silicone intraventricular catheter with a thermistor and a fibreoptic sensor for ICP (110–4HTM Camino Lab, San Diego, CA, USA). The system was screwed onto the skull using a bolt provided by the manufacturer; CSF could be withdrawn through the catheter. In three cases the catheter was positioned intraparenchymally, because of failure in cannulating the lateral ventricles. The catheter was placed in the operating room, under sterile conditions and its correct position was checked by CT at the end of the surgical procedure. Samples of CSF were collected every 2 days and before removal of the intraventricular catheter for cytochemical analysis and microbiological culture. Continuous measurements of Tc were taken using a Swan-Ganz catheter (Abbott Critical Care System), with a thermistor positioned 4 cm proximally to the tip. Once the monitoring was discontinued, the accuracy of the two temperature probes (intracranial and core) was checked by an in vitro test on eight intracranial probes and five pulmonary catheters. The test involved comparing the temperatures provided by the two thermistors with those measured by a precision thermometer (HD 9215, Delta OHM, Padova, Italy). The temperature sensors were immersed in a bath fitted with a thermostat to warm the fluid from 34°C to 45°C and then to cool it. Every 5 minutes the temperatures measured by the two sensors were simultaneously recorded. DATA COLLECTION AND STATISTICAL ANALYSIS
Intracranial pressure, MAP, and CPP were continuously recorded, sent to a computer through an analog-digital converter (Mac Lab Word Precision Instrument, New Haven, CT, USA) and stored for oV line analysis. The signals were analysed using software for Apple Macintosh (Chart 6.3). Temperatures were recorded hourly. Data were summarised as
www.jnnp.com
11 13 15 17 19 21 23
Time (h)
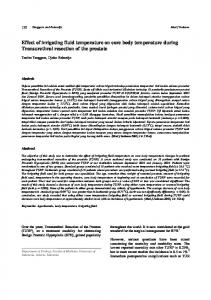
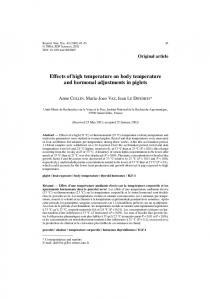
Figure 2 Behaviour of ICT and Tc in two patients: The first (A) with an intact skull, the second (B) with a large area of bone decompression.
means (SD). The paired t test was used to assess diVerences between groups. A value of p0.7°C) were identified, coinciding respectively with the onset or resolution of a febrile episode. In 119 cases the temperature rose, and in 121 it fell. The diVerence between ICT and Tc became significantly larger with the rise in body core temperature and dropped significantly when it fell. The mean diVerence between ICT and Tc was 0.16 (SD 0.31)°C before febrile episodes (ICT being higher than Tc), and 0.41 (SD 0.38)°C at the febrile peak (p