British Journal of Nutrition (2011), 105, 10–14 q The Authors 2010
doi:10.1017/S0007114510003193
Studies on absorption and metabolism of palatinose (isomaltulose) in rats Hidekazu Tonouchi1*, Taketo Yamaji1, Masayuki Uchida1, Megumi Koganei1, Akina Sasayama1, Tetsuo Kaneko1, Yoshihisa Urita2, Masahiro Okuno3, Kouji Suzuki3, Jun Kashimura3 and Hajime Sasaki1 1
Division of Research and Development, Food Science Institute, Meiji Dairies Corporation, 540 Naruda, Odawara, Kanagawa 250 0862, Japan 2 Department of General Medicine and Emergency Care, Toho University School of Medicine, 6-11-1 Omorinishi, Otaku, Tokyo 143 8541, Japan 3 Research Laboratory, Mitsui Sugar Company Limited, 1-2-14, Honson, Chigasaki-shi, Kanagawa 253 0042, Japan
British Journal of Nutrition
(Received 3 February 2010 – Revised 28 May 2010 – Accepted 21 July 2010 – First published online 1 September 2010)
Abstract We evaluated the absorption and metabolism of palatinose in rats by the carbohydrate load test and the 13C- and H2-breath tests. We compared the results of these tests with those of sucrose, since sucrose is an isomer of palatinose and generally known to be degraded and absorbed from the small intestine. In the carbohydrate load test, blood glucose and plasma insulin levels after oral administration of palatinose rose more gradually and reached a maximum that was lower than that after sucrose administration. In the 13C-breath test, rats were orally administrated [1-13C]sucrose or [1-13C]palatinose and housed in a chamber. The expired air in the chamber was collected, and the level of 13CO2 in the expired air was measured at appropriate intervals for 360 min. The value of time taken to reach the maximum concentration for expired 13CO2 from [1-13Cglucose ] ([1-13Cglc ]) and [1-13C fructose ] ([1-13Cfru ]) palatinose was significantly longer than that from [1-13Cglc ] and [1-13Cfru ]sucrose, respectively. The value of area under the curve (AUC) for [1-13Cglc ]palatinose was larger than that for [1-13Cglc ]sucrose, but AUC for [1-13Cfru ] showed no difference between palatinose and sucrose. In the H2-breath test, the concentration of H2 in the expired air was measured for 420 min. H2 was hardly detected with both palatinose and sucrose and no significant difference was observed between the two groups. These results suggest that palatinose is utilised in vivo at a rate equal to that of sucrose. Key words: Palatinose:
13
C-Breath test: H2-Breath test: Blood glucose
Palatinose (isomaltulose, 6-O-a-D -glucopyranosyl-D -fructose) is a sucrose isomer originally found in honey and sugarcane, where glucose and fructose are linked via a a-1,6-glycosidic bond (cf. sucrose via a-1,2). Palatinose can be produced by enzymatic modification of sucrose using micro-organisms. Palatinose produced by such a method is accepted as a generally recognised safe carbohydrate (GRAS notice no. GRN 000184). When ingested, palatinose is enzymatically hydrolysed into glucose and fructose in the small intestine at a considerably slower rate than sucrose(1). Because of the slower rate of its hydrolysation, the absorption of liberated glucose and fructose is delayed, resulting in a slower rate of increase and lower level of blood glucose(2,3). Such characteristics of palatinose suggest that this disaccharide is suitable for application to nutritive diets that require delayed absorption of glucose to prevent a rapid increase in postprandial blood glucose levels. However, in spite of its favourable characteristics, one question regarding its nutritional mechanism remains
unanswered: does palatinose fully digested and absorbed in the small intestine provide the amount of energy equivalent to that calculated based on the amount of ingested palatinose? If this question is adequately answered, palatinose will be regarded as a proper source of carbohydrate energy for nutrition in that it provides the necessary amount of energy and also prevents postprandial hyperglycaemia. In the present report, we present results principally obtained from an expiratory air analysis in rats, in which palatinose labelled with a non-radioactive isotope was applied. Based on the analysis of the results so obtained, we discuss the metabolic fate of ingested palatinose and present lines of evidence that palatinose can be fully digested and absorbed in the small intestine. Materials and methods Samples [1-13Cglucose] ([1-13Cglc ]) and [1-13Cfructose] ([1-13Cfru]) Sucrose were purchased from Omicron Biochemicals, Inc. (South
Abbreviations: 1-13Cfru, 1-13Cfructose; 1-13Cglc, 1-13Cglucose; AUC, area under the curve. * Corresponding author: H. Tonouchi, fax þ81 3 5653 0548, email
[email protected]
Absorption and metabolism of palatinose (a) Blood glucose (mg/l)
Bend, IN, USA). [1-13Cglc] and [1-13Cfru]palatinose were provided by Mitsui Sugar Company Limited (Tokyo, Japan). Unlabelled sucrose, palatinose and lactulose were purchased from Wako Pure Chemical Industries Limited (Tokyo, Japan). Distilled water was purchased from Ohtsuka Pharmaceutical Factory, Inc. (Tokushima, Japan). Animals
11
2000 1500
** *
*
** * **
1000 500
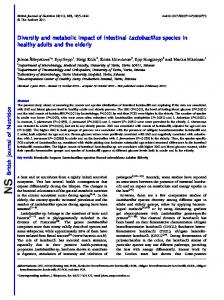
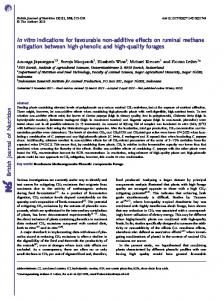
Blood glucose and plasma insulin levels After the rats were fasted, preload blood samples were obtained from the tail vein at 0 min, and then the rats were orally administered sucrose or palatinose at a dose of 2 g/kg in a volume of 10 ml/kg. Postload blood samples were obtained at 20, 40, 60, 90, 120, 180, 240, 300 and 360 min. Blood glucose was measured using Dexter ZII (Bayer Company Limited, Osaka, Japan). Plasma insulin was measured using an ELISA kit (Morinaga Institute of Biological Science, Inc., Kanagawa, Japan). Breath test system A schematic illustration of the system used for collecting expired air from Sprague –Dawley rats reported by Uchida et al.(4) is shown in Fig. 1. In brief, this system is composed of an animal chamber (desiccator; 2000 ml),
0
60
120
180
240
300
360
420
Time after administration (min)
Plasma insulin (pg/ml)
(b) 2500 2000 1500 1000
**
*
*
**
500 0
0
20
40
60
80
100
120
140
Time after administration (min) Fig. 2. Time course of blood glucose (a) and plasma insulin (b) response after a single oral administration of sucrose (W) or palatinose (X) in rats. Values are given as means and standard deviations represented by vertical bars (n 6). Mean values of palatinose were significantly different from those of sucrose: *P, 0·05, **P, 0·01.
pump (Masterflex L/S; Cole-Palmer Instrument Company, Barrington, IL, USA) and breath sampling bag (Ohtsuka Pharmaceutical Company Limited, Tokyo, Japan). The air in the chamber was continuously aspirated during the experimental period. The aspirated air was discharged outside this breath system except for the period collecting expired air in the breath sampling bag. 13
C-breath test
The rats were placed in the chamber immediately after the oral administration of [1-13C]sucrose or [1-13C]palatinose at a dose of 2 g/kg (mixture of 0·175 g of [1-13C]carbohydrate: 140 120 100
Master flex
80 60 40 20
Pump Animal chamber (desiccator) Volume: 2000 ml
∆ 13CO2 (‰)
British Journal of Nutrition
0
The experimental protocols were approved by the Animal Care Committee of the Division of Research and Development, Meiji Dairies Corporation. Six-week-old male Sprague– Dawley rats were purchased from Shizuoka Laboratory Animal Center (SLC, Shizuoka, Japan). The rats were housed in plastic cages on a cycle of 12 h light and 12 h darkness. Temperature and humidity in the cages were controlled at 22 ^ 38C and 55 (SD 15) %, respectively. The rats were fed ad libitum with a standard laboratory chow (CRF-1; Oriental Yeast Company Limited, Tokyo, Japan) and distilled water. The rats were fasted in meshed cages for 16 h to prevent coprophagy before each experiment, but had free access to drinking water.
0 Breath sampling bags
Fig. 1. Schematic illustration of the system used to collect expired air from rats. Briefly, this system composed of a desiccator that was used as an animal chamber, a pump and breath sampling bags. Aspirating the expired air caused fresh air to automatically flow into the desiccator to replace it through a hole in the side of the chamber(4).
–20 0
60
120
180
240
300
360
420
Time after administration (min) Fig. 3. Time course of D13CO2 in expired air from rats after a single oral administration of [1-13Cglucose] ([1-13Cglc]) sucrose (W) or [1-13Cglc] palatinose (X). Values are given as means and standard deviations represented by vertical bars (n 4).
12
H. Tonouchi et al. Table 1. Pharmacokinetics parameters after oral administration of [1-13Cglucose] ([1-13Cglc]) sucrose or [1-13Cglc]palatinose (Mean values and standard deviations, n 4) Cmax (‰)
13
glc
[1- C ]Sucrose [1-13Cglc]Palatinose
Tmax (min)
AUC (‰ min)
Mean
SD
P*
Mean
SD
P*
Mean
SD
P*
84 81
6 7
NS
93 195
13 17
, 0·01
21 791 24 617
2027 1046
, 0·05
1·825 g of unlabelled carbohydrate) in a volume of 10 ml/kg. The expired air was collected at 10 min intervals until 180 min and at 30 min intervals from 180 to 300 min with additional measurements at 360 min after the samples administration. The 13CO2 level in the breath sampling bag was measured with UBiT IR-300 (Ohtsuka Electronics Company Limited, Osaka, Japan). The measured values were presented as the D13CO2 (‰). The maximum 13CO2 concentration (‰), the time taken to reach the maximum concentration (min) and the area under the curve (AUC; ‰min) were calculated using the D13CO2 values. The AUC from the start of administration to the time when the speculated value of D13CO2 is zero was calculated using a software for pharmacokinetic, pharmacodynamic and non-compartment analysis (WinNonlinw, version 1.5; Pharsight Corp., Mountain View, CA, USA) by applying the linear trapezoidal rule. AUC reflects the absorption of labelled materials. Expired 13CO2 air was collected for 1·5 min each time. Ventilation volume was 150 ml/min. H2-breath test The rats were placed in the chamber immediately after the oral administration of the unlabelled sucrose, palatinose and lactulose at a dose of 2 g/kg in a volume of 10 ml/kg. The sample volume was 10 ml/kg. The expired air was collected at 120, 180, 240, 300, 360 and 420 min after the samples were administered. The H2 concentration in the breath sampling bag was measured using Breath Gas Analyzer TGA-2000 (Teramex Company Limited, Kyoto, Japan). Lactulose, an indigestible disaccharide, was used as a positive control. Expired H2 was collected for 1·5 min each time. Ventilation volume was 150 ml/min. Statistical analysis The results were represented as the means and standard deviations for the animals used. Statistical analysis was performed by Student’s t test, and values of P, 0·05 were regarded as significant.
palatinose. Basal glucose level in the palatinose and sucrose groups was 833 (SD 87) and 887 (SD 120) mg/l, respectively. When compared with the sucrose group, the blood glucose level in the palatinose group was significantly lower at 20, 40 and 60 min after administration, but significantly higher at 120, 240 and 360 min after administration. The time course of changes in plasma insulin level after the oral administration of sucrose or palatinose was also measured (Fig. 2(b)). When compared with the sucrose group, the plasma insulin level in the palatinose group was significantly lower at 20 and 40 min after administration, but significantly higher at 90 and 120 min after administration.
13
C-breath test
As shown in Fig. 3, D13CO2increased rapidly in the rats given [1-13Cglc ]sucrose and increased gradually after [1-13Cglc ] palatinose administration. The maximum 13CO2 concentration value showed no significant difference between the sucrose and palatinose groups, whereas the time taken to reach the maximum concentration value was long and the AUC value was high in the palatinose group compared with the sucrose group (Table 1). Fig. 4 shows D13CO2 in the rats given [1-13Cfru]sucrose or [1-13Cfru]palatinose. The time taken to reach the maximum concentration in the palatinose group was significantly 140 120 100 ∆13CO2 (‰)
British Journal of Nutrition
Cmax, maximum 13CO2 concentration; Tmax, time taken to reach the maximum concentration; AUC, area under the curve. * Mean values of palatinose were significantly different from the value of sucrose.
80 60 40 20 0 –20
Results Blood glucose and plasma insulin levels Fig. 2(a) shows the time course of changes in blood glucose levels after an oral administration of sucrose or
0
60
120
180
240
300
360
420
Time after administration (min) Fig. 4. Time course of D13CO2 in expired air from rats after a single oral administration of [1-13Cfructose] ([1-13Cfru]) sucrose (W) or [1-13Cfru] palatinose (X). Values are given as means and standard deviations represented by vertical bars (n 4).
Absorption and metabolism of palatinose
13
Table 2. Pharmacokinetics parameters after oral administration of [1-13Cfructose] ([1-13Cfru]) sucrose or [1-13Cfru]palatinose (Mean values and standard deviations, n 4) Cmax (‰)
13
fru
[1- C ]Sucrose [1-13Cfru]Palatinose
Tmax (min)
AUC (‰ min)
Mean
SD
P*
Mean
SD
P*
Mean
SD
P*
116 69
10 12
, 0·01
85 167
6 15
, 0·01
24 508 29 483
959 4232
NS
Cmax, maximum 13CO2 concentration; Tmax, time taken to reach the maximum concentration; AUC, area under the curve. * Mean values of palatinose were significantly different from the value of sucrose.
H2-breath test Changes in molecular H2 concentrations over time are shown in Fig. 5. H2 concentration increased gradually in the lactulose group. In the case of lactose intolerance, the definition of a positive test has varied but a rise of 10 –20 parts per million over basal values is usually considered to indicate malabsorption(5). According to this definition, the H2 concentration was significantly greater in the lactulose group compared with the concentration at baseline from 4 h and extending to the end of the experiment. On the other hand, we observed no increase in H2 over baseline both in the sucrose and palatinose groups during the experiment. There was no significant difference between the sucrose and palatinose groups. Discussion In 1983, Macdonald & Daniel(6) reported the bioavailability of palatinose in rats using [14C]palatinose and [14C]sucrose. They measured radioactivity excreted into faeces and urine and that expired into the air after the administration of labelled palatinose and sucrose. They found no significant difference between palatinose and sucrose, and they concluded that palatinose and sucrose were hydrolysed at comparable rates. In their study, however, the dosage of sucrose or palatinose was only 500 mg/kg body weight and the blood glucose levels after administration of these carbohydrates were not measured. In the present report, we first confirmed doses where palatinose and sucrose show clearly different glycaemic responses, then proceeded to analyse their bioavailabilities. Palatinose and sucrose showed comparable glycaemic responses at doses , 1 g/kg body weight, probably because palatinose and sucrose do not show glycaemic responses that are large enough to be compared against each other (data not shown). Therefore, we needed to identify the doses at which palatinose can clearly show a
lower glycaemic response compared with sucrose. To do so, we used the dose of 2 g/kg body weight. When the dose of 2 g/kg body weight was administered, significant differences were observed in the levels of plasma glucose and insulin between the palatinose and sucrose groups. After 120 min, the blood glucose of the palatinose group was higher than that of the sucrose group. The rate of hydrolysis in the small intestine of palatinose is very slow compared with sucrose and the characteristic contributes to the transition of blood glucose. When expired 13CO2 was measured in the animals administered either labelled palatinose or sucrose at this dose, a significant delay in time taken to reach the maximum concentration was observed in the palatinose group. The delay was observed irrespective of the difference in labelled positions in palatinose, [1-13Cglc] or [1-13Cfru]. These data evidently show that palatinose is hydrolysed in the intestine at a lower rate than sucrose, and therefore coincidentally absorbed at a lower rate than sucrose. Of note, the rate of hydrolysis of palatinose by brush-border membrane preparations from rat jejunum was actually measured and was 11–12 % as compared with the rate towards sucrose(7). When the values of AUC were compared, a significant difference was observed between the [1-13Cglc]palatinose group, and the [1-13Cglc]sucrose group; the AUC of the palatinose group was significantly larger than that of the sucrose group. One possible explanation is that palatinose is not only hydrolysed and absorbed more slowly than sucrose but it might also be oxidised in a pathway different 50 H2 (parts per million)
British Journal of Nutrition
longer than that in the sucrose group as seen in the [1-13Cglc] examination. On the other hand, the maximum 13 CO2 concentration value in the palatinose group was significantly lower than that in the sucrose group and the AUC value in the palatinose group was not significantly different from that in the sucrose group (Table 2).
40 30 20 10 0
0
60
120
180
240
300
360
420
480
Time after administration (min) Fig. 5. Time course of H2 in expired air from rats after a single oral administration of sucrose (W) or palatinose (X) or lactulose (K). Values are given as means and standard deviations represented by vertical bars (n 4).
British Journal of Nutrition
14
H. Tonouchi et al.
from that of sucrose, resulting in the production of more labelled CO2. Such speculation is supported by the fact that significantly different levels of insulin secretion were observed between the two groups; in fact, insulin affects the metabolism of carbohydrates and lipids(8,9). On the one hand, insulin stimulates the pathway of glycogen synthesis in hepatocytes(10) that do not generate CO2. On the other hand, insulin enhances the activity of lipogenic enzymes such as acetyl-CoA carboxylase and fatty acid synthase in rat hepatocytes(11). There is a possibility that glucose of sucrose origin is easy to use for fatty acid synthesis compared with glucose of palatinose origin. In fatty acid synthesis, [1-13C]glucose and [1-13C] fructose do not become the substrate of labelled CO2. There was a significant difference in the values for maximum 13CO2 concentration between the fructose-labelled palatinose and sucrose; however, no such difference was seen between the glucose-labelled ones. These data evidently indicate that fructose derived from palatinose and that from sucrose are metabolised in different pathways. This difference might also be explained by the different levels of insulin secretion. Fructose uptake into cells is not affected by insulin levels, whereas its metabolism in the glycolysis pathway is regulated by insulin(12). Consequently, for the glucose and fructose of palatinose origin, the metabolism after absorption from the small intestine is different from the glucose and fructose of sucrose origin. The initial level of the insulin secretion might take part in it. Carbohydrates, if not absorbed in the small intestine, are transferred into the colon, where they are utilised for fermentation by enterobacteria. Colonic carbohydrate fermentation produces molecules such as H2, CH4 and SCFA(13). The H2 produced in fermentation is absorbed and expired into the air. Therefore, the transfer of carbohydrates into the colon can be assessed by the detection of H2 in expired air. As shown in Fig. 5, the administration of lactulose, a disaccharide indigestible in the small intestine, produced a significant amount of H2 in the expired air. Contrarily, when rats were administered palatinose or sucrose, levels of H2 in the expired air stayed well below 10 parts per million, the level of H2 above which carbohydrate malabsorption in the small intestine is diagnosed(5), for 7 h, a period that is long enough for unabsorbed carbohydrates to pass through into the colon. These results indicate that palatinose is fully hydrolysed and absorbed in the small intestine as well as sucrose is, even if their metabolic pathways are different.
Acknowledgements [1-13Cglc] and [1-13Cfru]palatinose were provided by Mitsui Sugar Company, Limited (Tokyo, Japan). H. T. participated in data collection, data analysis, data interpretation and manuscript preparation. T. Y., M. U., Y. U. and H. S. participated in study design, data interpretation and review of the manuscript. M. K. and A. S. participated in data collection and data analysis. T. K., M. O., K. S. and J. K. participated in data interpretation and review of the manuscript. There are no conflicts of interest.
References 1.
2.
3.
4.
5. 6. 7.
8.
9. 10.
11.
12.
13.
Lina BAR, Jonker D & Kozianowski G (2002) Isomaltulose (palatinose): a review of biological and toxicological studies. Food Chem Toxicol 40, 1375 – 1381. Kawai K, Okuda Y & Yamashita K (1985) Changes in blood glucose and insulin after an oral palatinose administration in normal subjects. Endocrinol Jpn 32, 933–936. Kawai K, Yoshikawa H, Murayama Y, et al. (1989) Usefulness of palatinose as a caloric sweetener for diabetic patients. Horm Metab Res 21, 338– 340. Uchida M, Endo N & Shimizu K (2005) Simple and noninvasive breath test using 13C-acetic acid to evaluate gastric emptying in conscious rats and its validation by matoclopramide. J Pharmacol Sci 98, 388–395. Simren M & Stotzer P-O (2006) Use and abuse of hydrogen breath tests. Gut 55, 297–303. Macdonald I & Daniel JW (1983) The bio-availability of isomaltulose in man and rat. Nutr Rep Int 28, 1083 – 1090. Tsuji Y, Yamada K, Hosoya N, et al. (1986) Digestion and absorption of sugars and sugar substitutes in rat small intestine. J Nutr Sci Vitaminol 32, 93– 100. Cherrington AD, Moore MC, Sindelar DK, et al. (2007) Insulin action on the liver in vivo. Biochem Soc Trans 35, 1171 –1174. Holland WL, Knotts TA, Chavez JA, et al. (2007) Lipid mediators of insulin resistance. Nutr Rev 65, S39 – S46. Aiston S, Coghlan MP & Agius L (2003) Inactivation of phosphorylase is a major component of the mechanism by which insulin stimulates hepatic glycogen synthesis. Eur J Biochem 270, 2773 – 2781. Fukuda H, Katsurada A & Iritani N (1992) Nutritional and hormonal regulation of mRNA levels of lipogenic enzymes in primary cultures of rat hepatocytes. J Biochem 111, 25– 30. Ito J, Kuzumaki T, Otsu K, et al. (1998) Hormonal regulation of aldolase B gene expression in rat primary cultured hepatocytes. Arch Biochem Biophys 350, 291– 297. Chinda D, Nakaji S, Fukuda S, et al. (2004) The fermentation of different dietary fibers is associated with fecal clostridia levels in men. J Nutr 134, 1881 – 1886.