British Journal of Nutrition (2014), 112, 15–29 q The Authors 2014
doi:10.1017/S0007114514000610
Effects of dietary microencapsulated sodium butyrate on growth, intestinal mucosal morphology, immune response and adhesive bacteria in juvenile common carp (Cyprinus carpio) pre-fed with or without oxidised oil Wenshu Liu1†, Yanou Yang2†, Jianli Zhang2, Delbert M. Gatlin3*, Einar Ringø4 and Zhigang Zhou1* 1
Key Laboratory for Feed Biotechnology of the Ministry of Agriculture, Feed Research Institute, Chinese Academy of Agricultural Sciences, No. 12 Zhongguancun South Street, Beijing 100081, People’s Republic of China 2 Science of Animal and Technology College, Anhui Agricultural University, Hefei 230036, People’s Republic of China 3 Department of Wildlife and Fisheries Sciences, Texas A&M University System, College Station, TX 77843-2258, USA 4 Norwegian College of Fishery Science, Faculty of Biosciences, Fisheries and Economics, University of Tromsø, Tromsø, Norway
British Journal of Nutrition
(Submitted 23 May 2013 – Final revision received 13 January 2014 – Accepted 17 February 2014 – First published online 28 April 2014)
Abstract The aim of the present study was to investigate the effects of different dietary sustained-release microencapsulated sodium butyrate (MSB) products (0 (non-supplement), 1·5 and 3·0 h) for a control or oxidised soyabean oil (SBO) diet on fish production, intestinal mucosal condition, immunity and intestinal bacteria in juvenile common carp (Cyprinus carpio). Dietary MSB increased weight gain and reduced the feed conversion ratio within the control and oxidised SBO groups. Gut mucosa was damaged in the oxidised SBO group fed without MSB, in contrast to a normal appearance found in fish fed the MSB1·5 and MSB3·0 diets in the oxidised SBO group. Microvillus density increased in fish fed the MSB1·5 and MSB3·0 diets in the oxidised SBO group (P,0·001); however, microvillus density was affected by the different pre-fed diets in the midgut (P,0·001) and by the different sustained-release times of MSB in the distal gut (DG) (P¼0·003). The interaction between the pre-fed diets and the sustained-release times of dietary MSB was significant for the relative gene expression levels of gut heat shock protein-70 (HSP70), pro-inflammatory cytokines (IL-1b and TNF-a) and anti-inflammatory cytokines (transforming growth factor-b) within each gut segment, except for HSP70 in the DG and IL-1b in the foregut. Modulation of adherent bacterial communities within each gut segment investigated was not obvious when the common carp were fed the diets with MSB, as similarity coefficients of .0·79 were observed. These results indicated that MSB can be used as a dietary supplement to repair or prevent intestinal damage in carp fed oxidised SBO. Key words: Cyprinus carpio: Microencapsulated sodium butyrate: Oxidised soyabean oil: Intestine
The use of antibiotics as growth promoters is a subject of debate in animal production as well as in feed and food industries. Their application in animal feed creates the possibility of building resistance to antibiotics used against bacterial pathogens in animals and humans(1,2) as well as in fish(3). In 2006, the European Union banned the use of antibiotics in animal feed as growth promoters (European Parliament and Council Regulation no. 1831/2003). Another issue of concern with fish diets is that lipids are rapidly oxidised during storage
due to the high content of PUFA, even though synthetic antioxidants such as butylated hydroxyanisole, butylated hydroxytoluene and tert-butyl hydroquinone are supplemented. Furthermore, some plant extracts are used as feed additives in many countries to retard or prevent oxidative deterioration of oil(4). The products of lipid oxidation such as SCFA, aldehydes and ketones do not only decrease the nutritive value of the feed but also react with cellular membrane components such as protein and DNA(5). Several studies have reported
Abbreviations: C-0, basal diet followed by basal diet; C-1·5, basal diet followed by basal diet containing MSB1·5; C-3·0, basal diet followed by basal diet containing MSB3·0; DG, distal gut; DGGE, denaturing gradient gel electrophoresis; FCR, feed conversion ratio; FG, foregut; HSP70, heat shock protein; MG, midgut; MSB, microencapsulated sodium butyrate; Oxi-0, oxidised soyabean oil supplement followed by basal diet; Oxi-1·5, oxidised soyabean oil supplement followed by basal diet containing MSB1·5; Oxi-3·0, oxidised soyabean oil supplement followed by basal diet containing MSB3·0; qPCR, quantitative RT-PCR; SBO, soyabean oil; TGF, transforming growth factor; WG, weight gain. * Corresponding authors: D. M. Gatlin, email
[email protected]; Z. Zhou, fax þ86 10 82106054, email
[email protected] † Both authors contributed equally to this work.
British Journal of Nutrition
16
W. Liu et al.
undesirable effects of feeding oxidised oil in fish, such as Atlantic salmon (Salmo salar), catfish (Clarias gariepinus), Atlantic cod (Gadus morhua) and Japanese sea bass (Lateolabrax japonicas)(6 – 11). Thus, it is imperative to define alternative dietary strategies to support aquaculture productivity. One promising group of feed additives is organic acids, which are low-molecularweight aldehyde-containing compounds with one or more carboxyl groups(12). During the last two decades, the scientific community has carefully examined the roles and effects of organic acids and their salts on animal production. To our knowledge, the first study in aquaculture evaluating the effects of dietary lactate, acetate and propionate supplementation on growth, composition of the digesta and chemical composition has been carried out by Ringø(13,14) and Ringø et al.(15). Since then, several studies have addressed the effects of organic acids and their salts on feed digestibility, growth, immune response and gut microbiota in aquaculture species(16 – 20). Butyric acid and butyrate have been shown to provide energy for epithelial growth(21) and influence a wide array of cellular functions relevant to gut health such as inhibition of inflammation and carcinogenesis, reinforcement of various components of the colonic defence barrier and reduction of oxidative stress(22). Based on these findings, butyric acid and butyrate may exert a positive effect on the gut. To our knowledge, information regarding the effects of butyric acid and butyrate on the common carp (Cyprinus carpio) is lacking. Furthermore, no information is available on the effects of butyric acid and butyrate on fish after feeding oxidised oil that may induce stress and gut damage. Accordingly, the objectives of the present study were to investigate the effects of two types of microencapsulated sodium butyrate products (1·5 h (MSB1·5) and 3·0 h (MSB3·0) sustained release)
on (1) growth performance, (2) intestinal mucosal morphology, (3) intestinal immune response and (4) modulation of intestinal adherent (autochthonous) bacterial communities in the common carp when pre-fed a control diet or a oxidised soyabean oil (SBO) diet for 2 weeks followed by the supplementation of MSB diets for 8 weeks. The experiment was designed as a 2 £ 3 factorial with two pre-fed treatments (control v. oxidised SBO) and three different sustained-release times of MSB (0 (non-supplement) v. 1·5 and 3·0 h). Due to the short gastrointestinal emptying time in the common carp(23), we put forward the hypothesis that the MSB1·5-supplemented diet could be highly efficient in preventing or repairing pre-fed oxidised SBO-induced stress and gut damage in the fish. Heat shock protein (HSP)-70 was chosen as a stress marker because HSP70 expression has been reported to be related to stressful conditions in aquaculture, such as temperature oscillations, crowding, insufficient water quality and improper diet(24). Pro-inflammatory cytokines, including IL-1b and TNF-a, and the anti-inflammatory cytokine transforming growth factor-b (TGF-b) have been commonly used as the reference genes in the studies of immune regulation(25,26).
Materials and methods Diets Table 1 presents the formulation and chemical compositions of the basal (control) and experimental diets. Oxidised SBO (2 %) was prepared according to the method described by Ren et al.(27). Briefly, Fe3þ (30 mg/kg), Cu2þ (15 mg/kg) and H2O2 (600 mg/kg) were added to commercially produced SBO (Jinlongyu) bought from a supermarket. The mixture was stirred at 37 ^ 18C for 48 h. Peroxide values including,
Table 1. Formulation and chemical compositions of the basal and experimental diets (%)* Ingredients Fishmeal Soyabean meal Rapeseed meal Maize gluten meal Cottonseed meal Coated lysine Coated methionine Wheat flour Soyabean oil Oxidised SBO Vitamin C phosphate ester Vitamin premix 1 Mineral premix 2 Ca(H2PO4)2 Zeolite powder Starch Moisture Chemical composition (DM basis) Crude Crude lipid Ash Crude fibre N-free extract
Basal diet
Oxidised SBO diet
C-0
C-1·5
C-3·0
Oxi-0
Oxi-1·5
Oxi-3·0
12·0 32·0 7·25 2·92 8·00 0·87 0·26 24·9 6·00 0·00 0·10 0·50 1·00 2·20 2·00 2·00 10·2
12·0 32·0 7·25 2·92 8·00 0·87 0·26 24·9 4·00 2·00 0·10 0·50 1·00 2·20 2·00 2·00 10·2
12·0 32·0 7·25 2·92 8·00 0·87 0·26 24·9 4·00 0·00 0·10 0·50 1·00 2·20 2·00 2·00 10·2
12·0 32·0 7·25 2·92 8·00 0·87 0·26 24·9 4·00 0·00 0·10 0·50 1·00 2·20 2·00 2·00 10·2
12·0 32·0 7·25 2·92 8·00 0·87 0·26 24·9 4·00 0·00 0·10 0·50 1·00 2·20 2·00 2·00 10·3
12·0 32·0 7·25 2·92 8·00 0·87 0·26 24·9 4·00 0·00 0·10 0·50 1·00 2·20 2·00 2·00 10·2
12·0 32·0 7·25 2·92 8·00 0·87 0·26 24·9 4·00 0·00 0·10 0·50 1·00 2·20 2·00 2·00 10·1
12·0 32·0 7·25 2·92 8·00 0·87 0·26 24·9 4·00 0·00 0·10 0·50 1·00 2·20 2·00 2·00 10·3
35·6 6·07 10·2 3·50 34·4
35·5 6·09 10·2 3·47 34·5
35·6 6·07 10·2 3·50 34·4
35·7 6·12 10·2 3·60 34·2
35·4 6·01 10·1 3·53 34·7
35·4 6·10 10·1 3·61 34·6
35·7 5·96 10·2 3·45 34·6
35·8 5·92 10·3 3·68 34·0
SBO, soyabean oil. * See Table 2 for details of the treatments C-0, C-1·5, C-3·0, Oxi-0, Oxi-1·5 and Oxi-3·0.
Carp and dietary sodium butyrate
the sample were withdrawn and immediately replaced with an identical volume of fresh water. Thereafter, the concentration of sodium butyrate in each sample solution was determined. The control diet was prepared for comparison.
100
Dissolution rate (%)
90 80 70 60
Fish husbandry
50 40
Juvenile common carp were obtained from an aquaculture farm in Foshan City, Guangdong Province, China. Fish were acclimatised to the experimental tanks (60·0 £ 60·0 £ 80·0 cm) in a recirculating aquaculture system for 2 weeks at Anhui Agricultural University (Hefei City, Anhui Province, China) before the feeding trial. Experimental design and treatments are described in Table 2. A total of twenty-four tanks of six treatments (C-0, C-1·5, C-3·0, Oxi-0, Oxi-1·5 and Oxi-3·0) with four replicate tanks per treatment were used. Each tank contained twenty fish of uniform size (6·22 (SE 0·03) g). Each treatment was randomly assigned to four tanks. The feeding trial was carried out in two stages. The first stage lasted for 2 weeks during which the fish in the treatments C-0, C-1·5 and C-3·0 were fed the control diet, and those in the treatments Oxi-0, Oxi-1·5 and Oxi-3·0 were fed a diet supplemented with oxidised SBO. From week 3 to 10, the fish in the treatments C-0, C-1·5 and C-3·0 were fed the control, MSB1·5 and MSB3·0 diets, respectively, as were those in the treatments Oxi-0, Oxi-1·5 and Oxi-3·0. The fish were fed to apparent satiation twice per day (09.00 and 15.00 hours), and the feeding rate was approximately 3 % at the beginning of the trial and thereafter adjusted weekly by weighing all fish in one tank per treatment. Water quality parameters including pH (6·6– 7·1), dissolved oxygen (. 6·05 mg O/l), temperature (25·0 ^ 0·8 8C) and nitrate (, 0·11 mg N/l) were monitored each day.
30 20 10 0 0
10
30
45
60
90
120
150
180
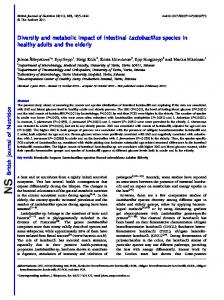
Time (min) Fig. 1. Dissolution rates of the two types of sustained-release microencapsulated sodium butyrate products (1·5 h ( ) and 3·0 h ( ) sustained release).
British Journal of Nutrition
17
acid-, iodine- and thiobarbituric acid-reactive substance values, of the oil were determined as described elsewhere(28). The respective values for fresh and oxidised SBO were as follows: acid value, 1·84 (SE 0·21) v. 3·46 (SE 0·28) mg KOH/g; iodine value, 137 (SE 14·3) v. 148 (SE 10·6) 0·01 g I/g; thiobarbituric acid-reactive substance value, 19·6 (SE 3·54) v. 2018 (SE 148) mg malonaldehyde/kg. All ingredients that were ground into fine powder through a 200 mm mesh were thoroughly mixed with SBO, and an appropriate volume of water was added to produce a stiff dough. The dough was then pelleted with an experimental feed processing machine (Changxing Machine Factory) and air-dried for 24 h at room temperature. Thereafter, the pellets were smashed into pieces, and then proper particles were collected by sieving and stored at 2208C until further use. During the subsequent 8 weeks, two different sustainedrelease types of MSB products (MSB1·5 and MSB3·0; Hangzhou King Techina Feed Company Limited) were prepared as feed supplements at a dose of 300 mg/kg basal diet (based on a preliminary test) and administered to the fish that were pre-fed with either a control or an oxidised SBO diet for 2 weeks, which has previously been reported to induce intestinal stress and mucosal morphology damage in the common carp(27,29). The dissolution rate of MSB along with the reaction time was measured using a dissolution test and HPLC (Fig. 1). Briefly, MSB (1 g) was added into 200 ml water at room temperature, and at the scheduled time durations (15, 30, 45, 60, 90, 120, 150 and 180 min), 20 ml of
Growth performance, body index, hepatosomatic index and intestinal index of weight At the end of week 2, all the fish were weighed in batch. Thereafter, at the end of the 10-week feeding trial, all the fish were weighed in batch and fourteen randomly sampled fish from each treatment group were anaesthetised with MS-222 (50·0 mg/l) and measured individually, weighed and dissected, and the intestine and liver were sampled. The intestine was gently agitated three times in PBS (pH 7·2) for 1 min to remove the digesta, and then weighed and separated into the following three segments: foregut (FG); midgut (MG);
Table 2. Experimental treatments as well as feeding regimens Feeding regimen Treatment
Baseline to week 2
Week 3 to week 10
C-0 C-1·5 C-3·0 Oxi-0 Oxi-1·5 Oxi-3·0
Basal diet Basal diet Basal diet Oxidised soyabean oil supplement Oxidised soyabean oil supplement Oxidised soyabean oil supplement
Basal Basal Basal Basal Basal Basal
MSB, microencapsulated sodium butyrate.
diet diet diet diet diet diet
containing MSB1·5 (300 mg/kg) containing MSB3·0 (300 mg/kg) containing MSB1·5 (300 mg/kg) containing MSB3·0 (300 mg/kg)
18
W. Liu et al.
distal gut (DG). The intestinal segments were divided as described elsewhere(30). Survival rate (SR), weight gain (WG), specific growth rate (SGR), feed conversion ratio (FCR), body index (BI), hepatosomatic index (HSI) and intestinal index of weight (WII) were calculated as follows: SR ð%Þ ¼ ðno: of fish counted=no: of stocked fishÞ £ 100; WG ð%Þ ¼
SGR ð%=dÞ ¼
final weight ðgÞ 2 initial weight ðgÞ £ 100; initial weight ðgÞ
ln final weight ðgÞ 2 ln initial weight ðgÞ £ 100; days
British Journal of Nutrition
FCR ¼ ðtotal feed consumption ðtotal feed casting 2 total food residueÞ ðgÞÞ=ðtotal final weight ðgÞ 2 total initial weight ðgÞ þ total mortality weight ðgÞÞ £ 100; BI ¼ ðbody weight ðgÞÞ=ðbody length ðcmÞ £ body height ðcmÞ £ body thickness ðcmÞ £ 1000Þ; HSI ¼
hepatopancreas weight ðgÞ £ 100; body weight ðgÞ
WII ¼
intestinal weight ðgÞ £ 100: body weight ðgÞ
The experimental protocol was performed in accordance to the guidelines approved by the Animal Ethics Committee of the Feed Research Institute, Chinese Academy of Agricultural Sciences (2012-ZZG-ZF-001).
Intestinal mucosal morphology The processing of intestinal segments for scanning electron microscopy was carried out as described elsewhere(31). Briefly, one segment of the FG, MG and DG of each sampled fish (n 3 fish per treatment) was fixed with 2·5 % glutaraldehyde. The segments were washed twice in phosphate buffer
(pH 7·2) and then post-fixed in OsO4 (1 % in phosphate buffer, pH 7·2, 2 h). After a series of dehydration steps in alcohol from 30 to 100 %, the segments were critical-point dried (CPD030; BAL-TEC), mounted on Al stubs, sputter-coated with gold by using a high-resolution fine coater (SCD005; BAL-TEC), and then examined under a Jeol JSM-6301 scanning microscope (JEOL). The appearance of the intestinal mucosal and microvillus morphology was observed. Scanning electron microscopic images ( £ 20 magnification) were analysed to measure the microvillus density on the enterocytes.
Intestinal immune responses Gene expression of cytokines was assessed from the same intestinal segment from three fish in each treatment group. Total RNA from three segments was extracted using TRIzol reagent (Promega), and RNA quality was analysed by agarose gel (1·2 %) electrophoresis. RNA was dissolved in 50 ml RNase-free water and stored at 2808C until further use. Complementary DNA was synthesised for quantitative RT-PCR (RT-qPCR) using a ReverTra Ace-a-RT-PCR kit (TOYOBO). qPCR primers were designed using Primer 5.0 software based on cytokine sequences available in the GenBank database (Table 3). Additional dissociation curve analysis was performed and showed a single melting curve in all cases. qPCR was performed with the SYBR Green Premix Ex Taq TMII (TaKaRa) in an iQ5 multicolour real-time PCR detection system (Bio-Rad). The total volume of the PCR was 20 ml and consisted of 10 ml SYBR Green Premix Ex TaqII (2 £ ), 1 ml of each primer, 2 ml complementary DNA and 6 ml distilled/deionised water. The cycling conditions were as follows: 958C for 3 min and then forty cycles of 958C for 20 s, 558C for 20 s and 728C for 20 s. All qPCR experiments were performed three times. Data were analysed using the 22DDCT method(32), and b-actin, elongation factor 1a (EF-1a) and 18S(33) were amplified as internal standards.
Autochthonous gut bacterial communities Because inter-individual variations in fish gut microbiota have been reported(34,35), the same intestinal segment from the
Table 3. Sequences of oligonucleotide primers for quantitative RT-PCR Target genes
Primers
Oligonucleotide (50 – 30 )
b-Actin
Forward Reverse Forward Reverse Forward Reverse Forward Reverse Forward Reverse Forward Reverse Forward Reverse
ATCCGTAAAGACCTGTATGCCA GGGGAGCAATGATCTTGATCTTCA GTCAAGTCCGTTGAGATGCACC GGATGATGACCTGAGCATTGAAGC GAGTATGGTTGCAAAGCTGAAAC AATCTGTCAATCCTTTCCGTGTCC CGACTCTGATGAACTGGACTG CCTCAAGTGTGAAGTTTGTGG AAACAGACCCAGACCTTCAC GTTTAGTGATGAGTGGGTTGC GTCACGCTACCTGGAATCAC CCACATAGTAAAAGATGGGCAG TGAAGAAGGAGGATTGCTGC CGAGATAAATCGTGTTGTACCAC
EF-1a 18S IL-1b HSP70 TGF-b TNF-a
Reference (NCBI accession no.) JQ619775(32) JQ619777(32) JQ619778(32)
EF-1a, elongation factor 1a; HSP70, heat shock protein 70; TGF-b, transforming growth factor-b.
JF957368 JF957366 JF957371 JF957372
MSB, microencapsulated sodium butyrate; SBO, soyabean oil; IBW, initial body weight; FBW, final body weight. * The interaction term drives the other contrasts as follows: when the interaction is not significant, only the P values for linear and quadratic contrasts for pre-fed treatments (main-effect means averaged over the sustained-release time of MSB) and the P value for the sustained-release time of MSB are given. When the interaction is significant, only the P values for linear and quadratic contrasts for individual pre-fed treatments (control and oxidised SBO) are given.
0·794 0·355 0·358 0·494 0·385 0·607 0·175 0·088 0·127 0·082 0·123 0·197 0·061 0·311 0·609 0·842 0·654 0·169 0·175 0·175 0·109 0·300 0·908 0·773 – – – – – – – – – – – – – – – – – – – – – – – – – – – – – – – – 0·610 0·367 0·305 0·303 0·528 0·672 0·507 0·353 0·13 1·06 1·03 0·08 0·12 0·01 0·07 0·15 9·47 24·7 15·2 1·68 2·45 0·51 1·52 3·50 10·17 24·5 14·4 1·57 2·52 0·49 1·49 3·61 9·63 18·6 8·96 1·16 3·16 0·50 1·64 3·43
Diet Quadratic 0
1·5
3·0
SEM
Interaction
Linear
Quadratic
Linear
Quadratic
Linear
h of MSB Oxidised SBO Control
3·0
9·82 23·3 13·4 1·54 2·46 0·50 1·55 4·27 10·3 29·1 18·9 1·86 2·20 0·49 1·21 3·46 9·40 22·8 13·4 1·54 2·63 0·47 1·43 4·29 IBW FBW WG SGR FCR BI his WII
All the fish survived during the experiment, and no effects of the pre-fed diets on the initial body weight at the end of week 2 were observed (interaction P¼0·610; diet P¼ 0·794; Table 4). From week 3 until the end of the feeding period, growth performance parameters including final body weight, WG and SGR were found to be upward trend for the control as
1·5
Growth performance, body index, hepatosomatic index and intestinal index of weight
0
Results
Oxidised SBO (h of MSB)
Data were analysed with SPSS 17.0 (SPSS, Inc.). For each outcome variable, a repeated-measures ANOVA was carried out with pre-fed diet (control and oxidised SBO) and sustained-release time of MSB (0, 1·5 and 3·0) considered as within-subject factors. Polynomial contrasts (linear and quadratic) were calculated separately for the control and oxidised SBO treatments and for the arithmetic means of both treatments at the sustained-release time of MSB. In case of a significant interaction between the pre-fed diets and the sustained-release times of dietary MSB, both the P values of the polynomial contrasts for the control and oxidised SBO treatments are given and the contrasts for the averaged measurements are omitted. If the interaction is not significant, only the polynomial contrasts for the averaged measurements are specified. Data are presented as means with their standard errors. The level of significance was a¼ 0·05, and 95 % confidence intervals were used.
Control (h of MSB)
Statistical analysis
19
P (polynomial contrasts)*
sampled fish in each treatment group was pooled with equal wet weight for the analysis of intestinal adherent bacterial communities. DNA was extracted from the pooled samples according to the methods described by Yu & Morrison(36) with some modifications as described by He et al.(37). The V3 region of the 16S rRNA gene was amplified with the primers 338-GC-f (50 -CGCCCGCCGCGCGCGGCGGGCGGGGCGGGGGCACGGGGGGACTCCTACGGGAGGCAGCAG-30 ) and 519r (50 -ATTACCGCGGCTGCTGG-30 ). PCR-denaturing gradient gel electrophoresis was performed according to the method described by Liu et al.(35) and Zhou et al.(38) using the DCode Universal Mutation System (Bio-Rad). Purified PCR products were loaded onto denaturing gradient gels ranging from 40 to 60 % polyacrylamide, and then electrophoresis was conducted at a constant voltage of 60 V for 16 h in 1 £ Tris – acetate – EDTA buffer (provided by Bio-Rad) at 608C. The gels were stained with ethidium bromide (0·5 mg/ml in Tris – acetate – EDTA buffer), rinsed in distilled water for 20 min, and viewed with UV transillumination. The appropriate bands were excised, re-amplified, purified (Tiangen) and sequenced. Principal component analysis was performed for the microbial communities based on the denaturing gradient gel electrophoresis (DGGE) fingerprints using SPSS 17.0 (SPSS, Inc.) as described previously(39). Pairwise similarity coefficient (Cs) matrices were analysed based on the DGGE fingerprints using NTSYS 2.10e software (Exeter Software).
Table 4. Effects on weight gain (WG, g), specific growth rate (SGR, %/d), feed conversion ratio (FCR), body index (BI, %), hepatosomatic index (HSI, %) and intestinal index of weight (WII, %) in carp at the end of the different experimental treatments (from week 3 to week 10)
British Journal of Nutrition
Carp and dietary sodium butyrate
British Journal of Nutrition
20
W. Liu et al.
well as the oxidised SBO groups. However, the interaction between the different pre-fed diets and sustained-release times of dietary MSB was not found to be significant for the final body weight (P¼0·367), WG (P¼0·367), SGR (P¼0·305) and FCR (P¼0·528), as well as for the BI (P¼0·672), HSI (P¼ 0·507) and WII (P¼0·353). All these parameters were not affected by the sustained-release times of dietary MSB (P.0·05), and no significant differences were observed between the control and oxidised SBO groups (diet P.0·05). Despite the fact that there were no statistically significant effects on growth performance when the fish were fed the diets containing different sustained-release times of MSB, it was observed that the MSB1·5 diet increased the WG from 13·4 (95 % CI 4·18, 22·6) to 18·9 (95 % CI 4·52, 33·2) g by 41·0 % when compared with the non-MSB-supplemented diet within the control groups; however, this effect was not observed when supplemented with the MSB3·0 diet. Within the oxidised SBO groups, dietary MSB1·5 increased the WG from 8·96 (95 % CI 4·12, 13·8) to 14·4 (95 % CI 12·9, 15·8) g by 60·7 % when compared with the non-MSB supplement, while the Oxi-3·0 diet increased to 15·2 (95 % CI 6·78, 23·7) g by 69·6 %. Consequently, dietary MSB1·5 reduced the FCR by 16·5, 20·3 and 22·5 % within the control, Oxi-1·5 and Oxi-3·0 groups, respectively. These results showed that dietary MSB1·5 had the potential for improving growth performance within the control groups. In addition, the supplementation of both dietary MSB1·5 and MSB3·0 was beneficial within the oxidised SBO groups.
Intestinal mucosal morphology There were no differences observed in the epithelial mucosa of the FG in the C-0, C-1·5 and C-3·0 groups, with all showing a normal appearance (Fig. 2(a) – (c)). However, at a higher
magnification, damaged epithelial cell surface and disintegrated microvilli were observed in fish pre-fed with oxidised SBO in the Oxi-0 group (Fig. 2(d)). In the Oxi-1·5 and Oxi3·0 groups, the fish fed the MSB supplements showed normal intestinal epithelial morphology, indicating that both dietary MSB1·5 and MSB3·0 treatments prevented or repaired intestinal damage caused by pre-fed oxidised SBO (Fig. 2(e) and (f)). Similar results were observed in the MG and DG (Figs. 3 and 4, respectively). The interaction between the different pre-fed diets and the sustained-release times of dietary MSB was found to be significant for microvillus density (P,0·001) in the FG (Table 5). The dependence of microvillus density on the sustained-release times of dietary MSB differed between the control and oxidised SBO groups. In the control groups, no significant effects were observed (P¼0·551 and P¼0·215 for the linear and quadratic contrasts, respectively), whereas in the oxidised SBO groups, an increase in microvillus density was observed in the FG (P¼ 0·006 and P¼0·001 for the linear and quadratic contrasts, respectively). The analysis of microvillus density revealed that there were no significant differences between the different pre-fed diets and the sustained-release times of dietary MSB in the MG (P¼ 0·423) as well as in the DG (P¼0·242). Although no significant effects were observed during the sustained-release times of dietary MSB (h of MSB: P¼ 0·314 and P¼0·325 for the linear and quadratic contrasts, respectively), microvillus density was significantly higher in the MG of the control groups than that of the oxidised SBO groups (diet P, 0·001). In the DG, a significant effect was observed during the sustained-release times of dietary MSB (P¼0·003 for the quadratic contrast), but there was no difference observed between the control and oxidised SBO groups. Moreover, the interaction was observed to be significant for microvillus density between the treatments and the gut sites (P,0·001).
(a)
(b)
(c)
(d)
(e)
(f)
Fig. 2. Scanning electron microscopy of histological changes in the foregut of the carp at the end of the different experimental treatments: (a) C-0, (b) C-1·5, (c) C-3·0, (d) Oxi-0, (e) Oxi-1·5 and (f) Oxi-3·0. MV, microvilli; MD, mechanical damage; ED, experimental damage; DC, dead/dying cell. See Table 2 for details of the treatments C-0, C-1·5, C-3·0, Oxi-0, Oxi-1·5 and Oxi-3·0.
British Journal of Nutrition
Carp and dietary sodium butyrate
21
(a)
(b)
(c)
(d)
(e)
(f)
Fig. 3. Scanning electron microscopy of histological changes in the midgut of the carp at the end of the different experimental treatments: (a) C-0, (b) C-1·5, (c) C-3·0, (d) Oxi-0, (e) Oxi-1·5 and (f) Oxi-3·0. MV, microvilli; ED, experimental damage; DC, dead/dying cell. See Table 2 for details of the treatments C-0, C-1·5, C-3·0, Oxi-0, Oxi-1·5 and Oxi-3·0.
Intestinal immune responses The expression stability of each internal standard gene in different RNA samples was evaluated by CT values. The CT values of the b-actin, EF-1a and 18S genes were found to be 24·6 (SE 0·47), 28·6 (SE 1·0) and 20·1 (SE 0·83), respectively. Based on these results, we chose the widely used gene b-actin as the internal standard and the CT value of the FG of the C-0 group as the control to calculate the expression levels of the target genes. The effects on the expression levels of intestinal HSP70, IL-1b, TGF-b and TNF-a are shown in Table 6.
The interaction between the different pre-fed diets and the sustained-release times of dietary MSB was found to be significant for the expression levels of HSP70 in the FG (P¼ 0·010), and the expression levels of HSP70 were dependent on the sustained-release times of dietary MSB in both the control and oxidised SBO groups (P,0·05). Expression levels of HSP70 were V-shaped in the oxidised SBO groups, with the Oxi-1·5 group being close to the C-0 group. Meanwhile, a significant interaction between the different pre-fed diets and the sustained-release times of dietary MSB for the expression
(a)
(b)
(c)
(d)
(e)
(f)
Fig. 4. Scanning electron microscopy of histological changes in the distal gut of the carp at the end of the different experimental treatments: (a) C-0, (b) C-1·5, (c) C-3·0, (d) Oxi-0, (e) Oxi-1·5 and (f) Oxi-3·0. MV, microvilli; ED, experimental damage; DC, dead/dying cell. See Table 2 for details of the treatments C-0, C-1·5, C-3·0, Oxi-0, Oxi-1·5 and Oxi-3·0.
3·00 , 0·001 Interaction
SEM
MSB, microencapsulated sodium butyrate; SBO, soyabean oil; FG, foregut; MG, midgut; DG, distal gut. * The interaction term drives the other contrasts as follows: when the interaction is not significant, only the P values for linear and quadratic contrasts for pre-fed treatments (main-effect means averaged over the sustained-release time of MSB) and the P value for the sustained-release time of MSB are given. When the interaction is significant, only the P values for linear and quadratic contrasts for individual pre-fed treatments (control and oxidised SBO) are given.
– 0·325 0·003 – 0·314 0·467 0·001 – – 0·006 – – 0·215 – – 0·551 – – , 0·001 0·423 0·242 2·06 6·43 4·59 107 85 69·3 107 101 117 84·3 51·3 57 95·3 122 77·3 102 121 78·7 97·7 123 72·7 FG MG DG
Quadratic Linear Quadratic Linear 1·5 0
Control (h of MSB)
3·0
0
1·5
3·0
SEM
Interaction
Linear
Quadratic
h of MSB Oxidised SBO
P (polynomial contrasts)*
Control Oxidised SBO (h of MSB)
Table 5. Effects on the density of intestinal microvilli of carp at the end of the different experimental treatments
British Journal of Nutrition
– , 0·001 0·618
W. Liu et al.
Diet
22
levels of HSP70 in the MG (P, 0·001) was observed, but the dependence was only observed in the control group. There was no interaction observed between the different pre-fed diets and the sustained-release times of dietary MSB for the expression levels of HSP70 in the DG (P¼ 0,106); however, significant effects were observed between the sustainedrelease times of dietary MSB and the pre-fed diets (linear contrast: P¼0·018 and salt: P¼0·018). Moreover, the interaction between the treatments and the different gut segments was found to be significant for the expression levels of HSP70 (P, 0·001). There was no interaction observed between the different pre-fed diets and the sustained-release times of dietary MSB for the expression levels of IL-1b in the FG (P¼ 0·066). However, expression levels of IL-1b were affected by the sustained-release times of dietary MSB (linear contrast: P¼ 0·001; quadratic contrast: P, 0·001) but not by the pre-fed diets (P¼ 0·289). Expression levels of IL-1b were found to be V-shaped during the sustained-release time of dietary MSB, and the dietary MSB1·5 group showed a minimum value. The interaction between the different pre-fed diets and the sustained-release times of dietary MSB was found to be significant for the expression levels of IL-1b in the MG and DG (P¼ 0·030 and P, 0·001, respectively). The dependence was only present in the oxidised SBO group in the MG (linear contrast: P¼0·046) while both present in the control (quadratic contrast: P¼0·010) and oxidised SBO (quadratic contrast: P¼0·001) groups in the MG. In addition, expression levels of IL-1b were V shaped in both the MG and DG of the oxidised SBO groups, with the Oxi-1·5 group having a minimum value. Moreover, the interaction between the treatments and the gut segments was significant for the expression levels of IL-1b (P,0·001). The interaction between the different pre-fed diets and the sustained-release times of dietary MSB was found to be significant for the expression levels of TGF-b in the FG (P, 0·010), and expression levels of TGF-b were dependent on the sustained-release times of dietary MSB in both the control and oxidised SBO groups (P,0·05). Meanwhile, the interaction between the different pre-fed diets and the sustained-release times of dietary MSB was found to be significant for the expression levels of TGF-b in the MG and DG (P¼0·009 and P¼0·011, respectively), and the dependence on the sustained-release times of dietary MSB was observed only in the MG and DG of the control group (P,0·05). Moreover, the interaction between the treatments and the gut sites was significant for the expression levels of TGF-b (P, 0·001). Expression levels of TNF-a were dependent on the sustained-release times of dietary MSB only in the FG of the oxidised SBO group (interaction: P¼ 0·002). A sharp significant interaction between the different pre-fed diets and the sustained-release times of dietary MSB for the expression levels of TNF-a were observed in the MG and DG (P, 0·001), and expression levels of TNF-a were dependent on the sustained-release times of dietary MSB in both the control and oxidised SBO groups (P,0·05). Expression levels of TNF-a were found to be lower in the Oxi-1·5 and Oxi-3·0 groups than in the Oxi-0 group. Moreover, the interaction
British Journal of Nutrition
Table 6. Effects on the relative expression levels of intestinal heat shock protein (HSP)-70 and cytokines in carp at the end of the different experimental treatments P (polynomial contrasts)* Control (h of MSB)
HSP70
1·5
3·0
0
1·5
3·0
SEM
Interaction
Linear
Linear
Quadratic
Linear
1·28 0·14 1·46
6·79 0·63 0·63
1·80 0·20 0·88
0·95 0·22 0·42
10·1 0·10 0·45
0·87 0·05 0·21
0·010 , 0·001 0·106
0·004 0·033 –
0·001 0·002 –
0·008 0·112 –
, 0·001 0·092 –
– – 0·018
– – 0·062
– – 0·018
3·05 0·69 0·11
18·4 7·33 0·39
1·48 0·68 0·07
0·066 0·030 , 0·001
– 0·658 0·378
– 0·054 0·010
– 0·178 0·085
– 0·046 0·001
0·001 – –
, 0·001 – –
0·289 – –
6·14 0·44 0·28
1·86 0·27 0·51
0·73 0·41 0·52
, 0·001 0·009 0·011
0·011 0·021 0·846
0·012 0·030 0·009
0·006 0·132 0·293
0·003 0·306 0·392
– – –
– – –
– – –
1·70 0·41 0·91
0·30 0·83 12·9
1·35 1·02 2·96
0·002 , 0·001 , 0·001
0·063 0·027 0·344
0·064 0·003 , 0·001
0·007 0·028 0·067
0·007 0·004 , 0·001
– – –
– – –
– – –
1·04 0·88 0·35
1·12 0·89 0·72
1·12 0·53 1·32
1·71 0·87 5·55
Interaction FG MG DG SEM
Interaction
11·3 1·03 0·15
5·29 3·21 0·91
7·90 4·10 1·23
6·42 1·39 1·19
0·38 , 0·001
SEM
TNF-a
Diet
0·61 , 0·001
Interaction FG MG DG
Quadratic
0·36 , 0·001
SEM
TGF-b
Quadratic
h of MSB
0
Interaction FG MG DG
Oxidised SBO
1·01 0·24 2·51
SEM
IL-1b
Control
1·08 3·51 1·83
0·40 1·90 8·13
9·04 12·26 4·18
12·3 3·32 36·0
Carp and dietary sodium butyrate
FG MG DG
Oxidised SBO (h of MSB)
1·20 , 0·001
MSB, microencapsulated sodium butyrate; SBO, soyabean; FG, foregut; MG, midgut; DG, distal gut; TGF-b, transforming growth factor-b. * The interaction term drives the other contrasts as follows: when the interaction is not significant, only the P values for linear and quadratic contrasts for pre-fed treatments (main-effect means averaged over the sustained-release time of MSB) and the P value for the sustained-release time of MSB are given. When the interaction is significant, only the P values for linear and quadratic contrasts for individual pre-fed treatments (control and oxidised SBO) are given.
23
24
W. Liu et al.
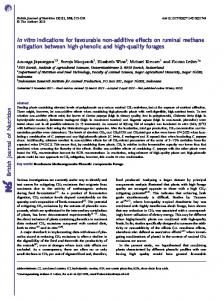
are listed in Table 7. The principal component analysis score plot revealed that principal component 1 accounts for 53·5 % of the total variation and principal component 2 accounts for 29·5 %. It is notable that the samples of the FG and DG were distributed separately. The predominant autochthonous bacterial species (approximately 89·7 %) were members of the Proteobacteria, with Acinetobacter being the most dominant OTU (operational taxonomic units) with five bands (1, 4, 7, 8 and 10). Aeromonas sp. (band 2) was one of the
between the treatments and the gut sites was found to be significant for the expression levels of TNF-a (P,0·001).
Autochthonous gut bacterial communities Adherent gut bacterial communities in fish fed the different treatments and principal component analysis of the band patterns are shown in Fig. 5(a) and (b), respectively. Representatives of the adherent bacterial communities identified
British Journal of Nutrition
(a)
(b)
1·0
C1·5F Oxi0F
C0F
C0M
Oxi3·0F
C3·0F C1·5M
0·5 PC2 (29·5 %)
Oxi1·5F
Oxi0D
0·0 C1·5D
C3·0D
Oxi1·5D C0D C3·0M Oxi3·0M Oxi3·0D Oxi0M Oxi1·5M
–0·5
–1·0 0·0
0·2
0·4
0·6
0·8
1·0
PC1 (53·5 %) Fig. 5. Denaturing gradient gel electrophoresis fingerprints (a) and principal component (PC) analysis of the 16S rDNA V3 region (b) of the adhesive gut bacterial communities in carp at the end of the different experimental treatments: C-0, C-1·5, C-3·0, Oxi-0, Oxi-1·5 and Oxi-3·0. F, foregut; M, midgut; D, distal gut. See Table 2 for details of the treatments C-0, C-1·5, C-3·0, Oxi-0, Oxi-1·5 and Oxi-3·0.
British Journal of Nutrition
Table 7. Representatives of intestinal adhesive bacterial communities and their relative abundance (%) obtained from the BLAST (Basic Local Alignment Search Tool) search in denaturing gradient gel electrophoresis fingerprints Relative abundance (%) Phylogenetic group Proteobacteria
Band Closest relative no. (accession no.) 1 2
5 7 8 10 11 12 Eukaryota
3
Actinobacteria
6
Cyanobacteria
9
Fusobacteria
13
Firmicutes
14
C1·5F C3·0F
Oxi0F Oxi1·5F
Oxi3·0M C0D
C1·5D C3·0D
Oxi0D Oxi1·5D
Oxi3·0D
5
4
96
20
19
20
21
19
19
21
21
20
21
20
20
21
23
19
22
19
99
11
12
11
8
17
11
11
11
10
10
12
11
10
8
8
10
10
6
100
5
4
4
4
3
2
3
3
4
3
4
3
3
2
2
2
2
1
2
2
1
2
2
2
2
6
7
98
21
20
20
20
18
22
21
22
22
21
21
21
21
22
20
21
17
17
100
3
2
3
3
3
4
4
3
3
3
3
4
3
3
3
3
2
1
100
10
9
9
9
9
11
11
11
11
10
11
11
11
11
11
11
11
11
98
20
18
19
20
19
20
20
20
20
18
20
20
21
22
20
20
17
17
99
3
2
2
2
1
2
2
2
3
2
2
2
2
2
2
2
8
8
4
3
2
9
2
2
3
3
3
3
3
3
3
2
3
3
3
3
3
3
4
4
2
1
2
1
2
1
2
2
1
1
1
1
2
1
2
1
7
1
2
2
2
2
2
11
11
100 98 95
2
3
Oxi0M Oxi1·5M
6
99
4
C1·5M C3·0M
5
100
5
Oxi3·0F C0M
100
2 18
Carp and dietary sodium butyrate
4
Acinetobacter sp. (KC153297.1) Aeromonas sp. (AY689039·1) Acinetobacter sp. (DQ211907·1) Enterobacteriaceae bacterium (GU237035·1) Acinetobacter sp. (JX909164·1) Acinetobacter sp. (JN703731·1) Acinetobacter junii (JX490076·1) Sphingobium yanoikuyae (JX122496·1) Sphingomonas sp. (JX867317·1) Cyprinus carpio (JN628435·1) Micropruina glycogenica (JQ899240·1) Anabaena circinalis (EU015860·1) Psychrilyobacter sp. (JF825448·1) Unidentified anaerobic bacterium (AY756145·2)
Identity (%) C0F
F, foregut; M, midgut; D, distal gut.
25
1·00 1·00 1·00 1·00 0·79 0·79 1·00 1·00 0·79 0·79 1·00 0·93 0·93 0·86 0·86 1·00 0·93 0·86 0·86 0·93 0·93 1·00 1·00 0·93 0·86 0·86 0·93 0·93 1·00 1·00 1·00 0·93 0·86 0·86 0·93 0·93 1·00 1·00 1·00 1·00 0·93 0·86 0·86 0·93 0·93 1·00 1·00 1·00 1·00 1·00 0·93 0·86 0·86 0·93 0·93 1·00 0·79 0·79 0·79 0·79 0·79 0·86 0·79 0·79 0·71 0·71 1·00 1·00 0·79 0·79 0·79 0·79 0·79 0·86 0·79 0·79 0·71 0·71 1·00 1·00 1·00 0·79 0·79 0·79 0·79 0·79 0·86 0·79 0·79 0·71 0·71 1·00 0·93 0·93 0·93 0·86 0·86 0·86 0·86 0·86 0·79 0·71 0·71 0·79 0·79 1·00 0·93 0·86 0·86 0·86 0·79 0·79 0·79 0·79 0·79 0·71 0·79 0·79 0·71 0·71 F, foregut; M, midgut; D, distal gut.
1·00 0·86 0·79 0·86 0·86 0·86 0·64 0·64 0·64 0·64 0·64 0·71 0·79 0·79 0·71 0·71 1·00 0·93 0·93 0·86 0·93 0·93 0·93 0·71 0·71 0·71 0·71 0·71 0·79 0·86 0·86 0·64 0·64 1·00 0·86 0·93 0·79 0·86 0·93 0·93 0·93 0·71 0·71 0·71 0·71 0·71 0·79 0·71 0·71 0·79 0·79
Oxi0D C3·0D C1·5D C0D Oxi3·0M Oxi1·5M Oxi0M C3·0M C1·5M C0M Oxi3·0F Oxi1·5F Oxi0F C3·0F C1·5F
Inclusion of organic acids in feed can positively affect the production of the host animal(40). Ringø(13) and Ringø et al.(15) reported that supplementation of 1 g/kg of lactate to the diet of Arctic charr (Salvelinus alpinus L.) increases growth and feed efficiency. In a more recent study, Liebert et al.(41) observed that when tilapia (Oreochromis niloticus) fingerlings were fed 0·3 g/kg of sodium diformate, the protein efficiency ratio and protein retention were significantly improved. However, hybrid tilapia (O. niloticus female £ O. aureus male) fed diets supplemented with five levels (0, 3, 6, 9 and 12 g/kg) of potassium diformate showed no significant effect on growth and the FCR(38). Furthermore, digestibility of proteins, lipids and amino acids increased when rainbow trout (Oncorhynchus mykiss Walbaum) were fed a diet supplemented with 1 % sodium diformate(20). However, information on the use of butyric acid and butyrate in aquaculture is scarce. In a study with Atlantic salmon (S. salar L.), Bjerkeng et al.(42) did not observe significant effects of a mixture of SCFA (Na salts of acetic, propionic and butyric acids (5:5:2, by weight), 0·5 and 2 g/kg) on growth, organ indices including the HSI and WII, feed utilisation and apparent digestibility coefficients. Owen et al.(43) tested 0·2 g/kg of sodium butyrate as a feed additive for African catfish (C. gariepinus) in two diets differing only in their major protein sources; fishmeal v. full-fat soya. The SGR and FCR in each treatment showed non-significant differences compared with the control. In a recent study, Gao et al.(18) reported that supplementing diets with 10 g acid moiety/kg of a sodium formate and butyrate blend (ratio 2:1 on the acid-moiety weight basis) did not improve the growth rate or feed utilisation of rainbow trout. In the present study, the effect of diets containing different sustained-release times of MSB on the growth performance of the common carp was not statistically improved, although some improved effects were observed. In the control group, the effect of the MSB1·5 diet seemed to be better than that of the MSB3·0 diet on growth performance, which is consistent with our hypothesis, but in the oxidised SBO groups both the MSB diets improved the growth performance of the carp. The different results of growth performance observed when the fish were fed the butyric acid and butyrate additives may be related to the dosage form used. Sodium butyrate as a fat-soluble substance could be quickly absorbed and utilised
Table 8. Pairwise similarity coefficient matrix for the intestinal adhesive bacterial communities of carp at the end of the different experimental treatments
British Journal of Nutrition
Discussion
Oxi1·5D
most predominant adherent bacterial species in the intestine of the common carp. In addition, the relative abundance of an unidentified anaerobic bacterium (band 14) was higher in the MG of the Oxi-0 group (Oxi0M) and in the DG of the Oxi-1·5 group (Oxi1·5D) and the Oxi-3·0 group (Oxi3·0D). Pairwise similarity coefficient (Cs) matrices of the adhesive gut bacterial communities are shown in Table 8. The Cs value showed that the three intestinal segments differed, ranging from 0·64 to 1·00. However, the influence of dietary MSB on gut bacterial communities in each region appeared to be less significant: the lowest Cs value was 0·79, which was observed between the C0M or C1·5M and C3·0M, Oxi0M, Oxi1·5M or Oxi3·0M regions.
C0F C1·5F C3·0F Oxi0F Oxi1·5F Oxi3·0F C0M C1·5M C3·0M Oxi0M Oxi1·5M Oxi3·0M C0D C1·5D C3·0D Oxi0D Oxi1·5D Oxi3·0D
Oxi3·0D
W. Liu et al.
C0F
26
British Journal of Nutrition
Carp and dietary sodium butyrate
as an energy source by enteric epithelial cells(44). The results in the present study might be due to the use of microencapsulated dosage form of sodium butyrate and the sustained release along the intestine of the common carp. Similar to the study of Bjerkeng et al.(42), in the present study, sodium butyrate did not affect the organ indices. In a study by Biagi et al.(45), it was shown that intestinal mucosal morphology was not affected when weanling pigs were fed sodium butyrate at the dose levels of 1, 2 or 4 g/kg for 6 weeks, but oral butyrate supplementation at the dose level of 3 g/kg for 6 weeks reduced intestinal mucosal weight in pigs(46). In rainbow trout, the presence of an organic acid salt blend (10 g acid moiety/kg of a sodium formate and butyrate blend, ratio 2:1) in diets did not significantly alter the mucosal folds of the distal intestine(18). Similarly, the present study showed that the intestinal mucosal morphology of the C-0, C-1·5 and C-3·0 groups was not generally affected, although some differences were observed in microvillus height. We put forward the hypothesis that the ability of sodium butyrate to provide energy for epithelial growth may not be essential when the intestine of the host is ‘normal’. Therefore, the observation of the Oxi-0, Oxi-1·5 and Oxi-3·0 treatments to detect the effects of oral sodium butyrate when the fish were pre-fed with oxidised SBO supplement was negligible. Oxidised oil containing primary and secondary oxidation products reduces production performance, damages intestinal mucosa, and influences the activity of anti-oxidases and co-enzymes in aquaculture animals(8,47,48). In the present study, even after returning to the basal diet for 8 weeks, seriously damaged intestinal mucosa and decreased density of intestinal microvilli were observed in the Oxi-0 group at week 10. An interesting observation was that supplementation of both dietary MSB1·5 and MSB3·0 seemed to prevent or repair intestinal mucosal damage and increase the density of microvilli to the normal level. As the actual mechanisms have not been elucidated, the topic merits further investigation. The density of microvilli is related to nutrient absorptivity(49,50). In the present study, intestinal mucosal morphology and microvillus morphology data are consistent with the results of growth performance. To our knowledge, the present study is the first to report on the use of sodium butyrate as a dietary supplement to prevent or repair intestinal mucosal damage caused by oxidised oil. Anuta et al.(19) reported that Pacific white shrimp (Litopenaeus vannamei) fed acidic calcium sulphate as 1·2 and 2·0 % of diet showed significantly reduced stress and enhanced immune responses including haemocyte phagocytic capacity, haemolymph protein concentration, hyaline cell counts and haemolymph glucose levels. To our knowledge, there have been no reports regarding the ability of sodium butyrate to stimulate the immune response of cytokine genes in the intestine as detected with qPCR in aquaculture research. In a piglet trial, the examined genes (cyclophilin A, IL-1b, IL-18 and TNF-a) showed no significant difference in the proximal and distal segments of the intestine as a result of feeding sodium butyrate at dose levels of 1, 2 or 4 g/kg for 6 weeks(45). In this context, the interaction between the different pre-fed diets and the sustained-release times of
27
dietary MSB was found to be significant for the relative gene expression levels of gut HSP70, pro-inflammatory cytokines (IL-1b and TNF-a) and anti-inflammatory cytokines (TGF-b), as well as between the treatments and the gut segments. Generally, within the oxidised SBO groups, the expression levels of these genes were found to be lower in the Oxi-1·5 group but significantly higher in the Oxi-3·0 group, and thus we suggested that the MSB1·5 diet appeared to induce less stress. The reason for the different stress and immunity responses caused by the two types of MSB products can most probably be attributed to the coated material and the releasing time. The difference between the gut segments might be ascribed to the gut morphology, but the exact mechanism should be further studied. Hybrid tilapia (O. niloticus female £ O. aureus male) fed diets supplemented with five levels (0, 3, 6, 9 and 12 g/kg) of potassium diformate have been reported to show different effects on the gut microbiota(38). In a study with red hybrid tilapia (Oreochromis sp.), Ng et al.(51) fed the fish with diets supplemented with a blend consisting of six organic acids and showed that the total bacteria and adherent gut bacteria per g faeces were significantly reduced. De Schryver et al.(52) reported that diets supplemented with 2 – 10 % poly-b-hydroxy butyrate modulated the intestinal microbiota of European sea bass (Dicentrarchus labrax). Pacific white shrimp fed diets containing 0·4– 2 % acid in the form of calcium sulphate also showed changes in the gut microbiota compared with those fed a basal diet with a similarity coefficient of 64·9 %(19). Sodium butyrate supplementation appears to increase the proportion of Gram-positive bacteria in the hindgut of African catfish (C. gariepinus), although the increase was not statistically significant(43). Similarly, it has been reported in mammals that bacterial counts in the jejunum, ileum and caecum of piglets are not affected by feeding sodium butyrate for 6 weeks(45). In the present study, within each gut region, the effects of sodium butyrate on the gut microbiota were slight (Cs . 0·79). Sodium butyrate may not have significantly affected the microbial communities because butyrate is a metabolite produced by butyrate-producing bacteria(53). The slight differences in the microbial communities may have been caused by the changes in intestinal mucosal morphology and immune responses. In conclusion, the data revealed that oral supplementation of dietary MSB1·5 or MSB3·0 can stimulate immune responses and improve the intestinal condition of the common carp. Particularly, the function of improving the intestinal condition was more outstanding when the fish were pre-fed with oxidised oil.
Acknowledgements The authors are indebted to Chunli Li for providing the scanning electron microscopic photographs. The authors are grateful to Yang Deng for his excellent technical assistance. The present study was supported by the National Natural Science Foundation of China (31272672), the National Science and Technology Support Program Project of China (2012BAD25B02) and the Beijing Earmarked Fund for
28
W. Liu et al.
Modern Agro-industry Technology Research System (SCGWZJ 20121104-4). W. L. performed the DGGE, qPCR and scanning electron microscopy and wrote a draft of the manuscript. Y. Y. and J. Z. managed the feeding trial and chemical position analysis. D. M. G. and Z. Z. designed and guided the experimental performance and helped in the writing of the manuscript. E. R. improved the manuscript by critical comments and suggestions. There are no conflicts of interest.
16.
17.
18.
19.
References 1.
British Journal of Nutrition
2.
3.
4. 5.
6.
7.
8.
9.
10.
11.
12. 13.
14.
15.
Khachatourians GG (1998) Agricultural use of antibiotics and the evolution and transfer of antibiotic-resistant bacteria. CMAJ 159, 1129 – 1136. Cassone M & Giordano A (2009) Resistance genes traveling the microbial internet: down the drain, up the food chain? Expert Rev Anti Infect Ther 7, 637 – 639. Cabello FC, Godfrey HP, Tomova A, et al. (2013) Antimicrobial use in aquaculture re-examined: its relevance to antimicrobial resistance and to animal and human health. Environ Microbial 15, 1917– 1942. Cortesi R & Privett OS (1972) Toxicity of fatty ozonides and peroxides. Lipids 7, 715 –721. Koshio S, Ackman G & Lall SP (1994) Effects of oxidised herring and canola oils in diets on growth, survival, and flavor of Atlantic salmon Salmo salar. J Agr Food Chem 42, 1164– 1169. Baker RTM (1997) The effects of dietary a-tocopherol and oxidised lipid on post-thaw drip from catfish muscle. Anim Feed Sci Tech 65, 35 –43. Baker RTM & Davies SJ (1997) Modulation of tissue a-tocopherol in African catfish, Clarias gariepinus (Burchell), fed oxidised oils, and the compensatory effect of supplemental dietary vitamin E. Aquaculture 3, 91 –97. Hamre K, Kolas K, Sandnes K, et al. (2001) Feed intake and absorption of lipid oxidation products in Atlantic salmon (Salmo salar) fed diets coated with oxidised fish oil. Fish Physiol Biochem 25, 209 – 219. Zhang Y, Lall SP & Shahidi F (2007) Effects of oxidised dietary oil and vitamin E supplementation on lipid profile and oxidation of muscle and liver of juvenile Atlantic cod (Gadus morhua). J Agr Food Chem 55, 6379 – 6386. Gao J, Koshio S, Ishikawa M, et al. (2012) Effects of dietary palm oil supplements with oxidised and non-oxidised fish oil on growth performances and fatty acid compositions of juvenile Japanese sea bass, Lateolabrax japonicas. Aquaculture 324 – 325, 97 –103. Zhang Y, Yang L, Zu YG, et al. (2010) Oxidative stability of sunflower oil supplemented with carnosic acid compared with synthetic antioxidants during accelerated storage. Food Chem 118, 656 –662. Jones DL (1998) Organic acids in the rhizosphere: a critical review. Plant Soil 205, 25– 44. Ringø E (1991) Effects of dietary lactate and propionate on growth and digesta in Arctic charr, Salvelinus alpinus (L.). Aquaculture 96, 321 – 333. Ringø E (1992) Effects of dietary formate and acetate on growth and lipid digestibility in Arctic charr, Salvelinus alpinus (L.). Fisk Dir Skr Ser Ernæring 5, 17 –24. Ringø E, Olsen RE & Castell JD (1994) Effect of dietary lactate on growth and chemical composition of Arctic charr Salvelinus alpinus. J World Aquac Soc 25, 483 – 486.
20.
21.
22.
23.
24.
25.
26.
27.
28.
29.
30.
31.
32.
Gislason G, Olsen RE & Ringø E (1996) Comparative effects of dietary Naþ-lactate on Arctic char, Salvelinus alpinus L., and Atlantic salmon, Salmo salar L. Aquac Res 27, 429– 435. Zhou ZG, He SX, Liu YC, et al. (2009) The effects of dietary yeast culture or short-chain fructo-oligosaccharides on the intestinal autochthonous bacterial communities in juvenile hybrid tilapia, Oreochromis niloticusC £ Oreochromis aureusF. J World Aquacult Soc 40, 450– 459. Gao YL, Storebakken T, Shearer KD, et al. (2011) Supplementation of fishmeal and plant protein-based diets for rainbow trout with a mixture of sodium formate and butyrate. Aquaculture 311, 233– 240. Anuta DJ, Buentello A, Patnaik S, et al. (2011) Effect of dietary supplementation of acidic calcium sulfate (Vitoxal) on growth, survival, immune response and gut microbiota of the Pacific white shrimp, Litopenaeus vannamei. J World Aquacult Soc 42, 834– 844. Morken T, Kraugerud OF, Barrowsb FT, et al. (2011) Sodium diformate and extrusion temperature affect nutrient digestibility and physical quality of diets with fish meal and barley protein concentrate for rainbow trout (Oncorhynchus mykiss). Aquaculture 317, 138– 145. Topping DL & Clifon PM (2001) Short chain fatty acids and human colonic function: roles of resistant starch and nonstarch polysaccharides. Physiol Rev 81, 1031 –1064. Hamer HM, Jonkers D, Venema K, et al. (2008) Review Article: the role of butyrate on colonic function. Aliment Pharmacol Ther 27, 104– 119. Hertrampf JW & Piedad-Pascual F (2000) Handbook on Ingredients for Aquaculture Feeds, 624 pp. Dordrecht, the Netherlands: Kluwer Academic Publishers. Rollo A, Sulpizio R, Nardi M, et al. (2006) Live microbial feed supplement in aquaculture for improvement of stress tolerance. Fish Physiol Biochem 32, 167– 177. Scheiermann P, Ott J, Hoegl S, et al. (2011) Effects of short-term infusion of lipid emulsions on pro-inflammatory cytokines and lymphocyte apoptosis in septic and nonseptic rats. Br J Nutr 106, 27– 32. Liu WS, Ren PF, He SX, et al. (2013) Comparison of adhesive gut bacteria, immunity, and disease resistance in juvenile hybrid tilapia fed different Lactobacillus strains. Fish Shellfish Immun 35, 54 –62. Ren ZL, Huo QG, Zeng H, et al. (2001) Effect of oxidised fish oil on the performance and muscular histological structure of carps. Acta Zoonutrimenta Sinica 13, 59– 64 (in Chinese). Association of Official Analytical Chemists (1984) Official Methods of Analysis of the Association of Official. Analytical Chemists, 14th ed., 1141 pp. Arlington, VA: Association of Official Analytical Chemists. Yao SB & Ye YT (2012) Damage effects of oxidised soybean oil on primary cultured intestinal epithelial cells from Ctenopharyngodon idellus and its protection. MSc Thesis, Suzhou University. Cai CF, Wang WJ, Ye YT, et al. (2012) Effect of soybean meal, raffinose and stachyose on the growth, body composition, intestinal morphology and intestinal microflora of juvenile allogynogenetic silver crucian carp (Carassius auratus). Aquac Res 43, 128–138. Ringø E, Salinas I, Olsen RE, et al. (2007) Histological changes in Atlantic salmon (Salmo salar L.) intestine following in vitro exposure to pathogenic and probiotic bacterial strains. Cell Tissue Res 328, 109– 116. Livak KJ & Schmittgen TD (2001) Analysis of relative gene expression data using real-time quantitative PCR and the 22DDCT method. Methods 25, 402– 408.
Carp and dietary sodium butyrate 33.
34.
35.
36.
37.
British Journal of Nutrition
38.
39.
40.
41.
42.
Tang YK, Yu JH, Xu P, et al. (2012) Identification of housekeeping genes suitable for gene expression analysis in Jian carp (Cyprinus carpio var. jian). Fish Shellfish Immunol 33, 775– 779. Spanggaard B, Huber I, Nielsen J, et al. (2000) The microflora of rainbow trout intestine: a comparison of traditional and molecular identification. Aquaculture 182, 1 – 15. Liu Y, Zhou Z, Yao B, et al. (2008) The effect of intraperitoneal injection of immune stimulatory substances on allochthonous gut microbiota of Atlantic salmon (Salmo salar L.) determined using denaturing gradient gel electrophoresis. Aquac Res 39, 635 – 646. Yu Z & Morrison M (2004) Improved extraction of PCRquality community DNA from digesta and fecal samples. Biotechniques 36, 808 –812. He S, Zhou Z, Liu Y, et al. (2009) Effects dietary yeast culture (DVAQUA) on growth performance, intestinal autochthonous bacterial community and non-specific immunity of hybrid tilapia (Oreochromis niloticusC £ O. aureusF) cultured in cages. Aquaculture 294, 99 –107. Zhou Z, Liu Y, He S, et al. (2009) Effects of dietary potassium diformate (KDF) on growth performance, feed conversion and intestinal bacterial community of hybrid tilapia (Oreochromis niloticusC £ O. aureusF). Aquaculture 291, 89– 94. Gremion F, Chatzinotas A, Kaufmann K, et al. (2004) Impacts of heavy metal contamination and phytoremediation on a microbial community during a twelve-month microcosm experiment. FEMS Microbiol Ecol 48, 273 –283. Lu¨cksta¨dt C (2008) The use of acidifiers in fish nutrition. CAB reviews: perspectives in agriculture, veterinary science. Nutr Nat Resour 3, 1 – 8. Liebert F, Mohamed K & Lu¨cksta¨dt C (2010) Effects of diformates on growth and feed utilization of all male Nile tilapia fingerlings (Oreochromis niloticus) reared in tank culture. XIV International Symposium on Fish Nutrition and Feeding, Qingdao, China, Book of Abstracts, 190 pp. Bjerkeng B, Storebakken T & Wathne E (1999) Cholesterol and short-chain fatty acids in diets for Atlantic salmon Salmo salar (L.): effects on growth, organ indices, macronutrient digestibility, and fatty acid composition. Aquac Nutr 5, 181–191.
43.
44. 45.
46.
47.
48.
49.
50.
51.
52.
53.
29
Owen MAG, Waines P & Bradley G, et al. (2006) The effect of dietary supplementation of sodium butyrate on the growth and microflora of Clarias gariepinus (Burchell 1822). Abstract from the XIV International Symposium on Fish Nutrition and Feeding, May 28 –June 1, Biarritz, France. Roediger WE (1980) The colonic epithelium in ulcerative colitis: an energy-deficiency disease? Lancet 316, 712– 715. Biagi G, Piva A, Moschini M, et al. (2007) Performance, intestinal microflora, and wall morphology of weanling pigs fed sodium butyrate. J Anim Sci 85, 1184 – 1191. Gall ML, Gallois M, Seve B, et al. (2009) Comparative effect of orally administered sodium butyrate before or after weaning on growth and several indices of gastrointestinal biology of piglets. Br J Nutr 102, 1285 – 1296. Agerbo P, Jørgensen BM, Jensen B, et al. (1992) Enzyme inhibition by secondary lipid autoxidation products from fish oil. J Nutr Biochem 3, 549–553. Huang CH & Huang SL (2004) Effect of dietary vitamin E on growth, tissue lipid peroxidation, and liver glutathione level of juvenile hybrid tilapia, Oreochromis niloticus £ O. aureus, fed oxidised oil. Aquaculture 237, 381–389. Buret A, O’Laughlin EV, Curtis GH, et al. (1990) Effect of acute Yersinia enterocolitica infection on small intestinal ultrastructure. Gastroenterology 98, 1401 –1407. Ryan CK, Miller JH, Seydel AS, et al. (1997) Epidermal growth factor and neurotensin induce microvillus hypertrophy following massive enterectomy. J Gastrointest Surg 1, 467– 473. Ng WK, Koh CB, Sudesh K, et al. (2009) Effects of dietary organic acids on growth, nutrient digestibility and gut microflora of red hybrid tilapia, Oreochromis sp., and subsequent survival during a challenge test with Streptococcus agalactiae. Aquac Res 40, 1490 – 1500. De Schryver P, Sinha AK, Kunwar PS, et al. (2010) Polyb-hydroxybutyrate (PHB) increases growth performance and intestinal bacterial range-weighted richness in juvenile European sea bass, Dicentrarchus labrax. Appl Microbiol Biotechnol 86, 1535 –1541. Cummings JH & Macfarlane GT (1991) The control and consequences of bacterial fermentation in the human colon. J Appl Bacteriol 70, 443– 459.