British Journal of Nutrition (2014), 112, 398–407 q The Authors 2014
doi:10.1017/S0007114514000932
Hydrogen and methane emissions from beef cattle and their rumen microbial community vary with diet, time after feeding and genotype John A. Rooke1*†, R. John Wallace2, Carol-Anne Duthie1, Nest McKain2, Shirley Motta de Souza2, Jimmy J. Hyslop1, David W. Ross1, Tony Waterhouse1 and Rainer Roehe1 1 2
SRUC, West Mains Road, Edinburgh EH9 3JG, UK Rowett Institute of Nutrition and Health, University of Aberdeen, Bucksburn, Aberdeen AB21 9SB, UK
British Journal of Nutrition
(Submitted 23 May 2013 – Final revision received 12 March 2014 – Accepted 24 March 2014 – First published online 30 April 2014)
Abstract The aims of the present study were to quantify hydrogen (H2) and methane (CH4) emissions from beef cattle under different dietary conditions and to assess how cattle genotype and rumen microbial community affected these emissions. A total of thirty-six Aberdeen Angus-sired (AAx) and thirty-six Limousin-sired (LIMx) steers were fed two diets with forage:concentrate ratios (DM basis) of either 8:92 (concentrate) or 52:48 (mixed). Each diet was fed to eighteen animals of each genotype. Methane (CH4) and H2 emissions were measured individually in indirect respiration chambers. H2 emissions (mmol/min) varied greatly throughout the day, being highest after feed consumption, and averaged about 0·10 mol H2/mol CH4. Higher H2 emissions (mol/kg DM intake) were recorded in steers fed the mixed diet. Higher CH4 emissions (mol/d and mol/kg DM intake) were recorded in steers fed the mixed diet (P, 0·001); the AAx steers produced more CH4 on a daily basis (mol/d, P, 0·05) but not on a DM intake basis (mol/kg DM intake). Archaea (P¼ 0·002) and protozoa (P,0·001) were found to be more abundant and total bacteria (P,0·001) less abundant (P,0·001) on feeding the mixed diet. The relative abundance of Clostridium cluster IV was found to be greater (P,0·001) and that of cluster XIVa (P¼ 0·025) lower on feeding the mixed diet. The relative abundance of Bacteroides plus Prevotella was greater (P¼ 0·018) and that of Clostridium cluster IV lower (P¼ 0·031) in the LIMx steers. There were no significant relationships between H2 emissions and microbial abundance. In conclusion, the rate of H2 production immediately after feeding may lead to transient overloading of methanogenic archaea capacity to use H2, resulting in peaks in H2 emissions from beef cattle. Key words: Hydrogen: Methane: Rumen microbial community: Beef cattle
Methane (CH4) is a greenhouse gas with a global warming potential that is 25-fold that of CO2 (1). Ruminant livestock production through the enteric fermentation of feed contributes significantly to greenhouse gas production by agriculture; in the UK, CH4 accounted for 37 % of all the agricultural emissions in 2005(2). Enteric production of CH4 also represents a loss of energy (from 2 to 12 % of gross energy intake (GEI))(3), which might otherwise be available for growth or milk production. Understanding the mechanisms of methanogenesis and the micro-organisms involved is important for devising sustainable mitigation strategies to lower the environmental impact of ruminant livestock production. Molecular hydrogen (H2) plays an important role in intermediary metabolism in the rumen(4). Bacteria, protozoa and fungi produce H2 through the fermentation of carbohydrate. H2 and CO2 are the principal substrates for the production of CH4 by archaea(5,6). H2 is also a vital intermediate or substrate
in other reactions. Ruminal inter-species H2 transfer is a process that affects the metabolism of both the microbes that produce H2 and those that utilise it(7). Methanogenic archaea require some accumulation of H2 to grow rapidly enough to avoid being washed out of the rumen(4). On the other hand, the accumulation of H2 exerts a thermodynamic inhibitory effect on H2-producing organisms and causes alterations in the fermentation products of these and other microbial species(7). As fibrolytic Ruminococcus spp. are H2 producers (via acetate formation), their growth and consequently fibre degradation may be inhibited by the accumulation of H2 (4,7). These pure culture studies indicate that decreasing H2 concentrations in the rumen would be doubly beneficial in terms of CH4 emissions and fibre breakdown. Several studies have measured H2 concentrations in ruminal digesta, as reviewed by Janssen(4). The concentrations of H2 increase in vitro after the addition of feed and are diet
Abbreviations: AAx, Aberdeen Angus cross; DMI, DM intake; GEI, gross energy intake; LIMx, Limousin cross; LW, live weight; VFA, volatile fatty acid. * Corresponding author: Dr J. A. Rooke, email
[email protected] † Present address: SRUC, Roslin Institute Building, Easter Bush, Midlothian EH25 9RG, UK.
Hydrogen and methane emissions from beef cattle Table 1. Ingredients (fresh weight basis; g/kg) of the high-concentrate and mixed forage – concentrate diets
Ingredients Barley straw Grass silage Whole-crop barley silage Barley grain Maize distillers dark grains Molasses Mineral – vitamin supplement*
High concentrate
Mixed forage – concentrate
81 0 0 688 200 20 10
0 413 340 156 86 0 5
British Journal of Nutrition
* The supplement contained the following minerals (mg/kg) and vitamins (mg/kg): Fe, 6036; Mn, 2200; Zn, 2600; I, 200; Co, 90; Cu, 2500; Se, 30; vitamin E, 2000; vitamin B12, 1000; vitamin A, 151 515; vitamin D, 2500.
dependent. Fewer studies have reported H2 emissions in vivo. In one study(8) involving two sheep, it was found that the animals produced 2-fold different amounts of CH4: the sheep emitting lower amounts of CH4 produced more H2. In another study using sheep, Takenaka et al.(9) concluded that H2 emissions were, on average, 2·1 % (v/v) of CH4 emissions based on exhaled gas concentrations. There were periods of high H2 emission when H2 formation occurred at a faster rate than methanogenesis, particularly when concentrate feeds were included in the diet. To the best of our knowledge, similar investigations in cattle have not been published. Therefore, the aim of the present study was to measure both H2 and CH4 emissions from beef steers fed two contrasting finishing diets typical of those produced in the UK: a high-concentrate diet based on barley and a mixed forage – concentrate diet including grass and whole-crop barley silages, barley grain and maize distillers dark grains (similar to maize distillers grains with solubles).
Materials and methods The present study was conducted at the Beef Research Centre of SRUC (6 miles south of Edinburgh, UK) in 2011. The experiment was approved by the Animal Experiment Committee of SRUC and was conducted in accordance with the requirements of the UK Animals (Scientific Procedures) Act 1986.
399
Animals, experimental design and diets The seventy-two cross-bred steers used in the experiment were from a rotational cross between purebred Aberdeen Angus or Limousin sires and cross-bred dams of those genotypes and referred to as AAx and LIMx, respectively. The steers were fed two complete diets using a forage wagon, consisting (g/kg DM) of either 480 forage:520 concentrate (mixed) or 75 forage:925 concentrate (concentrate). The composition of the diets and the chemical composition of the feeds are given in Tables 1 and 2, respectively. Before the start of the present experiment, DM intake (DMI) and live-weight (LW) gain of the steers were measured in a feeding trial for 8 weeks (to be reported elsewhere). The feeding trial was of a 2 £ 2 factorial (genotype£diet) design with the steers being stratified by LW on entry. The present experiment was a continuation of the feeding trial and therefore the steers were fed the diet that they were fed during the feeding trial. The steers were allocated to six respiration chambers over a 12-week period, using a randomised block design (six chambers £ 4 weeks), which was repeated three times. Within each block, each treatment of the 2£2 factorial (genotype £ diet) experimental design was replicated once in each respiration chamber. The steers were allocated to blocks to minimise variation in LW (mean LW 674 (SEM 4·2) kg) on entry into the respiration chambers. Therefore, emissions from each of the seventy-two steers were measured once as described below.
Respiration chamber design, operation and measurements In the present experiment, six indirect open-circuit respiration chambers were used (No Pollution Industrial Systems Limited). The total chamber volume (76 m3) was ventilated by recirculating fans set at 450 litres/s. Air was removed from the chambers by exhaust fans set at 50 litres/s, giving approximately 2·5 air changes/h. Temperature and relative humidity were set at 158C and 60 %, respectively. Total air flow was measured using in-line hot wire anemometers that were validated by daily measurements made with an externally calibrated anemometer (Testo 417; Testo Limited). Temperature and humidity were measured using sensor probes in the exhaust air outlet (Johnson
Table 2. Chemical composition of feeds incorporated in the high-concentrate and mixed forage – concentrate diets*
DM (g/kg) Ash (g/kg DM) Crude protein (g/kg DM) Acid-detergent fibre (g/kg DM) Neutral-detergent fibre (g/kg DM) Starch (g/kg DM) pH Gross energy (MJ/kg DM)
Barley
MDDG
Silage
WCBS
Straw
850 22 104 69 163 592
865 47 273 216 377 22 21·8
329 60 111 312 540 141 4·7 19·1
825 37 21 519 826 3
18·8
211 67 147 345 567 6 3·9 19·0
17·1
Barley, barley grain; MDDG, maize distillers dark grains; silage, grass silage; WCBS, whole-crop barley silage, straw, barley straw. * Molasses contained 688 g DM/kg and 15·3 MJ/kg DM gross energy.
British Journal of Nutrition
400
J. A. Rooke et al.
Controls), and atmospheric pressure, corrected for altitude, was measured using a Vantage Pro2 weather station (Davis Instruments). The chambers were operated under negative pressure (50 N/m2). The concentrations of CH4 were measured by IR absorption spectroscopy and those of H2 using a chemical sensor (MGA3000; Analytical Development Company Limited). The analyser was calibrated with a gas mixture of known composition. The concentrations of gases in each chamber and inflowing air were recorded every 6 min. Before the start of the experiment, gas recoveries were measured by releasing CO2 at a constant rate into each chamber. The mean recovery was 98 (SEM 3·0) %, which was not different from 100 %. To accustom the steers to the chamber environment, 6 d before chamber measurements, groups of steers were moved to the building in which the chambers were located and loose-housed in single pens (4£3 m) identical in design to pens within the chambers. After 6 d, the steers were moved to the chambers and held there for 72 h, with CH4 and H2 measurements being recorded in the final 48 h of the experimental period. The steers were fed once daily, and the weight of the feed within the bins was recorded at 10 s intervals using load cells. The front doors of the chambers were briefly opened at about 08.00 hours daily to remove the feed bins and again at approximately 09.00 hours to replace the bins containing fresh feed. The pens were cleaned daily between 08.00 and 09.00 hours. The exact time points at which the doors were opened were recorded.
Rumen sampling and volatile fatty acid analysis Immediately after the steers (within 2 h) left the respiration chambers, samples of ruminal fluid were obtained (one per animal) by inserting a tube (16£2700 mm Equivet Stomach Tube; Jørgen Kruuse A/S) nasally and aspirating manually. Approximately 50 ml of the fluid were strained through two layers of muslin and stored at 2208C until analysis. Samples used for volatile fatty acid (VFA) analysis (1 ml) were deproteinised by adding 0·2 ml of metaphosphoric acid (215 g/l) and 0·1 ml of internal standard (10 ml 2-ethyl n-butyric acid/l), and the concentrations of VFA were determined by HPLC(10). For DNA analysis, 5 ml of strained ruminal fluid were mixed with 10 ml of PBS containing glycerol (30 %, v/v) and stored at 2 208C.
DNA analysis DNA extraction was carried out using a method based on repeated bead beating plus column filtration(11). The concentrations of DNA were determined using a NanoDrop ND 1000 spectrophotometer (NanoDrop Technologies). DNA was diluted to 0·5 ng/ml in 5 mg/ml of herring sperm DNA for amplification of bacterial 16S RNA genes with the universal bacterial primers UniF and UniR and 5 ng/ml in 5 mg/ml of herring sperm DNA for the amplification of other groups(12). Quantitative PCR of 16S RNA genes from different bacterial classes was carried out using a BioRad iQ5 system as described by Ramirez-Farias et al.(13). Calibration curves were constructed using three separate batches in different quantitative PCR runs. Bacterial
primer sets, method development and target species have been described in Ramirez-Farias et al.(13). Template DNA from Roseburia hominis A2-183 (DSM 16839T) was used for bacterial calibration. Amplification of archaeal 16S RNA genes was carried out using the primers described by Hook et al.(14) and calibrated using DNA extracted from Methanobrevibacter smithii PS, a gift from M. P. Bryant, University of Illinois. Protozoal 18S rRNA gene amplification was calibrated using DNA amplified from bovine ruminal digesta with the primers 54f and 1747r(15). The coverage of quantitative PCR primers was checked from original references and using the ProbeMatch tool of the Ribosomal Database Project(16).
Feed analysis Feed samples were analysed for DM, ash, crude protein, aciddetergent fibre, neutral-detergent fibre, starch(17) and gross energy contents by adiabatic bomb calorimetry.
Calculations and statistical analysis To minimise bias caused by the entry of air into the chambers on opening the doors for feeding and as steers did not have access to feed during this period (54 min, SD 22·5), the concentrations of gases measured during this period were not used for further analysis. Instead, and to minimise bias, these values were replaced by the mean value of measurements (n 10) made in the last hour before the doors were opened. If a steer had consumed food during this period, mean values recorded during the hour preceding feed consumption were used. All data, including those on gas concentrations, air flow, temperature, humidity, atmospheric pressure and records of feed consumption, were loaded into a database. Dry air flow was calculated and corrected to standard temperature and pressure for each individual record of gas concentration. Daily gas production was then calculated as the average of individual values. Measurements were not recorded for one steer because of illness and data obtained from three steers were excluded because of an air leak in one chamber; these comprised two LIMx steers fed the concentrate diet, one LIMx steer fed the mixed diet and one AAx steer fed the mixed diet. Data were analysed using Genstat (version 11.1 for Windows; VSN International Limited) using linear mixed models, where the fixed factor was the 2 £ 2 arrangement of genotype and diet and the random factors were the block and chamber. As samples for VFA analysis were available for only 7 weeks of the experimental period, VFA data were analysed as a 2£ 2 factorial arrangement of genotype and diet with week of the experiment and chamber. Data are reported as means with their standard errors of the difference unless indicated otherwise. Multiple linear regression models were fitted to predict CH4 and H2 emissions from the whole dataset. Fitted terms included Clostridium clusters IV and XIVa, Bacteroides plus Prevotella, archaea and protozoa (expressed as copy number/ng DNA). To help with variable selection, all the subsets of predictors were examined, with subsets being compared using adjusted R 2 and Akaike’s information criterion.
Hydrogen and methane emissions from beef cattle
British Journal of Nutrition
Results
401
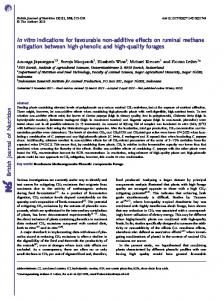
(mol/kg DMI) was related to the peaks in H2 concentrations associated with feeding. Molar proportions (mmol/mol; Table 4) of acetic acid (P, 0·001), butyric acid (P¼0·013) and valeric acid (P¼ 0·01) were greater and those of propionic acid (P,0·001) lower in the ruminal fluid samples obtained from the mixed diet-fed steers than in those obtained from the concentrate diet-fed steers. Genotype had no effect on VFA proportions. Both diet and genotype affected microbial numbers (Table 5). The concentrate diet supported lower copy numbers of archaea (P¼ 0·002) and protozoa (P, 0·001) but higher copy numbers of total bacteria (P,0·001) compared with the mixed diet. Clostridium clusters IV and XIVa and Bacteroides plus Prevotella accounted for between 0·7 and 0·8 of copy numbers represented by total bacteria and there were no differences in this proportion due to diet or genotype. The relative abundance of Clostridium cluster IV (proportion of total bacteria; Table 5) was found to be greater (P,0·001) and that of Clostridium cluster XIVa (P¼ 0·025) to be lower on feeding the mixed diet than on feeding the concentrate diet (P, 0·001). Proportionally, higher copy numbers of Clostridium cluster IVa (P¼ 0·031) and lower copy numbers of Bacteroides plus Prevotella (P¼ 0·018) were supported by the AAx steers. A significant correlation between H2 and CH4 production (mol/kg DMI) was observed on feeding the mixed diet but not on feeding the concentrate diet (Fig. 2). In the linear regression analysis, a significant slope was found for the mixed diet (0·088, SE 0·0041, P, 0·001), with the intercept not differing from 0. No microbial predictors were able to explain a significant amount of variability in H2 emissions between individual animals. A relationship (r 2 0·30) between CH4 emissions (mol/kg DMI) and copy numbers ( £ 103/ng DNA) of archaea and Clostridium cluster XIVa was observed:
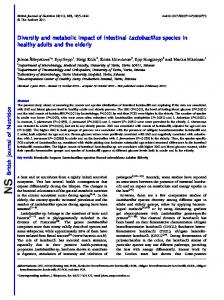
Cattle fed the mixed diet consumed less feed (Table 3), whether expressed as total daily DMI (P,0·001) or as g/kg LW (P¼0·009), than those fed the concentrate diet. The DMI of the AAx steers was also greater (P¼0·002) than that of the LIMx steers. Whether expressed as mol/d, mol/kg DMI or kJ/MJ GEI (Table 3), steers fed the concentrate diet produced less CH4 than those fed the mixed diet (P, 0·001). The AAx steers produced more CH4 (mol/d, P¼0·032) than the LIMx steers, but this difference disappeared when CH4 production was expressed relative to DMI or GEI. H2 production by the steers was, on average, 0·10 mol H2/mol CH4 (Table 3). There was a significant diet £ genotype interaction such that the concentrate diet-fed AAx steers produced less total H2 than the LIMx steers, but the opposite trend was observed on feeding the mixed diet. When expressed as mol/kg DMI or kJ/MJ GEI, there was no interaction, and the mixed diet-fed steers produced more H2 than the concentrate diet-fed steers. However, as a proportion of CH4 production (mol H2/mol CH4), the concentrate diet-fed steers produced more H2 than the mixed diet-fed steers (P,0·001). Fig. 1 shows examples, involving one steer fed the concentrate diet and another fed the mixed diet, of changes in the rate of CH4 and H2 production (mmol/min) over a 24 h period after fresh feed was offered. There were intermittent peaks, particularly in H2 emission rates throughout the day. On aligning these peaks with the records of feed consumption, it was apparent that the peaks in CH4 and H2 concentrations occurred a short time after feed consumption. Further analysis showed that whereas median H2 production rates (0·63 v. 0·68 mmol/min, SED 0·060, concentrate v. mixed) did not differ (P. 0·05) between the dietary groups, the frequency of H2 production more than 0·5 mmol/min above the median values (0·053 v. 0·117, SED 0·210, P,0·001) was greater in the mixed diet-fed steers than in the concentrate diet-fed steers. Thus, a substantial part of the greater H2 output in the mixed diet-fed steers
CH4 ðmol=g DMIÞ ¼ 1·07 2 0·00298 Cluster XIVa ðse 0·00083; P ¼ 0·001Þ þ 0·0094 Archaea ðse 0·0024; P , 0·001Þ:
Table 3. Intake and methane and hydrogen production values recorded in steers fed either a high-concentrate diet or a mixed forage – concentrate diet (Mean values with their standard errors of the difference for seventeen observations per mean) Diets. . . Genotypes. . . DMI kg/d g/kg LW H2 mol/d mol/kg DMI kJ/MJ GEI CH4 mol/d mol/kg DMI kJ/MJ GEI H2:CH4 (mol/mol)
Concentrate AAx 11·4 16·1
LIMx 10·0 15·1
Mixed AAx 10·2 15·2
P LIMx
8·7 13·4
SED
0·52 0·76
Genotype
Diet
G£ D
0·002 0·016
, 0·001 0·009
NS NS
0·92 0·084 1·27
1·08 0·112 1·66
1·18 0·116 1·74
1·05 0·122 1·84
0·106 0·0111 0·168
NS NS NS
NS 0·006 0·004
0·027 NS NS
9·4 0·83 39·0 0·101
8·5 0·87 39·9 0·126
13·6 1·34 61·7 0·086
12·0 1·38 64·2 0·088
0·72 0·077 3·31 0·0135
0·032 NS NS NS
, 0·001 , 0·001 , 0·001 , 0·001
NS NS NS NS
Concentrate, high-concentrate diet; mixed, mixed forage–concentrate diet; AAx, Aberdeen Angus cross; LIMx, Limousin cross; G£ D, genotype£ diet; DMI, DM intake; LW, live weight; GEI, gross energy intake.
402
J. A. Rooke et al.
Gas production (mmol/min)
(a)
disposal of H2. In a study carried out in Europe, about 50 % of the human subjects were found to also produce CH4; CH4 production competed with other metabolic processes, but H2 was still produced by these subjects(18). The rates of H2 emissions from ruminants are known to be proportionally much lower and those of CH4 emissions much greater(19). van Zijderveld et al.(20) measured H2 production by dairy cows hourly for 9 h and reported greater concentrations when nitrate was included in the diet, but, to the authors’ knowledge, this is the first study in which total daily H2 emissions from cattle have been quantified on a large scale using indirect respiration chambers.
12·5
10·0
7·5
5·0
Hydrogen emissions 2·5
6.00
12.00
18.00
Time (h) (b)
Gas production (mmol/min)
British Journal of Nutrition
0·0 0.00
12·5
10·0
7·5
5·0
2·5
0·0 0.00
6.00
12.00
18.00
Time (h) Fig. 1. Changes in methane production ( ) and hydrogen production ( ) during a 24 h period (beginning after fresh feed was offered at 09.00 hours). Examples are given for (a) one steer fed a high-concentrate diet and (b) another steer fed a mixed forage – concentrate diet. Diets were fed ad libitum, and denote the time point at which the feed was consumed.
Discussion Enteric fermentation in animals occurs predominantly in the absence of oxygen. Under such conditions, microbial communities adapt differently to the disposal of the reducing equivalents that are generated by glycolysis. Some microorganisms use an internal redox mechanism, such as in the formation of propionate and succinate. However, most of the microbial fermentations result in the formation of molecular H2. The fate of H2 depends on the animal species and its anatomical configuration. In man, with a relatively rapid gut transit time, reductive acetogenesis (H2 þ CO2 ! acetate) and H2 production tend to predominate as mechanisms for the
Previous studies have reported lower H2 concentrations in ruminants fed all-forage diets than in those fed diets containing various proportions of concentrate and forage whether measured as concentrations of H2 dissolved in the rumen fluid(21), in the rumen gas phase(22) or in the exhaled air(9). There do not appear to be any reports of H2 emissions from live animals fed high-concentrate diets. In the present study, daily H2 emissions recorded were similar for both diets and genotypes, but when converted to units per DMI, H2 production was found to be greater for the mixed diet than for the concentrate diet. Total daily H2 emissions were about 1 and 10 % of CH4 emissions on a mass basis and a molar basis, respectively. Total H balance was determined from estimates of the amounts of carbohydrate fermented in the rumen and observed mean VFA molar proportions for each diet. Although the amount of H2 produced per unit carbohydrate fermented on feeding the concentrate diet was less than that produced on feeding the mixed diet (3·6 v. 4·9 mol H2/mol of carbohydrate fermented), estimates of total H2 produced were not dissimilar between the dietary groups (169 v. 177 mol/d, concentrate v. mixed) because of both the lower fermentability (due to the presence of fermentation end products in the silages) and the lower daily feed intake values recorded for the mixed diet. Thus, H2 emissions accounted for less than 2 % of the estimated total H2 production from fermentation. Furthermore, after accounting for H2 consumed in the synthesis of microbial biomass, the total recovery of H2 in microbial biomass, H2 and CH4 was similar between the dietary groups (108 and 114 % of H2 produced on feeding the concentrate and mixed diets, respectively), indicating that there were no major H2-consuming processes unaccounted for or that differed between the dietary groups. Peaks in H2 emission rates (Fig. 1) were observed after feed consumption, and these peak H2 emission rates were found to be greater on feeding the mixed diet. Increases in H2 emission rates after feed consumption were consistent with measurements in sheep of H2 concentrations in the ruminal fluid(21,23), rumen head-space gas(22,24) and respiration chambers(25,26). The larger size of the meal-related peaks in H2 emissions observed on feeding the mixed diet accounted for the differences in daily H2 emissions (g/kg DMI) observed. One might have expected that there would be correlations between the ruminal microbiota and H2 emissions, particularly the balance between ciliate protozoa and Clostridium cluster IV as major H2 producers and archaea as consumers, but no relationships
Hydrogen and methane emissions from beef cattle
403
Table 4. Volatile fatty acid molar proportions (mmol/mol) in ruminal fluid samples obtained from steers fed either a high-concentrate diet or a mixed forage – concentrate diet (Mean values with their standard errors of the difference for eight observations per mean) Concentrate
Diets. . .
P
Mixed
Genotypes. . .
AAx
LIMx
AAx
LIMx
SED
Genotype
Diet
G£ D
Acetic acid Propionic acid Butyric acid Valeric acid Branched-chain acids*
557 290 105 16 32
562 306 92 16 24
670 172 114 12 30
670 173 125 13 20
27·9 34·9 13·4 1·8 6·2
NS NS NS NS NS
, 0·001 , 0·001 0·013 0·010 NS
NS NS NS NS NS
British Journal of Nutrition
Concentrate, high-concentrate diet; mixed, mixed forage –concentrate diet; AAx, Aberdeen Angus cross; LIMx, Limousin cross; G£ D, genotype£ diet. * Isobutyric acid plus isovaleric acid.
utilise the H2 produced. The peaks in H2 emissions after feed consumption were also more defined and discrete than the peaks in CH4 emissions (Fig. 1). A possible explanation for this is that while CH4 is an end product of the metabolism of H2 by archaea, the H2 present in the ruminal gas phase can either be emitted by eructation or redissolve in the ruminal fluid and be utilised for CH4 production by the archaea(28). This may also explain the poor relationship between CH4 and H2 emissions (Fig. 2), as H2 emissions will depend not only on the rates of production by H2-generating metabolism exceeding the capacity of archaea to consume H2 but also on the rate at which dissolved/gaseous H2 is utilised. Both these will depend on the meal size and the rate of feed consumption of individual animals.
between H2 emissions and any of the different groups of microorganisms were found. It is possible that the primers used may not have detected all the H2-producing bacteria. Alternatively, the differences between the dietary groups with regard to H2 emissions are more likely to be related to the nature of the diets fed and the consumption patterns of individual cows. First, the peaks in H2 emissions may be caused by the physical displacement of gas from the rumen head space by the feed consumed(27). Because the mixed diet contained higher proportions of long forage and had a higher moisture content (443 v. 853 g DM/kg fresh weight), the bulkier mixed diet may have caused greater displacement of the rumen head-space gas and hence greater H2 emissions. Second, compared with the concentrate diet, the mixed diet contained higher concentrations of more slowly fermented cell wall carbohydrates and less starch and also higher concentrations of soluble feed constituents derived from the silages fed, particularly amino acids and fermentation products. Therefore, there may be an increased production of H2 from the rapid fermentation of soluble feed components immediately after consumption of the mixed diet that exceeds the capacity of methanogens to
Methane production As has been found in other studies(2,29), CH4 production (mol/d) was found to be substantially lower on feeding the diet containing more than 900 g concentrate/kg DM than on feeding the mixed forage – concentrate diet, thus confirming
Table 5. Microbial numbers in the samples of ruminal digesta (Mean values with their standard errors of the difference for thirteen observations per mean) Diets. . . Genotypes. . . Archaea* Protozoa† Total bacteria* Clostridium Cluster IV* Cluster XIVa* Bacteroides plus Prevotella* Relative abundance‡ Clostridium Cluster IV* Cluster XIVa* Bacteroides plus Prevotella* Sum§
Concentrate
Mixed
P
AAx
LIMx
AAx
LIMx
SED
Genotype
Diet
G£ D
30·4 37·2 669
25·7 40·0 761
46·4 102·1 492
36·7 71·4 513
5·84 16·1 57·7
NS NS NS
0·002 , 0·001 , 0·001
NS NS NS
138 127 218
122 122 302
179 75 157
135 69 202
32·7 18·9 29·1
NS NS 0·002
NS , 0·001 , 0·001
NS NS NS
0·031 NS 0·018 NS
, 0·001 0·025 NS NS
NS NS NS NS
0·21 0·19 0·33 0·74
0·17 0·16 0·40 0·73
0·35 0·15 0·32 0·82
0·26 0·13 0·40 0·79
0·046 0·023 0·041 0·057
Concentrate, high-concentrate diet; mixed, mixed forage–concentrate diet; AAx, Aberdeen Angus cross; LIMx, Limousin cross; G£D, genotype£diet. * Results are expressed as copy numbers ( £ 103)/ng DNA as determined by quantitative PCR of 16S rRNA. † Results are expressed as copy numbers ( £ 103)/ng DNA as determined by quantitative PCR of 18S rRNA. ‡ Relative abundance as a proportion of total bacteria. § Sum is the abundance of Clostridium cluster IV plus that of cluster XIVa plus Bacteroides plus Prevotella.
404
J. A. Rooke et al.
Hydrogen production (mol/kg DMI)
(a) 0·25
0·20
0·15
0·10
0·05
0·00 0·0
0·5
1·0
1·5
2·0
Methane production (mol/kg DMI)
Hydrogen production (mol/kg DMI)
British Journal of Nutrition
(b) 0·25
0·20
0·15
0·10
0·05
0·00 0·0
0·5
1·0
1·5
2·0
Methane production (mol/kg DMI) Fig. 2. Relationships between daily hydrogen and methane production in cattle fed either (a) a high-concentrate diet (X) or (b) a mixed forage – concentrate diet (W). A significant regression line is shown for the mixed forage –concentrate diet: y ¼ 0·088x; SE 0·0041; P, 0·001. DMI, DM intake.
of 0·028 and 0·040 MJ/MJ GEI were recorded, respectively. Similarly, CH4 production values of 0·033 and 0·046 MJ/MJ GEI were recorded for maize- and barley-based concentrates (800 g concentrate/kg DM), albeit in different years(30). Finally, a CH4 production value of 0·04 MJ/MJ GEI for a barley-based diet (900 g/kg diet DM)(31) and recently a value of 0·03 MJ/MJ GEI for a maize-based concentrate(32) have been reported. Thus, the value of 0·030 MJ/MJ GEI suggested by the IPCC(1) for high-concentrate diets is probably inappropriate for diets based on barley and a value of 0·04 MJ/MJ GEI might be more appropriate. The reasons for the difference between barley and maize have been discussed(29,32) and are most probably due to the more rapid and complete fermentation of barley grain in the rumen and the higher fibre concentration in barley. The simple approach used by the IPCC(1) does not account for variations in diet digestibility or differences in the efficiency of utilisation of absorbed nutrients for productive purposes. CH4 emissions recorded in the present study were estimated first relative to metabolisable energy (estimated from the feed analysis) intake as a proxy for digestibility and second with respect to steer LW gain during the feeding trial that preceded the present experiment. Estimates recorded on feeding the concentrate diet were 0·058 MJ CH4/MJ metabolisable energy intake and 6·5 mol CH4/kg LW gain compared with 0·101 and 11·7 recorded on feeding the mixed diet. Relative to the concentrate diet, the mixed diet resulted in 1·74-fold (metabolisable energy basis) and 1·80fold (LW gain basis) higher CH4 emissions in comparison with 1·58-fold expressed on a gross energy basis. Thus, the difference in CH4 emissions between the dietary groups is amplified when expressed on a metabolisable energy or a LW gain basis. Although total daily CH4 emissions were greater in the AAx steers, this difference was accounted for by differences in DMI. Thus, CH4 emissions (mol/kg DMI) did not differ between similar genotypes, although there were effects of individual sires(33).
Diet and microbial numbers the well-established strategy of reducing CH4 emissions by increasing the concentrate proportion of the diet. Mean CH4 yields of 0·039 and 0·062 MJ/MJ GEI were recorded on feeding the concentrate and mixed diets, respectively. These compare with values of 0·030 MJ/MJ GEI (‘for the diet containing more than 900 kg concentrate/kg DM’) and 0·065 MJ/MJ GEI (‘for all other diets’) adopted by the IPCC(1) for estimating CH4 emissions. Thus, the values predicted by the IPCC(1) for CH4 production for the mixed diet slightly differed from those recorded (predicted v. observed; 298 v. 287 litres/d). However, the IPCC(1) underestimated CH4 production values for the concentrate diet (predicted v. observed, 155 v. 200 litres/d). The reason for the higher CH4 production values recorded on feeding the concentrate diet in the present study was probably that the cereal fed was barley rather than maize. When high-concentrate diets based on maize and barley were fed to feedlot cattle(28), CH4 production values
The analysis of the rumen microbial community provided information on how diet affected the main groups of bacteria, total ciliate protozoa and archaea. The three groups of bacteria were chosen to represent the main groups of bacteria (Firmicutes and Bacteroidetes) that are known to colonise the rumen(34 – 36), but it should be noted that the primers used would not account for all the species of Firmicutes or Bacteroidetes. The three groups of bacteria accounted for more than 0·70 of total bacteria copy numbers and this proportion was not influenced by diet or genotype. The Clostridium groups form part of the Firmicutes phylum, the members of which are usually more abundant than Bacteroidetes in rumen samples(34 – 36), and this was true for the AAx steers but not for the LIMx steers in the present study. Part of the variation in the relative abundance (proportion of total bacteria) of the two Clostridium clusters was due to diet. The abundance of Clostridium cluster IV, encompassing the highly cellulolytic Ruminococcus and several Eubacterium spp.(13), was found
British Journal of Nutrition
Hydrogen and methane emissions from beef cattle
to be greater on feeding the mixed diet. Clostridium cluster XIVa, the abundance of which was found to be lower on feeding the mixed diet, contains Butyrivibrio and related species(13), none of which are known to possess the ability to break down crystalline cellulose(37). Ciliate protozoa were found to be more abundant on feeding the mixed diet, a result which seems to be at odds with the general observation that adding a concentrate to a forage diet usually increases the number of protozoa(19,38). There are a limited number of reports on the effects of diets containing high proportions of concentrate on rumen microbial community. The abundance of archaea increased when the concentrate proportion was increased from 100 to 500 g/kg diet(39) and decreased when it was increased from 500 to 900 g/kg(40) (similar to that done in the present experiment). However, when Popova et al.(41) compared starch- and fibre-rich concentrates in a diet containing 870 g concentrate/kg, no differences in the abundance of methanogens were observed between the dietary groups. When the dietary concentrate proportion was increased(42) from 0 to 700 g/kg, higher proportions were found to reduce the numbers of Fibrobacter succinogenes and increase the numbers of members of the genus Prevotella, but no differences in the abundance of Ruminococcus albus or R. flavefaciens were observed between the diets. This is in contrast to the decrease in the abundance of Clostridium cluster IV and no change in that of Bacteroides plus Prevotella observed when the concentrate proportion was increased in the present study. Similarly, increases in the number of protozoa were reported(41,42) when the proportion of concentrate or dietary starch was increased, again in contrast to the decrease in numbers reported herein and elsewhere(31). These differences are probably explained by the different dietary protocols and approaches to community analysis used in the experiments. For example, Carberry et al.(42) compared 0 and 700 g concentrate/kg, while we compared 500 and 920 g concentrate/kg in the present study. In terms of our focus on H2 emissions, it was perhaps surprising that the H2-producing Ruminococcus spp. of cluster IV and total protozoa, which produce abundant H2(43), were not more correlated with CH4, as H2 is the main substrate for methanogenesis in the rumen(28,44). There is no obvious explanation, except perhaps that any effect of the abundance of H2 producers was swamped by the effects of long-term adaptation to the diets fed. Alternatively, a more detailed taxonomic description within the groups, best derived from metagenomic information, might help identify key genera and species that dictate H2 production and thereby influence methanogenesis. Many researchers believe, and some studies are beginning to show, that the host animal exerts a controlling effect on its own gut microbiota(45 – 47). The findings reported herein that the relative abundance of Bacteroides plus Prevotella was lower and that of cluster IV greater in the AAx steers than in the LIMx steers on feeding the corresponding diets would support such a hypothesis and may provide a mechanism for the greater feed intakes observed in the AAx steers.
405
Implications Recently, considering interactions between H2 and other gases in the atmosphere(48), it has been proposed that H2 is an indirect greenhouse gas with a global warming potential of 5·8 compared with 25 of CH4 on a CO2 mass equivalent basis. On a daily basis, total (CH4 plus H2) mean emissions from enteric fermentation were 3·6 and 5·1 kg CO2 for the concentrate and mixed diets, of which H2 contributed 12 and 13 g CO2 daily. Thus, although inefficiency in capturing H2 during inter-species H2 transfer is a loss of energy from the system, in terms of overall greenhouse gas production by ruminants, its contribution will be negligible with the exception of circumstances where methanogenesis is severely disrupted, e.g. when halogenated compounds are used to inhibit methanogenesis(25). In conclusion, this large-scale study of the effect of diet, feeding pattern and cattle genotype on H2 emissions from cattle has revealed that H2 emissions can be up to 10 % on a molar basis of CH4 emissions from beef cattle on feeding commonly used diets. Most of the H2 was produced shortly after feeding, and the concentration followed that of CH4. However, the feeding-related increases in H2 emissions were not related to the microbial populations and therefore are more likely to occur due to between-diet differences in feeding patterns and the nutrients rapidly fermented upon feed ingestion. Cattle genotype affected H2 emissions via differences in feed intake and this may be related to differences in microbial community structure. The observations are consistent with the review by Janssen(4) that the capacity for archaeal methanogenesis is in balance with the rates of H2 production, such that some accumulation of H2 is required for methanogenesis to occur. The quantities of H2 emitted and the lower radiative forcing potential of H2 suggest that H2 emissions present a minor environmental problem in comparison with CH4 emissions.
Acknowledgements The authors are grateful to Lesley Deans and all support staff at the Beef Research Centre, Easter Howgate, for their technical assistance and also to Graham Horgan of BioSS, Aberdeen, for conducting multivariate analysis. The present study was funded by the Scottish Government and by DEFRA and the devolved administrations through the UK Agricultural Greenhouse Gas Inventory Research Platform (http://www.ghgplatform.org.uk). The funders had no role in the design and analysis of the study or in the writing of this article. The authors’ contributions are as follows: T. W., R. J. W. and R. R. initiated the research; C.-A. D., J. J. H. and D. W. R. participated in the planning and facilitation of the animal work; N. McK. and S. M. de S. carried out DNA extraction and quantitative PCR; J. A. R supervised the respiration chamber studies and wrote the manuscript with inputs from R. J. W. All authors provided feedback on the manuscript. None of the authors has any conflicts of interest to declare.
406
J. A. Rooke et al.
References 1.
2.
3. 4.
5.
British Journal of Nutrition
6.
7.
8.
9.
10.
11.
12.
13.
14.
15.
16.
17.
18.
19.
Intergovernmental Panel on Climate Change (2006) Guidelines for National Greenhouse Gas Inventories, vol. 4. Agriculture, Forestry and Other Land Use. Available at http://www.ipcc-nggip.iges.or.jp/public/2006gl/vol4.html (accessed May 2013). Cottle DJ, Nolan JV & Wiedemann SG (2011) Ruminant enteric methane mitigation: a review. Anim Prod Sci 51, 491–514. Johnson KA & Johnson DE (1995) Methane emissions from cattle. J Anim Sci 73, 2483– 2492. Janssen PH (2010) Influence of hydrogen on rumen methane formation and fermentation balances through microbial growth kinetics and fermentation thermodynamics. Anim Feed Sci Technol 160, 1– 22. Hungate RE (1967) Hydrogen as an intermediate in the rumen fermentation. Archiv Mikrobiol 59, 158 – 164. Poulsen M, Schwab C, Jensen BB, et al. (2013) Methylotrophic methanogenic Thermoplasmata implicated in reduced methane emissions from bovine rumen. Nat Commun 4, 1428. Wolin MJ, Miller TL & Stewart CS (1997) Microbe – microbe interactions. In The Rumen Microbial Ecosystem, pp. 467–491 [PN Hobson and CS Stewart, editors]. London: Chapman and Hall. Faichney GJ & Graham NM (1996) Reduced methane emissions associated with unstable rumen fermentation in sheep. Proc Nutr Soc Aus 20, 120 –123. Takenaka A, Mistumori CS & Pinares-Patino CS (2008) Methane and hydrogen concentrations in the breath of sheep. Aus J Exp Agric 48, lxxxvii. Rooke JA, Borman AJ & Armstrong DG (1990) The effect of inoculation with Lactobacillus plantarum on fermentation in laboratory silos of herbage low in water-soluble carbohydrate. Grass Forage Sci 45, 143 –152. Yu ZT & Morrison M (2004) Improved extraction of PCR-quality community DNA from digesta and fecal samples. Biotechniques 36, 808 – 812. Fuller Z, Louis P, Mihajlovski A, et al. (2007) Influence of cabbage processing methods and prebiotic manipulation of colonic microflora on glucosinolate breakdown in man. Br J Nutr 98, 364 –372. Ramirez-Farias C, Slezak K, Fuller Z, et al. (2009) Effect of inulin on the human gut microbiota: stimulation of Bifidobacterium adolescentis and Faecalibacterium prausnitzii. Br J Nutr 101, 541 –550. Hook S, Northwood K, Wright A, et al. (2009) Long-term monensin supplementation does not significantly affect the quantity or diversity of methanogens in the rumen of the lactating dairy cow. Appl Env Microbiol 75, 374 – 380. Sylvester JT, Karnati SKR, Yu ZT, et al. (2004) Development of an assay to quantify rumen ciliate protozoal biomass in cows using real-time PCR. J Nutr 134, 3378– 3384. Cole JR, Wang Q, Cardenas E, et al. (2009) The Ribosomal Database Project: improved alignments and new tools for rRNA analysis. Nucleic Acids Res 37, D141 – D145. Ministry of Agriculture Fisheries and Food (1992) Analysis of Agricultural Materials, 2nd ed. London: Her Majesty’s Stationery Office. Christl SU, Scheppach W & Kasper H (1995) Hydrogen metabolism in the large-intestine – physiology and clinical implications. Z Gastroenterol 33, 408 –413. Hungate RE (1966) The Rumen and its Microbes. London and New York: Academic Press.
20.
21.
22.
23.
24.
25.
26.
27.
28.
29.
30.
31.
32.
33.
34.
35.
36.
37.
38.
van Zijderveld SM, Gerrits WJJ, Dijkstra J, et al. (2011) Persistency of methane mitigation by dietary nitrate supplementation in dairy cows. J Dairy Sci 94, 4028 – 4038. Hillman K, Lloyd D & Williams AG (1985) Use of a portable quadrupole mass-spectrometer for the measurement of dissolved-gas concentrations in ovine rumen liquor in situ. Current Microbiol 12, 335– 339. Barry TN, Thompson A & Armstrong DG (1977) Rumen fermentation studies on 2 contrasting diets. 1. Some characteristics of in vivo fermentation, with special reference to composition of gas-phase, oxidation –reduction state and volatile fatty-acid proportions. J Agric Sci 89, 183– 195. Robinson JA, Strayer RF & Tiedje JM (1981) Method for measuring dissolved hydrogen in anaerobic ecosystems – application to the rumen. Appl Environ Microbiol 41, 545– 548. Smolenski WJ & Robinson JA (1988) In situ rumen hydrogen concentrations in steers fed 8 times daily, measured using a mercury reduction detector. FEMS Microbiol Ecol 53, 95– 100. Mitsumori M, Shinkai T, Takenaka A, et al. (2012) Responses in digestion, rumen fermentation and microbial populations to inhibition of methane formation by a halogenated methane analogue. Br J Nut 108, 482–491. Swainson N, Martin C, Muetzel S, et al. (2011) Hydrogen emissions from sheep: a spill-over for methanogenesis? Adv Anim Biosci 2, 531. Chagunda M, Ross D, Rooke J, et al. (2013) Measurement of enteric methane from ruminants using a hand-held laser methane detector. Acta Agric Scand A 63, 68– 75. Wang M, Janssen PH, Sun XZ, et al. (2013) A mathematical model to describe in vitro kinetics of H2 gas accumulation. Anim Feed Sci Technol 184, 1 –16. Beauchemin KA & McGinn SM (2005) Methane emissions from feedlot cattle fed barley or corn diets. J Anim Sci 83, 653– 661. Nkrumah JD, Okine EK, Mathison GW, et al. (2006) Relationships of feedlot feed efficiency, performance, and feeding behavior with metabolic rate, methane production, and energy partitioning in beef cattle. J Anim Sci 84, 145– 153. Lovett D, Lovell S, Stack L, et al. (2003) Effect of forage/ concentrate ratio and dietary coconut oil level on methane output and performance of finishing beef heifers. Livest Prod Sci 84, 135– 146. Doreau M, van der Werf HMG, Micol D, et al. (2011) Enteric methane production and greenhouse gases balance of diets differing in concentrate in the fattening phase of a beef production system. J Anim Sci 89, 2518 – 2528. Roehe R, Rooke JA, Duthie C-A, et al. (2013) The influence of sire effects on methane emissions from finishing beef cattle in an experiment using divergent sire breed and diets. Adv Anim Biosci 4, 25. Whitford MF, Forster RJ, Beard CE, et al. (1998) Phylogenetic analysis of rumen bacteria by comparative sequence analysis of cloned 16S rRNA genes. Anaerobe 4, 153–163. Tajima K, Aminov RI, Nagamine T, et al. (1999) Rumen bacterial diversity as determined by sequence analysis of 16S rDNA libraries. FEMS Microbiol Ecol 29, 159– 169. Edwards JE, McEwan NR, Travis AJ, et al. (2004) 16S rDNA library-based analysis of ruminal bacterial diversity. Anton Leeuw Int J Gen Mol Microbiol 86, 263–281. Stewart CS, Flint HJ & Bryant MP (1997) The rumen bacteria. In The Rumen Microbial Ecosystem, pp. 10– 72 [PN Hobson and CS Stewart, editors]. London: Chapman and Hall. Williams AG & Coleman GS (1992) The Rumen Protozoa. New York, NY: Springer-Verlag.
Hydrogen and methane emissions from beef cattle 39.
40.
41.
42.
British Journal of Nutrition
43.
Danielsson R, Schnurer A, Arthurson V, et al. (2012) Methanogenic population and CH4 production in Swedish dairy cows fed different levels of forage. Appl Environ Microbiol 78, 6172 –6179. Lillis L, Boots B, Kenny DA, et al. (2011) The effect of dietary concentrate and soya oil inclusion on microbial diversity in the rumen of cattle. J Appl Microbiol 111, 1426 – 1435. Popova M, Martin C, Eugene M, et al. (2011) Effect of fibreand starch-rich finishing diets on methanogenic Archaea diversity and activity in the rumen of feedlot bulls. Anim Feed Sci Technol 166-167, 113 – 121. Carberry CA, Kenny DA, Han S, et al. (2012) Effect of phenotypic residual feed intake and dietary forage content on the rumen microbial community of beef cattle. Appl Environ Microbiol 78, 4949– 4958. Yarlett N, Coleman GS, Williams AG, et al. (1984) Hydrogenosomes in known species of rumen entodiniomorphid protozoa. FEMS Microbiol Lett 21, 15– 19.
44.
45.
46.
47.
48.
407
Morgavi DP, Forano E, Martin C, et al. (2010) Microbial ecosystem and methanogenesis in ruminants. Animal 4, 1024 –1036. Hegarty R, Goopy J, Herd R, et al. (2007) Cattle selected for lower residual feed intake have reduced daily methane production. J Anim Sci 85, 1479 – 1486. Weimer PJ, Stevenson DM, Mantovani HC, et al. (2010) Host specificity of the ruminal bacterial community in the dairy cow following near-total exchange of ruminal contents. J Dairy Sci 93, 5902 – 5912. King EE, Smith RP, St-Pierre B, et al. (2011) Differences in the rumen methanogen populations of lactating Jersey and Holstein dairy cows under the same diet regimen. Appl Environ Microbiol 77, 5682– 5687. Derwent R, Simmonds P, O’Doherty S, et al. (2006) Global environmental impacts of the hydrogen economy. Int J Nucl Hydrogen Prod Appl 1, 57– 67.