Building A Neuro-Fuzzy Based Route Choice Model in. Metropolitan Context: Surat City in India. Sowjanya Dhulipala a, Ashu S. Kedia b, P. S. Salini c, B. K. Katti ...
Available online at www.sciencedirect.com Available online at www.sciencedirect.com
ScienceDirect ScienceDirect Available online at www.sciencedirect.com Transportation Research Procedia 00 (2017) 000–000 Transportation Research Procedia 00 (2017) 000–000
ScienceDirect
www.elsevier.com/locate/procedia www.elsevier.com/locate/procedia
Transportation Research Procedia 25C (2017) 3207–3223 www.elsevier.com/locate/procedia
World Conference on Transport Research - WCTR 2016 Shanghai. 10-15 July 2016 World Conference on Transport Research - WCTR 2016 Shanghai. 10-15 July 2016
Building Building A A Neuro-Fuzzy Neuro-Fuzzy Based Based Route Route Choice Choice Model Model in in Metropolitan Context: Surat City in India Metropolitan Context: Surat City in India Sowjanya Dhulipala aa, Ashu S. Kedia bb, P. S. Salini cc, B. K. Katti dd Sowjanya Dhulipala , Ashu S. Kedia , P. S. Salini , B. K. Katti a,b,c
P.G. Student, Civil Engineering Department, SVNIT, Surat, Gujarat, India – 395007 P.G. Professor, Student, Civil Visiting CivilEngineering EngineeringDepartment, Department,SVNIT, SVNIT,Surat, Surat,Gujarat, Gujarat,India India– -395007 395007 d Visiting Professor, Civil Engineering Department, SVNIT, Surat, Gujarat, India - 395007 d a,b,c
Abstract Abstract The study presents the route choice behaviour among three alternative routes for a set of origin and destination points of Surat, a The study presents routeTravel choicetime, behaviour threelevel alternative routes for a set of origin points of Surat, metropolitan city ofthe India. traffic among congestion and environmental effects alongand thedestination routes are considered as thea metropolitan of India. congestion mixed level and environmental along the routes considered as the main decisivecity factors for theTravel route time, choicetraffic in metropolitan traffic environment.effects The neuro-fuzzy hybridareapproach is used in main for thecouples route choice in metropolitan mixed traffic environment. Thecapabilities neuro-fuzzy approach is used in modeldecisive buildingfactors here, which the traditional fuzzy logic with neural nets’ training to hybrid compose the fuzzy logic’s model building the traditional fuzzy logic neural model nets’ training capabilities to compose the fuzzy knowledge basehere, and which fuzzy couples sets’ parameters optimally. The with developed has shown improved results over basiclogic’s fuzzy knowledge and the fuzzy sets’ parameters optimally.and The developed has behaviour shown improved results over basic fuzzy modelling tobase address uncertainty in choice decisions is able to mapmodel the choice in a realistic way. modelling to address the uncertainty in choice decisions and is able to map the choice behaviour in a realistic way. © 2017 2017 The The Authors. Published Published by by Elsevier Elsevier B.V. B.V. © © 2017 The Authors. Authors. Published by Peer-review under responsibility responsibility of Elsevier WORLDB.V. CONFERENCE ON ON TRANSPORT TRANSPORT RESEARCH RESEARCH SOCIETY. SOCIETY. Peer-review under of WORLD CONFERENCE Peer-review under responsibility of WORLD CONFERENCE ON TRANSPORT RESEARCH SOCIETY. Keywords: Neuro-Fuzzy; Route Choice; Travel time; Traffic congestion level; Environmental effects Keywords: Neuro-Fuzzy; Route Choice; Travel time; Traffic congestion level; Environmental effects
1. Introduction 1. Introduction Traffic assignment is considered as the last and critical phase in the four step urban travel demand forecasting TrafficRoute assignment is considered the lastassignment and critical phase in Modelling the four step urban travel demand forecasting process. choice forms the base as of traffic processes. route choice behaviour is essential to process. Route choice forms the base of traffic assignment processes. Modelling route choice behaviour is essential to predict travellers’ behaviour under varying traffic scenarios. The most existing route choice models owe to random predict travellers’ behaviour varying traffic scenarios. The most existing route choice models owe of to the random utility maximisation in Logitunder or Probit form. Using the utility concept, these models offer the selection best utility maximisation in Logit or Probit form. Using the utility concept, these models offer the selection of the best alternative that provides the highest utility among the choice alternatives. The lack of the ability of traditional random alternative thattoprovides thevagueness highest utility among theinvolved choice alternatives. The lack ofleads the ability traditional random utility models consider and ambiguity in human perception one toofuse fuzzy logic and utility models to consider vagueness and ambiguity involved in human perception leads one to use fuzzy logic and approximate reasoning. Zadeh’s Fuzzy Logic has offered analysts a powerful tool to deal with such uncertain approximate reasoning.theZadeh’s Fuzzy Logic has offered analysts a powerful tooldiscrete to dealchoice with such uncertain situations. It alleviates limitations of the distribution functions of the conventional models. Fuzzy situations. It alleviates the limitations of the distribution functions of the conventional discrete choice models. Fuzzy logic can be used effectively in capturing the variability of the travellers’ appraisal of the different route attributes, as logic can used effectively capturing the variability of have the travellers’ of the different route attributes, as well as thebevariability in theirin route preference. Road users subjectiveappraisal information about the parameters on route well as the variability in their route preference. Road users have subjective information about the parameters on route 2214-241X © 2017 The Authors. Published by Elsevier B.V. 2214-241X 2017responsibility The Authors.of Published Elsevier B.V. ON TRANSPORT RESEARCH SOCIETY. Peer-review©under WORLDbyCONFERENCE Peer-review under responsibility of WORLD CONFERENCE ON TRANSPORT RESEARCH SOCIETY.
2352-1465 © 2017 The Authors. Published by Elsevier B.V. Peer-review under responsibility of WORLD CONFERENCE ON TRANSPORT RESEARCH SOCIETY. 10.1016/j.trpro.2017.05.363
3208
Sowjanya Dhulipala et al. / Transportation Research Procedia 25C (2017) 3207–3223 Author name / Transportation Research Procedia 00 (2017) 000–000
2
choice and perceptions are different resulting in uncertainty about the attribute values. The perceptions may vary from each road user. Mostly, the route choice attributes are of linguistic and qualitative expressions such as very less congestion, very good environment etc. Neuro-fuzzy approach is a hybrid approach proposed by J. S. R. Jang. It refers to combination of fuzzy logic and artificial neural networks. Neuro-fuzzy hybridization results in a hybrid intelligent system that synergizes these two techniques by combining the human-like reasoning style of fuzzy systems with the learning and connectionist structure of neural networks. Neuro-fuzzy hybridization is widely termed as Fuzzy Neural Network (FNN) or Neuro-Fuzzy System (NFS). The Neuro-Fuzzy systems are generally addressed as ANFIS, which stands for Adaptive Neuro-Fuzzy Inference System. The neuro-adaptive learning method works similarly to that of neural networks. It provides a method for the fuzzy modelling procedure to learn information about a data set and provide better results. In the present study, the route choice model is developed using neuro-fuzzy approach to tackle the urban route choice behaviour in the metropolitan context. Mixed traffic prevails on most of the Indian urban roads comprising two-wheelers, auto-rickshaws, cars, vans, buses etc. The traffic flow does not follow lane discipline but move together and passing of faster vehicles takes place whenever there is scope in traffic stream. Two-wheelers and Cars are most predominant in the traffic stream to an extent of 70% to 80%. Therefore, an attempt is made to develop Route Choice Model from Two Wheeler and Car Riders’ point of view for the peak traffic and off-peak traffic periods on three important routes between Ichchhanath in vicinity of S.V. National Institute of Technology and City Railway station with nearly 10 km separation in Surat city, India using Hybrid ANN and Fuzzy based modelling. Minimizing travel time is considered as the most important criterion affecting travellers’ route choice in most of the literature. Also, Congestion and Environmental effects are other important factors. Hence in the present study, Travel time, Traffic congestion level and Environmental Effects are considered as the decisive factors for the riders’ choice. Nomenclature NF-RCM FIS O D P OP A B C TT TC EE PB-A PB-C PC-A VL L M H VH ML LS EQ GR MG MB
Neuro-Fuzzy Route Choice Model Fuzzy Inference System Origin Destination Peak traffic period Off-peak period Route A Route B Route C Travel time Traffic congestion level Environmental effects Preference of B over A Preference of B over C Preference of C over A Very Low Low Medium High Very High Much less Less Equal Greater Much Greater Much Better
Sowjanya Dhulipala et al. / Transportation Research Procedia 25C (2017) 3207–3223� Author name / Transportation Research Procedia 00 (2017) 000–000
BR PR MP
3209 3
Better Poor Much Poor
2. Background Literature: Modelling route choice behaviour is quite complex, it is essential to appraise travellers’ perceptions of route characteristics, to forecast their moves under varied traffic scenarios. A number of studies conducted in the past on route choice mainly considered modelling of preferences towards different routes, based on Random Utility Maximization (RUM) through Logit and Probit modelling [Prashker et al. (2007), Prato (2009), Akiva et al. (1985) and Bekhor et al. (2002)]. However, these models do not fully take into account the vagueness prevailing in decision makers’ perceptions on travel attributes. Fuzzy Logic (FL) concept was introduced by Zadeh (1965). A method of generating fuzzy rules from the numerical data was demonstrated by Wang and Mendel (1992), which facilitated the combination of numerical as well as linguistic information into a common assembly – fuzzy rule base. Teodorovic and Kikuchi (1990) were the first to attempt to model the route choice process using concept from fuzzy logic. An approximate reasoning route choice model has been formulated by generating perceived travel times, assuming that the perceived travel times are normally distributed around previously defined travel times. They obtained the preference strengths of each driver for a binary route choice case. Furthermore, they also successfully developed a network loading mechanism for their model. Another study on fuzzy logic based route choice behaviour modelling came from the attempts of Lotan and Koutsopolous (1992, 1993). Akiyama and Tsuboi (1996) demonstrated multistage approximate reasoning structure to capture drivers’ decision-making process on route choice behaviour. Teodorovic (1999) emphasized on the importance of fuzzy logic systems as universal approximators in solving traffic and transportation problems. His research work threw light on the use of fuzzy rule base system for modelling the uncertain behaviour of travellers towards route choice and concluded fuzzy logic to be very promising mathematical approach to model the choice behaviour characterized by imprecision, subjectivity, ambiguity, and uncertainty. Vincent Henn (2000) proposed a new route choice model taking account of the imprecisions and the uncertainties lying in the dynamic choice process. A basic assumption here was that drivers choose a path all the more than it is foreseen to have a lesser cost. The predicted cost for each path is modelled by a fuzzy subset which can represent imprecision on network knowledge as well as uncertainty on traffic conditions. The fuzzy choice model was compared with the LOGIT model. The effect of Advanced Travellers Information Systems (ATIS) on drivers is modelled as a modification of the imprecision or the uncertainty of the predicted cost of a route. Ridwan (2004) introduced a fuzzy preference based model, FiPV (Fuzzy traveller preference) of route choice considering the spatial knowledge of individual travellers. It was argued that travellers do not or cannot always follow the utility maximization principle. Therefore, a formulation of a model that also takes into account the travellers with non-maximizing behaviour was floated. Murat and Uludag (2008) presented route choice model of transportation network in Denizli, Turkey using fuzzy logic model (FLM) and logistic regression model (LRM). Travel time, traffic safety, congestion and environmental effects were considered as the parameters affecting the choice of route. A comparative study on fuzzy logic model (FLM) and logistic regression model (LRM) was realized with encouraging outcomes in favour of fuzzy modelling. Furthermore, researchers have sought to hybrid techniques to enhance the computing systems. Hawas (2002, 2004) provided the calibration methodology of Neuro-Fuzzy logic for route choice behaviour modelling. The structure of the fuzzy logic, the calibration of the membership function, and the composition of the knowledge base and logic training were attempted. Vythoulkas and Koutsopoulos (2003) modelled the choice behaviour using concepts from fuzzy sets and approximate reasoning. They assumed that individuals make their choices based on simple rules relating perceptions (of the attributes of the available alternatives) to preferences (towards them) both of which are modelled using fuzzy sets. They incorporated rule weights which capture the importance of a particular rule in the decision process and presented an approach for calibrating the weights using concepts from neural networks. Arslan and Khisty (2005, 2006) put forward a psychometric approach for making possible more proper description of route choice behaviour in transportation systems. They proposed a hybrid model that uses concepts from fuzzy logic and analytical
3210
Sowjanya Dhulipala et al. / Transportation Research Procedia 25C (2017) 3207–3223 Author name / Transportation Research Procedia 00 (2017) 000–000
4
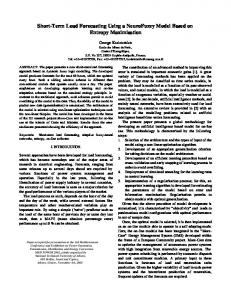
hierarchy process (AHP). Based on Weber’s psycho-physical law of 1834, they developed a set of fuzzy ‘if–then’ rules to represent a typical driver’s psychology for capturing essential preferences, pairwise, among the alternatives that a driver may consider and incorporated AHP to represent the underlying decision mechanism and to estimate drivers’ preference allotment among the alternatives. Their findings showed that the method provided intuitively promising results. Lee (2010) used a hybrid approach to model route choice behaviour considering randomness and vagueness. They developed a latent class multinomial logit (LCML) model to consider the heterogeneity among drivers and a fuzzy based model was developed to consider the vagueness of driver perceptions. The perceived levels of travel time of drivers and the linguistic information such as light congestion and heavy congestion for road networks were dealt in the fuzzy model. Dubey et al. (2013) dealt with route choice preference using fuzzy rule based inference system (FIS) and adaptive neuro-fuzzy inference system (ANFIS) for modelling. They stated that ANFIS has an advantage over FIS as it gives approximately similar results with almost half of number of membership functions, for a particular variable. Also, it requires less number of rules as compared to FIS. They found fuzzy and ANN based models better from behavioural point of view than Random Utility Models. Hybrid approaches such as neuro-fuzzy and genetic-fuzzy etc. have scope to improvise the performance of behavioural models and can guide the transport planners in strategic transport development. The route selection under different traffic scenarios in a day, for twowheelers and car users need to be analyzed in detail on hybrid neuro-fuzzy base and the same is attempted here taking a case of typical routes in fast developing Indian metropolitan Surat city. 3. The data Surat, a fast growing metropolitan city of Gujarat state in India is considered for the present study to model the route choice problem. Three alternative routes A, B and C between Ichchhanath (Origin area ‘O’) and City Railway station (Destination area ‘D’) are considered. Route A is passing through Central Business District (CBD) and 60% of the route is characterized with commercial activities along it. The other two routes have six lane partial ring roads. Route C is passing through residential and commercial area and joining the route B. OSPD forms Route A, whereas OSPQD pertains to Route B. OSQD forms the Route C. (Figure 1).
Figure 1 Map showing study routes Road-side interview survey has been conducted at the origin area with the predesigned questionnaire and nearly 500 samples have been collected. Travel time, traffic congestion level and environmental effects are considered as the decisive factors for the choice of route. Riders are asked for their perceptions about the three attributes along all the three routes. Travel time is noted in minutes, traffic congestion level and environmental effects are noted in terms of
Sowjanya Dhulipala et al. / Transportation Research Procedia 25C (2017) 3207–3223� Author name / Transportation Research Procedia 00 (2017) 000–000
3211 5
rating on a scale of 1-5. Table 1 shows the rating scale and the corresponding traffic congestion levels and environmental effects. The preference values of each route are obtained in percentages from each rider interviewed. The data is collected for both traffic peak and off-peak periods. Table 1 Attribute Ratings Rating on scale
Traffic congestion level
Environmental effects
1 2 3 4 5
Very low Low Medium High Very high
Very good Good Medium Poor Very poor
4. Model framework Neuro-fuzzy Route Choice models (NF-RCMs) have been developed for Two-Wheelers and Cars for traffic peak and off-peak situations. The model is developed over a comparative platform where the perceptions of riders about three attributes of the alternative routes are compared. The model comprises of three comparative sub-models between three routes A, B and C. • • •
B-A sub-model B-C sub-model C-A sub-model
Here, all the riders are considered for their options of ‘A’ or ‘B’ routes, by supporting their choice of ‘C’ route. Therefore, these both groups are further subjected for choice of ‘C’ route through ‘B-C’ and ‘C-A’ sub-models as shown in Figure 2 to get clear picture of choice of all the three routes. Riders’ options for ‘C’ routes are summed up from both groups.
Total Riders
B-A sub-model Group I Riders opting B
Group II Riders opting A
B-C sub-model
C-A sub-model
Riders opting B
Riders opting C
Riders opting C
Figure 2 Hierarchy of Modelling framework
Riders opting A
Sowjanya Dhulipala et al. / Transportation Research Procedia 25C (2017) 3207–3223 Author name / Transportation Research Procedia 00 (2017) 000–000
3212
6
4.1 Neuro-fuzzy model structure The structure of Neuro-fuzzy system is shown in Figure 3.
Figure 3 Structure of Neuro-fuzzy system •
Membership functions
The triangular membership functions are generated by the ANFIS. The parameters associated with the membership functions change through the learning process. The computation of these parameters (or their adjustment) is facilitated by a gradient vector. This gradient vector provides a measure of how well the fuzzy inference system is modelling the input/output data for a given set of parameters. When the gradient vector is obtained, any of several optimization routines can be applied in order to adjust the parameters to reduce some error measure. This error measure is usually defined by the sum of the squared difference between actual and desired outputs. The combination of least squares estimation and back-propagation is used for membership function parameter estimation. Triangular membership functions are framed for all the input variables. The output membership functions are in linear form. •
Generating FIS and training
The fuzzy inference system (FIS) is generated by using Adaptive Neuro-Fuzzy Inference System (ANFIS) tool. The technique used is grid partition method. The type of fuzzy inference system adopted is Sugeno-type. Number of membership functions selected for all the inputs are five and triangular. The output membership function is a linear membership function in Sugeno type. The FIS is generated and trained with the provided input/output training data. The optimisation technique used for training purpose is “hybrid” which includes combination of least squares estimation and back propagation technique. The training data include differences between the travel times, traffic congestion levels and environmental effects of two routes at a time, and output is the observed preference score of one route over the other. •
If-Then rules
A total of 125 If-Then rules are derived based on observed data to map the three inputs in 5 levels of MFs and outputs. Defuzzification process is done to convert the fuzzy outputs to the crisp values. The method adopted here for the defuzzification process is weighted average method. 5. NF-RCM-P-TW Neuro-fuzzy route choice model for the mode Two-Wheeler has been developed here for the peak traffic situation with the perception data of two-wheeler riders during peak traffic period which is contributing 70% of the data collected. 5.1 B-A Sub-model
Author name / Transportation Research Procedia 00 (2017) 000–000 Sowjanya Dhulipala et al. / Transportation Research Procedia 25C (2017) 3207–3223�
•
7 3213
Model inputs and outputs
The inputs for the model are differences between the travel times, traffic congestion levels, environmental effects of routes A and B. Travel Time (TT) are noted in minutes whereas Traffic Congestion (TC) and Environmental Effects (EE) are of ratings in 1-5 scale. The output of the model is preference of route B over route A in percentage provided by the riders. These inputs and outputs are considered in the form of five fuzzy sets as given in Table 2. The preference data of all the riders is provided for modelling and the distribution of the riders among route A and B is obtained in two groups. Group I and Group II need further testing for choice of route C. Table 2. Fuzzy sets for the input and output variables Travel time Much Less (ML) Less (LS) Equal (EQ) Greater (GR) Much Greater (MG) •
Traffic Congestion level Much Less (ML) Less (LS) Equal (EQ) Greater (GR) Much Greater (MG)
Environmental effect Much Better (MB) Better (BR) Equal (EQ) Poor (PR) Much Poor (MP)
Preference of B over A Very High (VH) High (H) Medium (M) Low (L) Very Low (VL)
Membership functions
Five triangular membership functions are framed for each input variable by the Neuro-fuzzy system and the ranges of the membership functions are given in Tables 3a to 3c. The shapes of membership functions for the input parameters are shown in Figure 4a to 4c. ANFIS decides suitable ranges for the attributes for five levels. Table 3a. Differences in Travel times MF ML LS EQ GR MG
Table 3b. Differences in Traffic congestion levels
Range [-67.5-45 -22.53] [-45 -22.5 -0.363] [-22.2 0.238 22.7] [0 22.5 45] [22.7 45.2 67.7]
MF ML LS EQ GR MG
Table 3c. Differences in Environmental Effects MF MB BR EQ PR MP
Range [-4.25 -2.99 -1.73] [-2.99 -1.75 -0.51] [-1.74 -0.508 0.756] [-0.515 0.737 1.99] [0.741 1.99 3.25]
Range [-6 -3.99 -2] [-4 -2.01 -0.126] [-1.99 -0.02 2] [-0.07 2.02 4.02] [2.001 4 6]
Author Dhulipala name / Transportation Research Research Procedia Procedia 00 (2017)25C 000–000 Sowjanya et al. / Transportation (2017) 3207–3223
3214
Figure 4a MFs of input variable: TT
8
Figure 4b MFs of input variable: TC
Figure 4c MFs of input variable: EE •
Outcome of B-A sub-model
The output of the model is the preference of route B over route A in percentage. The scores out of 100 are obtained as percentage preference from the model. The root mean square error (RMSE) value of B-A sub-model is 10.4422. The cut-off value is taken as 50% where the riders opt route B if the percentage preference value is greater than 50 and route A if it is less than 50. Thus the riders are distributed among Group I and Group II based on the percentage preference score. Therefore the outcome of the model is the distribution of riders among A and B and is given in Table 4. Table 4 Outcome of B-A sub-model Route Riders (no.s) Riders (%) Group I 197 78.8 Group II 53 21.2 Total 250 100 Now, Group I and II are further subjected to analysis in B-C sub-model and C-A sub-model as under. 5.2 B-C Sub-model •
Membership functions
The ranges of Triangular membership functions formed for the input variables of B-C sub-model are shown in Tables 5a to 5c.
Author Dhulipala name / Transportation Research Research Procedia Procedia 00 (2017)25C 000–000 Sowjanya et al. / Transportation (2017) 3207–3223�
Table 5a. Input Variable: Differences in Travel times MF ML LS EQ GR MG
32159
Table 5b. Input Variable: Differences in Traffic congestion levels
Range [-55 -35 -15] [-35 -15 5.073] [-15.12 5 25] [5 25 45] [24.98 45 65]
MF ML LS EQ GR MG
Range [-6 -4 -2.1] [-4 -2.002 0] [-2 0 2] [0 2 4] [2 4 6]
Table 5c. Input Variable: Differences in Environmental Effects MF MB BR EQ PR MP •
Range [-3.25 -2 -0.75] [-2 -0.74 0.5] [-0.74 0.5 1.75] [0.5 1.75 3] [1.75 3 4.25]
Outcome of B-C sub-model
The output of the model is the preference of route B over route C in percentage. The scores out of 100 are obtained as percentage preference from the model. The root mean square error (RMSE) value of B-C sub-model is 9.517. Therefore the outcome of the model is the distribution of riders among B and C and is given in Table 6. Table 6. Outcome of B-C sub-model Route B C Total
Riders (no.s) 119 78 197* * From B-A model output
Riders (%) 60.4 39.6 100
5.3 C-A Sub-model •
Membership functions
The ranges of membership functions formed for the input variables of B-C sub-model are given in Tables 7a to 7c. Table 7a. Input Variable: Differences in Travel times MF ML LS EQ GR MG
Range [-55 -35 -15] [-34.8 -14.8 5.22] [-15 4.99 25.01] [5.22 25.2 45.2] [24.6 44.8 64.8]
Table 7b. Input Variable: Differences in Traffic congestion levels MF ML LS EQ GR MG
Range [-6 -4 -2] [-4 -2 0] [-1.98 0 2.02] [0 2.02 4.02] [2 4 6]
Author Dhulipala name / Transportation Research Research Procedia Procedia 00 (2017)25C 000–000 Sowjanya et al. / Transportation (2017) 3207–3223
3216
10
Table 7c. Input Variable: Differences in Environmental Effects MF MB BR EQ PR MP •
Range [-4.25 -3 -1.75] [-3 -1.75 -0.5] [-1.75 -0.5 0.75] [-0.5 0.75 2] [0.75 2 3.25]
Outcome of C-A sub-model
The output of the model is the preference of route B over route C in percentage. The scores out of 100 are obtained as percentage preference from the model. The root mean square error (RMSE) value of B-C sub-model is 3.47. Therefore the outcome of the model is the distribution of riders among A and C and is given in Table 8. Table 8. Outcome of C-A sub-model Route A C Total
Riders (no.s) 37 16 53* * From B-A model output
Riders (%) 69.81 30.19 100
5.4 Outcome of NF-RCM-P-TW Based on the above three sub-models, the riders are distributed among the three routes as provided in Table 9. The model is able to predict the choice of the riders with good accuracy. The cross-classification table (Table 10) is showing the accuracy of the model which is quite good. Table 9. Outcome of NF-RCM-P-TW Route A B C Total
Riders (no.s) 37 119 94 (78+16) 250
Riders (%) 14.8 47.6 37.6 100
Observed No. of samples
Table 10. Cross-classification table showing prediction accuracy of the model
A B C Total
Predicted No. of samples A B 37 0 0 116 0 3 37 119
𝑃𝑃𝑃𝑃𝑃𝑃𝑃𝑃𝑃𝑃𝑃𝑃𝑃𝑃𝑃𝑃𝑃𝑃𝑃𝑃 𝑎𝑎𝑎𝑎𝑎𝑎𝑎𝑎𝑎𝑎𝑎𝑎𝑎𝑎𝑎𝑎 =
C 0 3 91 94
37 + 116 + 91 ×100 = 97.6 % 250
Total 37 119 94 250
Sowjanya Dhulipala et al. / Transportation Research Procedia 25C (2017) 3207–3223� Author name / Transportation Research Procedia 00 (2017) 000–000
3217 11
5.5 Validation of the model From the collected data of 350 riders, nearly 70% is used for calibration of the model and the rest is used for validation. The validation accuracy of the model is given in Table 11 which is as good as calibration.
Observed No. of samples
Table 11. Cross-classification table showing prediction accuracy for validation data set Predicted No. of samples A B 12 0 0 59 0 3 12 62
A B C Total
𝑃𝑃𝑃𝑃𝑃𝑃𝑃𝑃𝑃𝑃𝑃𝑃𝑃𝑃𝑃𝑃𝑃𝑃𝑃𝑃 𝑎𝑎𝑎𝑎𝑎𝑎𝑎𝑎𝑎𝑎𝑎𝑎𝑎𝑎𝑎𝑎 =
5.6 Comparison of Observed and Modelled outputs
C 0 0 29 29
Total 12 59 32 103
12 + 59 + 29 ×100 = 97.08 % 103
Observed and modelled route choices are compared to analyze the prediction power of the developed model. The choices i.e. the percentage of riders opting route A, B and C based on model and the field observed are very closer. The comparison is shown in Table 12. Table 12. Comparison of route wise observed and modelled route choice preferences Percentage of travellers Observed Modelled 14.8 14.8 47.6 47.6 37.6 37.6 100 100
Route A B C Total 6. NF-RCM-P-CAR
Neuro-fuzzy route choice model for the mode car was developed here for the peak traffic situation with the perception data of car riders during peak traffic period which is contributing 30% of the data collected. Similar to NFRCM-P-TW, the model is developed over a comparative platform. The outcomes of each sub-model developed are provided in Tables 13a to 13c. Table 13a. Outcome of B-A sub-model Route A B Total
Riders (no.) 38 110 148
Riders (%) 25.68 74.32 100
Table 13b. Outcome of B-C sub-model Route B C Total
Riders (no.) 83 27 110
Riders (%) 75.45 24.55 100
Sowjanya Dhulipala et al. / Transportation Research Procedia 25C (2017) 3207–3223 Author name / Transportation Research Procedia 00 (2017) 000–000
3218
12
Table 13c. Outcome of C-A sub-model Route A C Total
Riders (no.s) 20 18 38
Riders (%) 52.63 47.37 100
6.1 Outcome of NF-RCM-P-CAR Based on the above three sub-models the outcome of the model is as in the Table 14. The prediction accuracy of the model is shown in the cross-classification table (Table 15). The accuracy of the model is quite good so as to model the choice outcomes. Table 14. Outcome of NF-RCM-P-CAR Route A B C Total
Riders (no.s) 20 83 45 (27+18) 148
Riders (%) 13.52 56.08 30.40 100
Observed No. of samples
Table 15. Cross-classification table showing prediction accuracy of NF-RCM-P-CAR
A B C Total
Predicted No. of samples A B C 19 1 2 0 79 1 1 3 42 20 83 45
𝑃𝑃𝑃𝑃𝑃𝑃𝑃𝑃𝑃𝑃𝑃𝑃𝑃𝑃𝑃𝑃𝑃𝑃𝑃𝑃 𝑎𝑎𝑎𝑎𝑎𝑎𝑎𝑎𝑎𝑎𝑎𝑎𝑎𝑎𝑎𝑎 = 6.2 Comparison of Observed and Modelled outputs
Total 22 80 46 148
19 + 79 + 42 ×100 = 94.59% 148
The percentage of travelers distributed among the three routes and the comparison of observed and modelled route choice preferences is shown in Table 16. The comparison shows that the observed and modelled preferences are closer and model is able to map the outcomes in a reasonable way. Table 16. Comparison of observed and modelled route choice Route A B C Total
Percentage of travellers Observed Modelled 14.87 13.52 54.05 56.08 31.08 30.40 100 100
Sowjanya Dhulipala et al. / Transportation Research Procedia 25C (2017) 3207–3223� Author name / Transportation Research Procedia 00 (2017) 000–000
3219 13
7. NF-RCM-OP-TW Neuro-fuzzy route choice model for the mode two-wheeler was developed here for the off-peak period with the perception data of two-wheeler riders during off-peak traffic period which is contributing 70% of the data collected. Similar to NF-RCM-P-TW, the model is developed over a comparative platform. 70% of the data is used for calibration and the rest is used for validation purpose. The outcome of the model is given in Table 17. The prediction accuracy of the model is shown in Table 18 and comparison of route wise observed and modelled route choices is given in Tables 19. Table 17. Outcome of NF-RCM-OP-TW Route A B C Total
Riders (no.s) 45 129 76 (71+5) 250
Riders (%) 18 51.6 30.4 100
Observed No. of samples
Table 18. Cross-classification table showing prediction accuracy of NF-RCM-OP-TW
A B C Total
Predicted No. of samples A B 43 3 1 112 1 14 45 129
𝑃𝑃𝑃𝑃𝑃𝑃𝑃𝑃𝑃𝑃𝑃𝑃𝑃𝑃𝑃𝑃𝑃𝑃𝑃𝑃 𝑎𝑎𝑎𝑎𝑎𝑎𝑎𝑎𝑎𝑎𝑎𝑎𝑎𝑎𝑎𝑎 =
C 0 4 72 76
Total 43 117 87 250
43 + 112 + 72 = 90.8% 250
Table 19. Comparison of route wise observed and modelled choices Route A B C Total
Percentage of travellers Observed Modelled 18.4 18 46.8 51.6 34.8 30.4 100 100
8. NF-RCM-OP-CAR Neuro-fuzzy route choice model for the mode car was developed here for the off-peak period with the perception data of car riders during off-peak traffic period which is contributing 30% of the data collected. Similar to NF-RCMP-TW, the model is developed over a comparative platform. The outcome of the model and accuracy are given in Table 20 and 21 respectively. Comparison of observed and modelled route choices is shown in Table 22.
Sowjanya Dhulipala et al. / Transportation Research Procedia 25C (2017) 3207–3223 Author name / Transportation Research Procedia 00 (2017) 000–000
3220
14
Table 20. Outcome of NF-RCM-OP-CAR Route A B C Total
Riders (no.s) 24 74 54 (45+9) 152
Riders (%) 15.79 48.68 35.53 100
Observed No. of samples
Table 21. Cross-classification table showing prediction accuracy
A
Predicted No. of samples A B C 23 8 5
Total 36
B
1
60
6
67
C Total
0 24
6 74
43 54
49 152
𝑃𝑃𝑃𝑃𝑃𝑃𝑃𝑃𝑃𝑃𝑃𝑃𝑃𝑃𝑃𝑃𝑃𝑃𝑃𝑃 𝑎𝑎𝑎𝑎𝑎𝑎𝑎𝑎𝑎𝑎𝑎𝑎𝑎𝑎𝑎𝑎 =
23 + 60 + 43 ×100 = 82.89% 152
Table 22. Comparison of observed and modelled route choices Percentage of travellers Route Observed Modelled A 23.68 15.79 B 44.08 48.68 C 32.24 35.53 Total 100 100 9. Route Choice behavior 9.1 Mode wise •
During peak traffic situation
The comparison of choice towards different routes between the designated O-D pair, pertaining to two-wheeler and car users in peak traffic situation is shown in Figure 9a. During peak timings, major share of both car and two-wheeler riders are observed to prefer Route B due to consecutive flyover bridges being the characteristic of that route, whereas Route A is observed to be the least preferred one owing to the narrow road width and roadside disturbances on the route. On the other hand, cars are giving lesser priority to Route C compared to two-wheelers owing to the route comprising a stretch where heavy concentration of shopping activities is prevailing, which creates several bottlenecks due to parking maneuvering exercises of cars and on-street parking on that route. •
During off-peak situation
The comparison of choice towards different routes between the designated O-D pair, pertaining to two-wheeler and car users in off-peak traffic situation is shown in Figure 9b. The order of preferences towards routes remain same, with Route B being the overall most preferred route and Route A being the least preferred one as in the case of peak traffic period. It is interesting to note the traffic impact on travel mode in case of Route B and Route C, where the dominating mode gets changed due to reduction in traffic during afternoon hours.
60 50 40 30 20 10 0
Two-wheelers Cars A
Percentage of riders
Sowjanya Dhulipala et al. / Transportation Research Procedia 25C (2017) 3207–3223� Author name / Transportation Research Procedia 00 (2017) 000–000
Percentage of riders
B C Route
Figure 9a. During Peak traffic period
60 50 40 30 20 10 0
3221 15
Two-wheelers Cars A
B C Route
Figure 9b. During off-Peak period
9.2 Traffic situation •
Two-wheeler riders
60 50 40 30 20 10 0
Peak period Off-peak period A
B C Route
Figure 10a. Two-wheeler riders •
Percentage of riders
Percentage of riders
The comparison of choices of two-wheeler riders during peak and off-peak traffic situations is shown in Figure 10a. During both peak and off-peak periods, Route B is preferred more by two-wheeler users. During off-peak period, travellers from route C are shifting to routes A and B. The shortest distance criteria of Route A, some en-route chain activities are making the riders shift to A and B.
60 50 40 30 20 10 0
Peak period Off-peak period A
B Route
C
Figure 10b. Car riders
Car riders
The comparison of choices of car riders during peak and off-peak traffic situations is shown in Figure 10b. Route B is preferred more by car users among the three routes. During off-peak period, travellers from route B are shifting to routes A and C. The shortest distance criteria of Route A, some en-route chain activities are making the riders to shift from B to A, whereas aesthetics and shopping potential of a stretch on route C is causing the riders to shift to Route C. 10. Applications of developed models The developed models find application in the traffic assignment process of the four stage modelling and network building. The outcome of the models is the percentage of travellers on each route. Therefore, the vehicular flows that are expected to come on each route can be determined. Also, the total trip flows between origin and destination can
3222
Sowjanya Dhulipala et al. / Transportation Research Procedia 25C (2017) 3207–3223 Author name / Transportation Research Procedia 00 (2017) 000–000
16
be distributed among different alternate routes based on these models. Link flows in a network can be determined which will eventually help in evaluating the deficiencies in the existing transportation system or to introduce a new transport facility. The models are used in transportation decisions such as to provide a new facility e.g. flyover or any improvement in the roadway facilities. The developed models are useful in framing of transport policies. If a particular route is improved by reducing delays along the route, improving ambience along the route, change in the behaviour of the riders towards choice of route, percentage of travellers shifting towards the improved route are expected and possible choices can be noted. In such way, the models are helpful in the assessment of the transport policies, shift of riders from one route to another, distribution of traffic among the routes and route planning etc. 11. Conclusion Here, a neuro-fuzzy system has been developed to model the choices of the travelers. A comparative approach has been followed to model the choice decisions in a realistic way as humans always have a comparative attitude towards various alternatives available. The model is framed such that the perceptions of the travelers about each two routes will be compared to make the choice. In modelling the Neuro-fuzzy system, initially, the fuzzy inference system is generated by ANFIS tool by adopting specified suitable membership functions and is trained with the target data. During the training, the parameter ranges of the membership functions will be modified so as to map the input/output data and If-Then rules are framed to match the input/output target data. Travel time, traffic congestion level and environmental effects are considered as the decisive factors for making the choice of route. These are taken on a rating scale which is in the form of a linguistic way which often refers to humans’ statements. Three alternative routes with different characteristics between an origin and destination are provided for the travelers in the choice set to make the choice decision. The inputs of the models are differences between the perception values of each attributes and the output is the percentage preference of one route over the other. The final outcomes are the percentage of travelers on each route i.e. distribution of the travelers among the three routes. The models are developed for the modes twowheeler and car which are dominating the traffic stream for peak and off-peak traffic situation. On the same data, fuzzy models were also developed and the developed neuro-fuzzy models here showed the improved accuracy over basic fuzzy models. These neuro-fuzzy models are able to predict the choice outcomes with a good accuracy and can handle the route choice decision process in a realistic way and can be employed as part of urban transportation and traffic planning package in any metropolitan city apart from its application in Traffic assignment models after due considerations of developing models for other modes on similar line. References Zadeh, L. A. 1965. Fuzzy sets, Information and Control 8(3): 338–353. http://dx.doi.org/10.1016/S00199958(65)90241-X Wang, L.X. and Mendel, J.M. (1992) ‘Generating fuzzy rules by learning from examples’, IEEE Transactions on Systems, Man and Cybernetics 22, 1414–1427. B. Lee, A. F. (2002). Route choice behaviour model considering randomness and vagueness uncertainty. Proc. 13th mini-Euro conf. Handling uncertainty in the Analysis of Traffic and Transportation Systems, (pp. 64-70). Polytechnic University of Bali, Bali, Italy. D. Teodorovic, S. K. (1990). Transportation Route choice model using Fuzzy Inference technique. Paper presented at the First international Symposium on: Uncertainty Modelling and Analysis: Fuzzy Reasoning, Probabilistic Models and Risk Management, (pp. 140-145). University of College Park, MD. Hawas, Y. E. (2002). Developing Fuzzy Route Choice Models Using Neural Nets. Intelligent Vehicle Symposium, IEEE, 71-76. Hawas, Y. E. (2004). Development and Calibration of Route Choice Utility Models. Journal of Transportation Engineering, 171-182. Henn, V. (2000). Fuzzy route choice model for traffic assignment. Fuzzy Sets and Systems, 77-101. Jang, J. S. (1993). ANFIS : Adaptive-Network-Based Fuzzy Inference. IEEE Transactions on Systems, Man and Cybernetics, 23, 665-685.
Sowjanya Dhulipala et al. / Transportation Research Procedia 25C (2017) 3207–3223� Author name / Transportation Research Procedia 00 (2017) 000–000
3223 17
Joseph N Prashker, S. B. (2004, July). Route Choice Models used in the Stochastic User Equilibrium problem: A review. Transnational Transdisplinary Journal, Transport Reviews, 24(4), 437-463. Lee, C. R. (2010). A hybrid tree approach to modelling alternate route choice behavior with online information. Journal of Intelligent Transportation systems, 14, 209-219. Lotan, T., & Koutsopolous, H. (1993). Models for route choice behavior in the presence of information using concepts from fuzzy set theory and approximate reasoning. Transportation, 20(1), 129-155. Petros C. Vythoulkas, H. N. (2003). Modeling discrete choice behavior using concepts from fuzzy set theory, approximate reasoning and neural networks. Transportation Research Part C, 11, 51-73. Prato, C. G. (2009, March). Route Choice Modelling: Past, present and future research directions. Journal of Choice Modelling, 65-100. Ridwan, M. (2004). Fuzzy preference based traffic assignment problem. Transportation Research Part C, 12, 209233. Sarkar, A. S. (2012). Application of Fuzzy Logic in Transport Planning. International Journal on Soft Computing, 3(2). Dubey, S. (2013). Route Choice Modelling Using Fuzzy logic and Adaptive Neuro-fuzzy. Modern Traffic and Transportation Engineering Research (MTTER), 11-19. T. Akiyama, H. T. (1996). Analysis of multi route choice behaviour by Fuzzy reasoning models. Proc. 3rd symposium on Application of Fuzzy Sets Theory to Civil and Architechtural Engineering, (pp. 31-38). Teodorovic, D. (1999). Fuzzy Logic Systems For Transportation Engineering: the state of the art. Transportation Research Part A, 33, 337-364. Teodorovic, D., Vukanovic, S., & Obradovic, K. (1998). Modeling route choice with advance traveler information by fuzzy logic. Transportation Planning and Technology, 22, 1-25. Turan Arslan, C. J. (2005). A rational reasoning method from fuzzy perceptions in route choice. Fuzzy Sets and Systems, 419-435. Turan Arslan, C. J. (2006). A rational approach to handling fuzzy perceptions in route choice. European Journal of Operations Research, 571-583. Wang, L. X., & Mendel, J. M. (1992). Generating fuzzy rules by learning from examples. Systems, Man and Cybernetics, IEEE Transactions, 22(6), 1414-1427. Yetis Sazi Murat, N. U. (2008, January). Route Choice Modelling in urban transportation networks using fuzzy logic and logistic regression methods. Journal of Scientific & Industrial Research, 67, 19-26.