Letters
Letters Calcium signatures are decoded by plants to give specific gene responses Introduction Calcium is a ubiquitous cellular second messenger communicating information about the outside world to plant cells. In plants, many stimuli lead to a transient rise in intracellular calcium concentration, which is thought to activate the appropriate response (McAinsh & Pittman, 2009). It is certainly vital for survival that a plant is able to respond appropriately to any given stimulus. This leads to a conundrum, however: how is the cell able to distinguish between calcium elevations elicited by different stimuli? One attractive hypothesis is that the specific characteristics of different calcium elevations (‘calcium signatures’) might encode specific information in plants (Allen et al., 2001; Love et al., 2004; Miwa et al., 2006; McAinsh & Pittman, 2009; Dodd et al., 2010; Short et al., 2012). By correlating cytosolic free calcium concentration ([Ca2+]c) signature profiles to the expression of genes, researchers have postulated that that such higher-order information is encoded in [Ca2+]c signatures produced in response to, for example, ozone (Short et al., 2012), elicitors of defence (Lecourieux et al., 2005) or nod factors (Miwa et al., 2006). [Ca2+]c signature profiles are also hypothesized to encode information that controls stomatal aperture (Allen et al., 2001). Circadian and diurnal oscillations of [Ca2+]c have also been proposed to specify information on timing of cellular processes (Love et al., 2004). We have previously demonstrated that calcium is an intermediate between stimulus perception and gene expression in a number of situations, for example oxidative stress, cold and drought (Knight et al., 1996, 1997; Clayton et al., 1999; Rentel & Knight, 2004; Whalley et al., 2011). Comparison of the specific characteristics of the calcium signatures produced by each of these different stresses shows them to be substantially different (e.g. number of phases, magnitude and duration), consistent with the idea of calcium signature-encoded stimulus-specific information. A more direct approach to correlating patterns of calcium signatures to specific responses is to test the effect of signatures that are artificially imposed on plant cells. Reports in the literature have been few, but in one study, artificially imposed [Ca2+]c oscillations were shown to be able to be decoded by guard cells, with specific frequencies and amplitudes being required to mediate closure (Allen et al., 2001). We wished to combine this powerful approach of imposing calcium signatures upon plants with global measurement of gene expression to address the broader question of whether novel calcium signatures might lead to different transcriptomic responses. As the frequency of 690 New Phytologist (2013) 197: 690–693 www.newphytologist.com
calcium oscillations has been shown to control the specificity of activation of certain transcription factors in mammalian cells (Dolmetsch et al., 1998), and oscillations in intracellular calcium have been reported in response to several stimuli in plants (Campbell et al., 1996; Moyen et al., 1998; Allen et al., 2001; Miwa et al., 2006), we hypothesized that different characteristics of calcium oscillations might define different transcriptomic responses in plants. The parameters of oscillations (amplitude, frequency and number of pulses) can be easily defined and compared, making this type of calcium signature ideal for addressing the question of whether calcium signatures can encode specificity to downstream gene expression.
Materials and Methods Plant growth and treatment Seeds of Arabidopsis thaliana (L.) Heynh. Columbia (Col-0) accession constitutively expressing apoaequorin under the 35S promoter (35S::Aeq) were obtained from Lehle Seeds (Round Rock, TX, USA) and grown as previously described (Whalley et al., 2011). Seven-day-old 35S::Aeq seedlings were reconstituted by floating on water containing 10 lM coelenterazine (stock 1% (v/v) methanol; LUX Biotechnology Ltd, Edinburgh, UK) in the dark at 21°C for 12–24 h. Seedlings were then transferred to an electroporation cuvette containing SM media (0.1 mM each of KCl, CaCl2, MgCl2), rested for at least 2 h and treated with electrical stimulation inside a dark box, and the resulting luminescence was recorded as described previously (Whalley et al., 2011). The following voltage regimes were used to produce each calcium signature (the length of the voltage pulse is shown in brackets) – signature 1: 9 V (0.5 s), 9 V (0.7 s), 10 V (0.4 s), 10 V (0.7 s), 10 V (0.7 s), 10 V (1.2 s), 10 V (1.5 s), 10 V (1.7 s), 10 V (2 s), 10 V (2.2 s); signature 2: 5 V (0.5 s), 6 V (0.5 s), 6 V (0.7 s), 6 V (0.9 s), 7 V (0.5 s), 7 V (0.5 s), 7 V (0.6 s), 7 V (0.7 s), 7 V (0.7 s), 7 V (0.8 s); signature 3: 9 V (0.5 s), 10 V (0.5 s), 10 V (0.7 s), 10 V (0.9 s), 10 V (1.2 s), 10 V (1.4 s), 10 V (1.6 s), 10 V (1.8 s), 10 V (2 s), 10 V (2.2 s). Variation in voltage magnitude and duration of pulse was needed to counteract the increasing attenuation of sensitivity of the seedlings to electrical stimulation with consecutive transients. Total aequorin for calibration was measured by freezing seedlings (Whalley et al., 2011), and this was calibrated into [Ca2+]c as described previously (Knight & Knight, 2000). Tissue was harvested by briefly drying on tissue paper and flash-freezing in liquid nitrogen 45 min after the end of each treatment. Luminescence was confirmed to be calcium-dependent by testing the effect of calcium inhibitors (e.g. see Supporting Information, Fig. S1), and the lack of artefactual luminescence of the media was tested by imaging (e.g. Fig. S2). Ó 2012 The Authors New Phytologist Ó 2012 New Phytologist Trust
New Phytologist cDNA synthesis and labelling RNA was extracted using the RNeasy Plant Total RNA kit (Qiagen) and the quality of RNA samples was assessed using an Agilent 2100 Bioanalyser (Agilent Technologies, Santa Clara, CA, USA). Between 1 and 2 lg total RNA was labelled using reverse transcriptase Superscript III (Invitrogen) and the Genisphere 3DNA 900 indirect labelling kit (Genisphere Inc., Hatfield, PA, USA). For each treatment, cDNA was labelled and hybridized twice with channel reversal on the second replicate. Microarray preparation and hybridization Microarray slides printed with the Operon Arabidopsis v3 AROS oligo set (obtained from Dr David Galbraith, University of Arizona, Tucson, AZ, USA) were baked, cross-linked, prehybridized, washed and dried, before hybridization of cDNA as previously described (Whalley et al., 2011). Hybridized slides were scanned using a Perkin Elmer ScanArray Express HT (Perkin Elmer, Wellesley, MA, USA) and the resulting image files were transferred into the analysis program BlueFuse Version 3.0 or 3.2 (BlueGnome, Cambridge, UK) and analysed as described previously (Whalley et al., 2011). Following automatic and manual exclusion of bad data spots in BlueFuse, the data were global median normalized in Excel. Data for the microarray experiments described herein are publicly available from www.ebi.ac.uk/ arrayexpress with accession number E-MEXP-2663. Analysis of 500 bp of upstream sequences (downloaded from the TAIR website: http://www.arabidopsis.org/tools/bulk/index.jsp) was performed using the oligo analysis, pattern assembly and DNA pattern matching tools available online at the Regulatory Sequence Analyses Tools site (RSAT: http://rsat.ulb.ac.be/rsat) according to the developers’ instructions (van Helden, 2003).
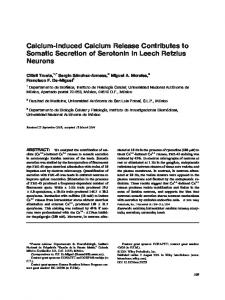
Results and Discussion Using electrical stimulation (Whalley et al., 2011), we produced three different series of 10 calcium oscillations combining two different amplitudes and two different frequencies in Arabidopsis
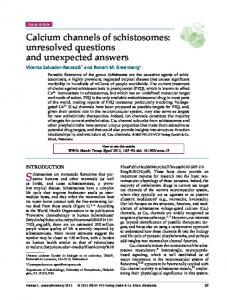
seedlings (Fig. 1). We subsequently performed whole-genome microarray analysis to identify which genes were regulated by each of the signatures. Fig. 2(a,b) shows that all three calcium signatures caused a substantial number of genes to be up- or down-regulated. The most striking observation was that the identities of the genes regulated by the three different calcium signatures were very different: 61.1, 73.7 and 79.6% of the genes up-regulated by signatures 1, 2 and 3, respectively, were unique to that signature; and 89.7, 76.0 and 93.5% of the genes down-regulated by signatures 1, 2 and 3, respectively, were unique to that signature (Fig. 2a,b; expression data for each of these six lists of genes are provided in Tables S1–S6). Given these findings, it is quite possible that different transcription factors, binding to different cis-acting DNA sequences, respond differently to the distinct calcium signatures. To investigate this possibility further, we analysed the promoters of the genes up-regulated in response to each of the three calcium signatures separately (we focused on up-regulated genes as down-regulated genes did not seem to be enriched for specific promoter sequences, probably because post-transcriptional regulation is the likely major degree of control for rapidly downregulated genes). This analysis revealed that the most common promoter motif was different for each of the signatures (Fig. 2c). Furthermore, in most cases, each motif represented wellestablished transcription factor binding sites. For example, the two most common motifs for signature 1 overlap forming the Wbox motif (Rushton et al., 1995). This W-box is also found in promoters of genes responding to signature 2, but less commonly than the sequence CACGT, the core sequence of a known droughtassociated and ABA-associated motif, the ABRE (Hobo et al., 1999). By contrast, signature 3 revealed a completely different set of consensus motifs, the most common of which agrees with the consensus for the Site II element (Kosugi et al., 1995). The second most common motif in signature 3 genes was ‘CCGGTT’, which has been identified bioinformatically as a very strong candidate transcription factor binding site, but no function has been ascribed as yet (Yamamoto et al., 2007). Interestingly, we had already previously demonstrated that the ABRE and Site II promoter motifs are calcium-regulated in planta (Whalley et al., 2011). The W-box is known to be regulated by transcription factors, which
Ó 2012 The Authors New Phytologist Ó 2012 New Phytologist Trust
(b) [Ca2+]cyt (μM)
0.6 0.5 0.4 0.3 0.2 0.1 0
0
100
200
300
400
0.7 0.6 0.5 0.4 0.3 0.2 0.1 0
0
100
Time (s)
(c) [Ca2+]cyt (μM)
[Ca2+]cyt (μM)
(a) 0.7
Fig. 1 Blue lines show the resulting intracellular calcium ([Ca2+]cyt) traces when Arabidopsis seedlings were treated with the voltage regimes described in the Materials and Methods section; green lines show the resulting calcium trace of untreated seedlings. (a) Signature 1, high frequency, high amplitude; (b) signature 2, high frequency, low amplitude; (c) signature 3, low frequency, low amplitude. High frequency, 40 s period; low frequency, 80 s period.
Forum 691
Letters
0.7 0.6 0.5 0.4 0.3 0.2 0.1 0
0
100
200
300
400
Time (s)
200
300
400
Time (s)
500
600
700
800
New Phytologist (2013) 197: 690–693 www.newphytologist.com
692 Forum
New Phytologist
Letters (b)
(a) Signature 1
Signature 3
Signature 3
Signature 1
36 201
13
386 26
32
663
394
31 20
12 21
Signature 2 Signature 2
249
168
(c)
Signature 1
Signature 2
Signature 3
Frequency = 0.72
Frequency = 0.80
Frequency = 0.59
Frequency = 0.39
Frequency = 0.59
Frequency = 0.22
Fig. 2 Venn diagrams depicting the groups of genes whose expression increases (a) or decreases (b) by 1.5-fold or greater in response to three different calcium signatures. (c) Table showing consensus DNA sequences enriched in the promoter regions of genes up-regulated in response to three different calcium signatures, showing the frequency (mean number of motifs per gene).
themselves are regulated by calmodulin (Rushton et al., 2010). The preponderance of calcium-regulated motifs in the promoters of the genes induced by electrical stimulation strongly suggests that expression of the majority of the electrically induced genes is calcium-dependent. We cannot formally discount with this type of analysis, however, that some of the genes induced by electrical stimulation are not calcium-dependent. Our data suggest that these elements are differentially sensitive to different types of [Ca2+]c signature. Fig. 2 shows the potential for relatively subtle differences in calcium signatures to specify very different gene expression profiles. It has been established that, in plants, different types of environmental stresses provoke distinct calcium signatures (Dodd et al., 2010). These stimuli also provoke distinct gene expression profiles (Kilian et al., 2007). It thus seems reasonable to hypothesize that the specific characteristics of the calcium signatures in response to natural stimuli are encoding these appropriate patterns of gene expression. The major challenge in future will be to determine how these complex signatures are decoded by plant cells, what parameters of the calcium signature are being ‘read’, and the identity of the decoders. Knowing this might allow the control of stress pathways, leading to tolerance in crop plants, by breeding to produce better adapted varieties in the face of climate change.
Acknowledgements We would like to thank Dr Nigel Saunders for providing protocols and equipment for microarray hybridizations and analysis, and Dr Heather Knight and Mr Alex Sargeant for critical review of this manuscript. New Phytologist (2013) 197: 690–693 www.newphytologist.com
Helen J. Whalley1 and Marc R. Knight2* 1
Cell Signalling Group, Paterson Institute for Cancer Research, The University of Manchester, Wilmslow Road, Manchester, M20 4BX, UK 2 Durham Centre for Crop Improvement Technology, School of Biological and Biomedical Sciences, Durham University, South Road, Durham, DH1 3LE, UK (*Author for correspondence: tel +44 191 334 1224; email
[email protected])
References Allen GJ, Chu SP, Harrington CL, Schumacher K, Hoffmann T, Tang YY, Grill E, Schroeder JI. 2001. A defined range of guard cell calcium oscillation parameters encodes stomatal movements. Nature 411: 1053–1057. Campbell AK, Trewavas AJ, Knight MR. 1996. Calcium imaging shows differential sensitivity to cooling and communication in luminous transgenic plants. Cell Calcium 19: 211–218. Clayton H, Knight MR, Knight H, McAinsh MR, Hetherington AM. 1999. Dissection of the ozone-induced calcium signature. Plant Journal 17: 575–579. Dodd AN, Kudla J, Sanders D. 2010. The language of calcium signaling. In: Merchant S, Briggs WR, Ort D, eds. Annual Review of Plant Biology 61: 593– 620. Dolmetsch RE, Xu K, Lewis RS. 1998. Calcium oscillations increase the efficiency and specificity of gene expression. Nature 392: 933–936. van Helden J. 2003. Regulatory sequence analysis tools. Nucleic Acids Research 31: 3593–3596. Hobo T, Asada M, Kowyama Y, Hattori T. 1999. ACGT-containing abscisic acid response element (ABRE) and coupling element 3 (CE3) are functionally equivalent. Plant Journal 19: 679–689.
Ó 2012 The Authors New Phytologist Ó 2012 New Phytologist Trust
New Phytologist Kilian J, Whitehead D, Horak J, Wanke D, Weinl S, Batistic O, D’Angelo C, Bornberg-Bauer E, Kudla J, Harter K. 2007. The AtGenExpress global stress expression data set: protocols, evaluation and model data analysis of UV-B light, drought and cold stress responses. Plant Journal 50: 347–363. Knight H, Knight MR. 2000. Imaging spatial and cellular characteristics of low temperature calcium signature after cold acclimation in Arabidopsis. Journal of Experimental Botany 51: 1679–1686. Knight H, Trewavas AJ, Knight MR. 1996. Cold calcium signaling in Arabidopsis involves two cellular pools and a change in calcium signature after acclimation. Plant Cell 8: 489–503. Knight H, Trewavas AJ, Knight MR. 1997. Calcium signalling in Arabidopsis thaliana responding to drought and salinity. Plant Journal 12: 1067–1078. Kosugi S, Suzuka I, Ohashi Y. 1995. Two of three promoter elements identified in a rice gene for proliferating cell nuclear antigen are essential for meristematic tissuespecific expression. Plant Journal 7: 877–886. Lecourieux D, Lamotte O, Bourque S, Wendehenne D, Mazars C, Ranjeva R, Pugin A. 2005. Proteinaceous and oligosaccharidic elicitors induce different calcium signatures in the nucleus of tobacco cells. Cell Calcium 38: 527–538. Love J, Dodd AN, Webb AAR. 2004. Circadian and diurnal calcium oscillations encode photoperiodic information in Arabidopsis. Plant Cell 16: 956–966. McAinsh MR, Pittman JK. 2009. Shaping the calcium signature. New Phytologist 181: 275–294. Miwa H, Sun J, Oldroyd GED, Downie JA. 2006. Analysis of calcium spiking using a cameleon calcium sensor reveals that nodulation gene expression is regulated by calcium spike number and the developmental status of the cell. Plant Journal 48: 883–894. Moyen C, Hammond-Kosack KE, Jones J, Knight MR, Johannes E. 1998. Systemin triggers an increase of cytoplasmic calcium in tomato mesophyll cells: Ca2+ mobilization from intra- and extracellular compartments. Plant, Cell & Environment 21: 1101–1111. Rentel MC, Knight MR. 2004. Oxidative stress-induced calcium signaling in Arabidopsis. Plant Physiology 135: 1471–1479. Rushton PJ, Macdonald H, Huttly AK, Lazarus CM, Hooley R. 1995. Members of a new family of DNA-binding proteins bind to a conserved cis-element in the promoters of alpha-Amy2 genes. Plant Molecular Biology 29: 691–702. Rushton PJ, Somssich IE, Ringler P, Shen QXJ. 2010. WRKY transcription factors. Trends in Plant Science 15: 247–258. Short EF, North KA, Roberts MR, Hetherington AM, Shirras AD, McAinsh MR. 2012. A stress-specific calcium signature regulating an ozone-responsive gene expression network in Arabidopsis. Plant Journal 71: 948–961. Whalley HJ, Sargeant AW, Steele JF, Lacoere T, Lamb R, Saunders NJ, Knight H, Knight MR. 2011. Transcriptomic analysis reveals calcium regulation of specific promoter motifs in Arabidopsis. Plant Cell 23: 4079–4095. Yamamoto YY, Ichida H, Matsui M, Obokata J, Sakurai T, Satou M, Seki M, Shinozaki K, Abe T. 2007. Identification of plant promoter constituents by analysis of local distribution of short sequences. BMC Genomics 8: 67–89.
Ó 2012 The Authors New Phytologist Ó 2012 New Phytologist Trust
Letters
Forum 693
Supporting Information Additional supporting information may be found in the online version of this article. Fig. S1 Effect of lanthanum on electrically induced cytosolic calcium concentrations. Fig. S2 Spatial localization of calcium-dependent luminescence in response to electrical stimulation. Table S1 Expression data for 295 genes up-regulated by calcium signature 1 Table S2 Expression data for 338 genes up-regulated by calcium signature 2 Table S3 Expression data for 485 genes up-regulated by calcium signature 3 Table S4 Expression data for 439 genes down-regulated by calcium signature 1 Table S5 Expression data for 221 genes down-regulated by calcium signature 2 Table S6 Expression data for 709 genes down-regulated by calcium signature 3 Please note: Wiley-Blackwell are not responsible for the content or functionality of any supporting information supplied by the authors. Any queries (other than missing material) should be directed to the New Phytologist Central Office. Key words: Arabidopsis, calcium signalling, gene expression, promoter, specificity, stress, transcription factor, transcriptomics.
New Phytologist (2013) 197: 690–693 www.newphytologist.com