CALCULATING COMPLIANCE STANDARDS D W du Preez and V Pieterse Department of Computer Science University of Pretoria, 0002 Pretoria, South Africa 082 331 9523
[email protected] University of Pretoria, 0002 Pretoria, South Africa (012) 420 3652
[email protected] ABSTRACT The security of information is important to protect top secret documents for government and private organisations alike. For this reason, many methods have been developed to enforce security and protect access to documents, computers and networks. Some of these methods include policies and procedures. These policies and procedures are compiled according to an Information Security Architecture (ISA). Information security standards help organisations reduce the risk of attacks by stipulating specific measures that should be implemented. These measures will help organisations to be secure from attacks, law suites, breaches, and more. The problem, however, is that there is no standard method that allows researchers, auditors, and academia to calculate the compliance to security standards or the state of information security. This article investigates methods and calculations proposed by other authors to determine compliance. Following on what has been done in the field, this article proposes a procedure that culminates in an information security compliance measure that appears to be standardised over different standards and in different scenarios. This procedure includes well-defined and trusted statistical formulae to calculate the compliance factor. Researchers and academia can use these formulae to standardise the calculation of compliance and to determine the state of information security in comparable terms. KEYWORDS Compliance factor, state of information security, calculate, statistics, measures, metrics, information security standard, Information Security Architecture
CALCULATING COMPLIANCE TO STANDARDS 1
INTRODUCTION
Numerous publications are available on information security compliance (Tudor 2000: 165), the state of information security (Jackson et al. 2002: 1) and information security metrics (Ryan & Jefferson 2004: 7). Information security metrics are used in various scenarios to measure the success of an information security architecture (ISA) framework, the implementation of new technology, processes and policies, and level of compliance with the security standard (Eloff J.H.P. & Eloff M.M. 2005: 15; Tudor 2000: 165). However, no publications could be found on the calculation of compliance to given standards, nor could any formulae be located to determine the compliance ratio of an organisation. Eloff and Eloff (2005: 15) indicate that the level of compliance can be represented by the use of a numerical value. Only three of the five architectures evaluated by Eloff J.H.P and Eloff M.M (2005: 15) could be partially measured, and the other two ISAs could not be measured at all. The lack of scientifically proven methods to calculate compliance factors and ratios leaves information security experts, professionals and academics with no choice but to introduce their own methods to represent the success or failure of an ISA framework. As a result, different researchers interpret data from surveys differently. As Ryan and Jefferson (2004: 1) indicate, statistical information are misused and interpreted incorrectly, even from surveys that are regarded as industry standards. This paper focuses on the design of a procedure and the definition of algorithms for calculating the compliance ratios. The procedure and its inclusive algorithms are robust in the calculation of compliance rations with regard to any chosen standard or architecture, such as ISO 17799 (ISO 17799, 2000), BS 17799 (BS 17799, 1999) and Control objectives for information and related technologies (CoBIT)(CoBIT, 2000). The algorithms offered in this paper enable different researchers to obtain comparable results and support them to draw valid conclusions when evaluating information and data obtained through various surveys or audits using different existing standards as well as possible future standards such as ISO/IEC NP 27004 (ISO 2006) currently under development by the International Organisation for Standardization (ISO). They are in the process of redefining the ISO 17799 standard into the new ISO 27000 series. The ISO 17799 standard will be incorporated into ISO 27002, and part two of the BS 17799 standard will be incorporated into ISO 27001. The ISO 27004 number will be used to define a new standard that will focus on the metrics and measurements of information security. Our calculation of compliance will help industry players, as well as researchers, to base their findings on a unified standard. This will increase the credibility of any study or survey that sets out to determine compliance ratios and offers a method to compare different standards to one another. At the moment several information security surveys are being published, including those from organisations such as KPMG (KPMG 2002), Ernest & Young (Ernst & Young 2004), Federal Bureau of Investigation/Computer Science Institute (FBI/CSI) (FBI & CSI 2005), and the British Department of Trade and Industry (DTI 2006). Through application of the procedure offered in this paper all these results could be included in a meta-study that can eventually compare the state of information security between the different regions or industry types involved in these studies. The procedure described in this article has potential for a wide application base. The results obtained from it can, for example, be used as primary input to any of the numerous N-tier compliance models. Eloff and Eloff (2003: 133) devised one such model in which they defined a model with a 4-tier classification. The four classes are called inadequate protection, minimal protection, reasonable protection and adequate protection (Eloff J.H.P & Eloff M.M. 2003: 134). Depending on the compliance ratio that an organisation scores against an information security standard, the organisation will be grouped into one of the four classes. If an organisation obtained a relative low score/ratio, that organisation will be classified into the inadequate protection class.
Using our method to calculate compliance will provide a simple routine to group organisations into classes that can be used as input to their model and use their model to determine the state of information security. Apart from being useful for the enhancement of existing models, its availability contributes the following enrichments to the study field regarding information security compliance and state: •
organisations will be able to monitor their progress over time, since the standardised value of compliance can be calculated at regular intervals in the organisation
•
the compliance of different organisations, as well as the state of information security (SIS) of industries and regions, can be computed and compared with one another
•
organisations, industries and regions can be rated, since they can easily be compared with one another through the application of this procedure
The following sections demonstrate how the formulae are devised, used and tested. Section 2 classifies acceptable question types and elaborates on the academic and scientific uses of current statistical methods in order to devise methods with which the answers to the different question types can be evaluated. Examples of the formulation of types of questions are given by using items from existing information security standards. It serves a two-fold goal, namely to illustrate the question type at hand, and to show how given standards can be translated into question types. The following section focuses on formulae to calculate compliance factors. It postulates the formulae and explains them in context by showing their application to the examples in the section preceding them. A pilot information security survey in which these formulae were implemented was conducted. We discuss the results that were obtained from this pilot study to validate the procedure and formulae presented in this paper. 2
STATISTICAL METHODS
The security compliance ratio of an organisation is purely dependent on how well an organisation implements standards, procedures and technologies according to an information security standard. The more compliant an organisation is against the standard, the higher that organisation’s security compliance ratio will be. However, determining the compliance ratio should be based on proven academic and scientific methods. 2.1
Question types in surveys
One method of obtaining the information to determine compliance to an information security standard is a survey. Surveys can, in turn, make use of various methods, such as questionnaires (Kotz & Johnson 1981: V7, 477) and structured interviews (Kotz & Johnson 1981: V9, 111), to collect data (Burgess 2001: 5). Questions in a questionnaire and items in a structured interview are used to determine if an organisation is compliant to a given security standard. It has been reported that the majority of questions in surveys are normally of nominal and ordinal scale types (Know your Audience 2002: 2). It is possible to limit the question types in information security audits or surveys to nominal and ordinal type questions. 2.1.1
Nominal measures
The answers to questions are considered to be of the nominal type when questions are structured in multiple-question format, the answers have no numeric meaning/value and no sequence exists between the answers (Becker 1999: 1; Olivier 1997: 97; Kotz & Johnson 1981: V6, 256). For the purpose of our application we include true/false questions in this category.
2.1.2
Ordinal measures
The answers of questions are considered to be of the ordinal type when the answers have numeric values, but the intervals between the answers are inconsistent and have no meaning. An example is rating scales, where the difference between a rating of 4 and 5 not necessary has the same meaning as the difference between 7 and 8 (Becker 1999: 1; Olivier 1997: 97; Kotz & Johnson 1981: VU2, 508). 2.2
Statistical computation of the measures
Each of these question types has different ways in which the results can be statistically calculated and interpreted. Nominal types can be counted, whereas ordinal types may make use of "greater than" or "less than" operations (Becker 1999: 2). 2.2.1
Nominal statistics
The following statistical methods can be used to measure nominal variables (Know your Audience 2002: 3): • • •
The number of respondents in each category The percentage of respondents in each category The category corresponding to the highest number of respondents
The results of such measurements can be represented by using the frequency distribution in a table or a graph, depicting the number of respondents in each category. 2.2.2
Ordinal statistics
The following statistical methods can be used to measure ordinal statistics (Know your Audience 2002: 3): • • • • • •
The minimum - the lowest value in the series The maximum - the highest value in the series The range - the difference between the maximum and the minimum The average - the calculated middle of the series between the maximum and minimum The median - the middle value of the series when the series is arranged in order of size The quartiles - the centre or midpoint between the minimum and median, or the median and the maximum
The central tendency of an ordinal measured variable can be represented by its median or its mode and the results can also be displayed as a value on a table or graph (Wikipedia 2006), where the minimum value on a bar chart will be smaller than the maximum. 3
COMPLIANCE EXAMPLES
When creating a compliance survey, the questions in the survey must relate to the items in a chosen security standard. The following sections each illustrate how a question of the given type can be formulated.
3.1
Nominal
Most items in a security standard or architecture can be translated to a question of nominal type by creating a checklist. The following is an example of a question related to the mobile policy in section 9.8.1 in the ISO17799 standard that gives guidelines on required criteria for mobile policies (ISO17799, 1999). What does your organisation include in their mobile computing policy? Access control to the mobile devices Backups Encryption of data Physical protection of mobile devices Procedures for connecting mobile devices Virus protection It is possible to compile a list of possible criteria that are mentioned in the guidelines given in standards. The question can thus be formulated as a checklist from which the respondent must check the criteria that are in place in his/her organisation with regard to the particular organisation's mobile policy. It could be that the respondent has none of the criteria in place or that all of the criteria are in place. 3.2
Ordinal
Many items in a standard or architecture can be translated to a question of ordinal type by asking the respondent to rate his/her observation of compliance on a scale. An example of such a question is: “Rate your perception of your organisation’s effort in conducting security awareness on a scale of 0 to 10.” 4 4.1
CALCULATING COMPLIANCE Nominal
The compliance factor can be determined by the number of criteria that is in place in the respondent’s organisation compared with the total number of criteria in the list. To determine the compliance to the question (cq), let x be the response variable (the number/sum of options selected) and y the total number of options in the list. If the question consists of a true and false question, then y denotes a 1, and x=0 if it is false, and x = 1 if the answer is true, resulting in a compliance of either 0 or 1. cq =
∑x y
Equation 1: Calculation of compliance to a nominal question 4.2
Ordinal
The compliance factor is determined by the rating given by the respondent according to the maximum rating possible. Although the ratings refer to personal opinion and difference between different ratings is not necessary consistent, it is has been shown that with large samples, these
limitations are negated (Tillinghast 1980: 383) and henceforth Equation 2 can be used to determine the compliance to the question (cq), let x be the response variable (the rating selected) and y the maximum possible rating. x y
cq =
Equation 2: Calculation of compliance to an ordinal question 4.3
Compliance to the standard
To determine compliance to the full standard, a new algorithm is used that make use of the values computed for each question using its appropriate formula as given above. Equation 1 and Equation 2 denotes the cumulative sum of the expected portions of the first N categories of the variable cq (x/y) in the N-dimensional column vector by N −1
cf = ∑ i =0
xi yi × N
Equation 3: Calculation of compliance to security standard for i = 0,1,2,…,N, where cf denotes the compliance to the security standard. This equation is equal to the statistical function: arithmetic mean (Kotz & Johnson 1981: V1, 126), which is defined as follows:
z=
1 N
N −1
xi
i =0
i
∑y
Equation 4: Arithmetic mean variation or
y=
1 n ∑ yi n i =1
Equation 5: Arithmetic mean Other statistical functions that are available include the geometric mean (Kotz & Johnson 1981: V3, 397) and the harmonic mean, none of which can be used due to the zero compliance factor xi. The geometric mean cannot be calculated even though a ratio exists between the amount of compliance criteria (x) obtained by a respondent and the total number of compliance criteria (y) for a section in the standard. The reason for this is that when a respondent obtained no score (zero) of compliance in a section, the ratio of the respondent’s score and the total score will be zero. Thus calculating the geometric mean by
yG = n ( y1 . y 2 . y 3 L y n ) Equation 6: Geometric mean will result in a respondent obtaining a zero compliance when one or more of the subsections obtained a zero result. This problem reoccurs in the calculation of the harmonic mean. 4.4
Weighted compliance
The equations above assume all compliance criteria have equal weighting. This means, for example, that the 12 sections listed in the ISO 17799 standard will all be evaluated equally. Since section 9.1 contains one more subsection (9.1.1) and section 9.4 contains nine subsections (9.4.1 - 9.4.9), all sections should not have the same weight when compliance is calculated. The reason for this is that a high compliance ratio can be achieved by an organisation if it implements the smaller sections, which may be less important than other sections. To overcome this problem, each section is assigned a weighting - the smaller sections will have smaller weighted averages than the larger sections. The table below lists the precalculated weights for each subsection in section 9 of the ISO 17799 standard based on the number of items in the standard. The weights of each of the subsections add up to 1. If weights are calculated for the other subsections, then the weights below would change, but in context of the current section it will not. If a subsection or a whole section is not applicable to an organisation, as may be the case when using mobile technologies, that section or subsection can be assigned a zero percentage weighting. This will ensure that an organisation can still achieve 100% compliance even though the organisation did not make use of mobile technologies. Auditing is done as part of the compliance step of an ISA framework (Tudor 2000: 165), and can be performed by either internal or external auditors (Tudor 2000: 165). These auditors need to ensure that no sections are assigned the wrong weighting and that all calculations are correct. Table1: Calculated weightings for section 9 in ISO 17799 Section
Size
Ratio
Weight
9.1
1
1/31
0,0323
9.2
4
4.31
0,1290
9.3
2
2/31
0,0645
9.4
9
9/31
0,2903
9.5
8
8/31
0,2581
9.6
2
2/31
0,0645
9.7
3
3/31
0,0968
9.8
2
2/31
0,0645
To calculate the weighted or aggregate mean (Kotz & Johnson 1981: V9, 580), the following formula is used:
n
x=
∑w x i =1 n
i
i
∑w i =1
i
Equation 7: Weighted mean (Weighted compliance factor) where w1,w2,…wn are non-negative coefficients, called weights. The entries in vector x correspond to the entries in the same position in vector w, noting that xi is calculated by using Equation 1 or 2 (eq). 4.5
Pilot Study
The validity of the application of these formulae was tested by means of a pilot study that implemented only nominal questions and used the corresponding formulae to determine compliance values for the companies of the participants. The study was conducted with the help of members from a local information security user group with over 500 members. Twenty-one security professionals from 19 different companies participated in the pilot study. The survey was conducted online for easy access. Although the results from the pilot study have no statistical value, they are used in this paper to illustrate the use of the formulae discussed in the previous section and how they can be applied. The following table depicts the values that were captured and calculated from the pilot survey. The first column contains the ISO 17799 section. All items in the questions of the pilot study were considered of equal importance, therefore no weighting were applied when the compliance for the questions were calculated. The second column shows the number of items in the checklist of the question, with other words the maximum points a respondent would achieve for full compliance. The third column the points scored in the section by means of a questionnaire in a survey, and the last column contain the calculated values of compliance through the use of Equation 1. Table 1: Sample results from a survey ISO 17799 Section
Full Compliance
Points Scored
Cq Compliance
9.4.1
3
3
1
9.4.2
7
2
0,2857
9.4.3
5
2
0,4
9.4.4
1
1
1
9.4.5
1
1
1
9.4.6
2
1
0,5
9.4.7
5
0
0
9.4.8
1
1
1
9.4.9
1
0
0
The calculated values can now be used to determine the compliance factor by using the weightings supplied in Table 1. For this example only compliance to section 9 will be calculated. In order to calculate the other sections, the weightings, point count, and cq must be calculated. As a
rule, on the lowest level of the tree, all the compliance ratios are weighted equally. Thus, the average of the compliance ratios can be computed, and results in a total compliance score of 0,5762 for section 9.4. All the other sections must be calculated in the same way.
x=
1 *1 + 4 * 0,8572 + 2 * 0,2648 + 9 * 0,5762 + 8 * 0,6251 + 2 * 0,4746 + 3 * 0,6667 + 2 * 0,5 31
The calculated compliance factor (cf) was calculated as 0,5762 by using Equation 7. What this result really means is that the respondent is only 57,62 per cent compliant to section 9.4 of the security standard. This would place the respondent in the inadequate protection class as defined by Eloff and Eloff (2003: 133). This result, in conjunction with all the other results from the survey, will be used to calculate the total level of compliance. The new result will also be a fraction between zero and one.
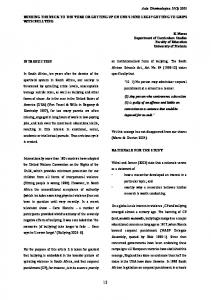
Number of organisations
Organisations grouped per compliance ratio
0 - 10
11 20
21 30
31 40
41 50
51 60
61 70
71 80
81 90
91 100
Compliance group
Figure 1: Organisations grouped per compliance ratio The diagram above displays the compliance curve of all the respondents. The respondents were divided into 10 groups of equal size, so that the following groups existed: compliance 0-10%, 11-20%, …, 91-100%. From graphs like these, information is interpreted more easily and more deductions and conclusions can be made. 5
CONCLUSION
This paper describes an easy-to-follow procedure to determine a numerical value between 0 and 1 that can be considered to be a standardised value to express the compliance of a company to a given compliance architecture or standard. This procedure can be summarised in the following steps: 1. 2. 3. 4. 5.
Formulate a checklist/audit/survey to determine compliance to an ISA/standard Weigh each question/point on the checklist/survey/audit Calculate the compliance to the question (qc) for each question Calculate the compliance factor (Cf) for each of the subsections/sections Calculate the total compliance factor for the company of the respondent
Acceptable question types to use in checklists, audits and surveys was selected by observing examples in existing instruments that were created for this purpose and correlating them with texts written about the creation of such instruments. The need to weigh questions or points in document
checklists, surveys and items arose because some of the available standards appear to have a practical imbalance that can easily be rectified to a logical balance by the use of applicable weighting to the items at hand. Formulae to calculate the compliance the identified question types and the composite compliance factors of sections are offered. Following on the above, a formula to calculate an overall compliance factor, based on comparable scientifically proven methods, is proposed. A pilot study that applied this procedure and using only one of the most commonly used question types, was conducted. Although the sample of the pilot study was not sufficiently representative to draw any statistical conclusions, the result of the study reveals that the procedure renders values that, from a statistical point of view, show promise to be usable as a standard. The intention is to apply this procedure on a wider study and to include more question types to confirm its value as a standard. The availability of this procedure and its ability to produce a standardised numerical compliance value will enable researchers to compare, analyse and interpret information security compliance in various situations. The question types defined in this paper include the most commonly used question types, and it is thus very likely that an existing information security audit or survey will contain only questions or items that can be classified as one of these types. As a result, the calculations in the procedure described in this paper can also be applied to data gathered previously. This opens a further possibility to use the proposed procedure and its methods to include historical data in current and future research regarding compliance to a given standard or architecture. The creation of this procedure to produce a standardised evaluation of information security compliance lays the foundation for further research to determine the state of information security (SIS) and a state of information security index (SISI). The state of information security will be calculated by using demographic and compliance data. The index can be created by using the models presented by other existing indexes, such as the Consumer Price Index (CPI), which is a standard statistical method. However, before this can be achieved, the procedure and its embedded formulae need a more rigorous validation, based on a survey incorporating more question types and conducted on a larger audience, as well as its application to existing trusted results from industry standard surveys. 6
REFERENCES
Becker, L.A. (1999). Scales of Measurement. Available http://web.uccs.edu/lbecker/SPSS/scalemeas.htm. [Date Accessed: 4 April 2006]
from:
Burgess, T.F. (2001). A general introduction to the design of questionnaires for survey research. University of Leeds. Available from: www.leeds.ac.uk/iss/documentation/top/top2.pdf [Date Accessed: 1 April 2006] COBIT (2000). Control objectives for information and related technologies, 3rd ed. USA: IT Governance Institute; 2000. DTI UK (2006) DTI Information Security Breaches Survey 2006. Available from: http://www.pwc.com/extweb/pwcpublications.nsf/docid/7FA80D2B30A116D7802570B9005C3D1 6 [Date Accessed 24 April 2006] Eloff, J.H.P., Eloff, M.M. (2003). Information Security Management – A new Paradigm. Proceedings of SAICSIT 2003, pp. 130 – 136. Eloff J.H.P., Eloff M.M. (2005). Information Security Architecture, Computer Fraud and Security, November 2005, pp. 10 – 16.
Ernst & Young (2004) Global Information Security Survey, Available from: http://www.ey.com/global/download.nsf/International/2004_Global_Information_Security_Survey/ $file/2004_Global_Information_Security_Survey_2004.pdf [Date accessed: 24 April 2006] FBI. CSI. (2005) Computer Crime and Security Survey 2005. Available http://www.usdoj.gov/criminal/cybercrime/FBI2005.pdf [Date Accessed: 24 April 2006]
from:
Gelman, A., (2004). Survey weighting and hierarchical regression. Available from: www.stat.columbia.edu/~gelman/research/presentations/weighting_jsm.pdf. March 2006]
[Date Accessed: 27
Gelman, A., (2005). Struggles with survey weighting and regression modeling. Available from: www.stat.columbia.edu/~gelman/research/unpublished/modelweights.pdf. March 2006]
[Date
Accessed:
27
ISO/IEC 17799 (2000). Code of practice for Information Security Management, International Organization for Standardization/International Electrotechnical Commission, Switzerland, Geneva. ISO/IEC 27004 (2006) Information technology -- Information security management measurements, International Organization for Standardization/International Electrotechnical Commission, Switzerland, Geneva. Available from: http://www.iso.org/iso/en/CatalogueDetailPage.CatalogueDetail?CSNUMBER=42106&scopelist=P ROGRAMME [Date Accessed: 24 April 2006] Jackson, T. Fisher, D. and Dawson, R. (2002). An Investigation into the Current State of Information Security in the United Kingdom. Available from: http://homepage.ntlworld.com/cotwj1/pdf/SQM2002%20Jackson%2002.pdf [Date accessed: 07 March 2006] Kotz, S., Johnson, N. (1981). Arithmetic Mean. In The Encyclopedia of Statistical Sciences, New York: John Wiley & Sons, (Vol. 1, p. 126), (Vol. 3, p. 397), (Vol. 6, p. 256), (Vol. 9, p. 477), (Vol. 1, p. 644), (Vol. 9, p. 111), (Vol. 9, pp. 580-581), (Vol. U2, p. 508), (Vol. U3, p. 371). KPMG. (2002). Global Information Security Survey Available http://www.kpmg.com/Rut2000_prod/Documents/9/giss.pdf [Date accessed 24 April 2006]
from:
Olivier, M.S. (1997). Information Security Research: A Practical Guide. Johannesburg. Ryan, J.J.C.H. and Jefferson, T.I. (2004). The use, misuse and abuse of statistics in information security research. Available from: [Date http://www.attrition.org/archive/misc/use_misuse_abuse_stats_infosec_research.pdf accessed: 07 March 2006] Tillinghast, D.S. (1980). Direct Magnitude Estimation Scales in Public Opinion Surveys The Public Opinion Quarterly, Vol. 44, No. 3. pp. 377-384 Tudor, J.K. (2000). Information Security Architecture – An Integrated Approach to Security in the Organization. Auerbach, 2000. Unknown. (2002). Know your Audience: chapter 5, part B Basic survey analysis. Available from: http://www.audiencedialogue.org/kya5b.html [Date Accessed: 11 March 2006] Wikidepia (2006). Level of Measurement. Available http://en.wikipedia.org/wiki/Level_of_measurement [Date accessed: 23 April 2006]
from: