Vol. 8(9), pp. 839-849, 26 February, 2014 DOI: 10.5897/AJMR2013.6240 ISSN 1996-0808 ©2014 Academic Journals http://www.academicjournals.org/AJMR
African Journal of Microbiology Research
Full Length Research Paper
Bacterial dynamics and chemical changes during the spontaneous production of the fermented porridge (Calugi) from cassava and corn Maria Gabriela da Cruz Pedrozo Miguel, Claudia Cristina Auler do Amaral Santos, Marianna Rabelo Rios Martins Santos, Whasley Ferreira Duarte and Rosane Freitas Schwan* Biology Departament, Federal University of Lavras, 37200-000, Lavras, Minas Gerais, Brazil. Accepted 24 January, 2014
A traditional fermented porridge made from maize, cassava and rice, named calugi, was microbiologically and chemically analyzed. Our results show that aerobic mesophilic bacteria reached values of approximately 7 log CFU ml-1 and were the predominant group; acetic acid bacteria were also -1 observed at the onset of fermentation (3.82 log CFU ml ). The population of lactic acid bacteria was 3.7 -1 log CFU ml and remained constant throughout the fermentation. The denaturing gradient gel electrophoresis (DGGE) bands were identified as Corynebacterium variabile, Lactobacillus paracasei, L. plantarum, L. casei, Bacillus spp. (Bacillus cereus group), B. subtilis, Streptomyces sp., Enterobacter cloacae, Streptococcus parasanguis, Streptococcus salivarius, Weissella cibaria and Weissella confusa, in addition to uncultivable bacteria. The most abundant carbohydrate in the substrate was maltose (38 g L-1 at the beginning of fermentation). Acetic and lactic acids were the principal acids found by high performance liquid chromatography (HPLC) (0.66 g L-1 and 3.54 g L-1, respectively). Twenty-one (21) minor compounds were identified by gas chromatography during the fermentation process. The compounds present at the highest concentrations were furfuryl alcohol, nonanoic acid, decanoic acid and 1,1-dietoxyethane. These appeared to be related to the flavor of the calugi. Key words: Indigenous food, cereal fermentation, cassava, corn, volatile compounds, denaturing gradient gel electrophoresis (DGGE), saliva. INTRODUCTION Indigenous fermented foods are of worldwide interest and consequently have provided new avenues for scientific research in the past. Several Amerindian tribes in Brazil (Araweté, Kayapó, Karajá, Javaé, Juruna and Tapirapé) use small-scale fermentation to produce foods and beverages with high nutritional value, which also have medical and religious significance (Wagley, 1988). These indigenous groups have little contact with external cul-tures; therefore, investigating Brazilian indigenous food is not easy (Santos et al., 2012). Nevertheless, the study of these beverages and fermented foods is necessary for describing the empirical knowledge of indigenous people
and to contribute information to improve the food safety of these products. Some substrates, such as cottonseed, rice, peanut, cassava and sweet potato, are used as raw materials in the fermentation and production of these traditional foods and beverages in Brazil and Africa (Almeida et al., 2007; Oguntoyinbo and Dodd, 2010; Ramos et al., 2010, 2011; Santos et al., 2012; Schwan et al., 2007). Studies charac terizing the microbiota of various traditional products revealed a great diversity of bacteria involved in fermentation.According to Almeida et al. (2007) Lactobacillus, Bacillus, Corynebacterium and Enterobacter
*Corresponding author. E-mail:
[email protected]. Tel.: (+55) 35 3829 1614. Fax (+55) 35 3829 1100.
840
Afr. J. Microbiol. Res.
were identified in the beverage cauim, produced from cassava and rice, in which the species Lactobacillus pentosus and L. plantarum were the dominant bacteria. Ramos et al. (2010, 2011) showed that the Lactobacillus genus was dominant throughout fermentation, and L. plantarum, L. fermentum, L. paracasei and L. brevis were the principal microorganisms found during the fermentation of peanuts, cottonseeds and rice. The microbiota of caxiri, an indigenous alcoholic beverage based on cassava and sweet potato, was described and found that the bacteria were mainly represented by Bacillus pumilus, Bacillus spp. (Bacillus cereus group) and B. subtilis (Santos et al., 2012). For many years, research on fermented foods and beverages was based on culture-dependent methods, followed by genotypic/phenotypic identification. Later, the culture-independent methods (PCR-DGGE) were added to the culture-dependent methods of identification. DGGE analysis has been widely used to study complex microbial communities originating from food samples, such as doenjang (Kim et al., 2009), fermented cassava (Miambi et al., 2003), gari (Oguntoyinbo and Dodd, 2010), corn and rice calugi (Miguel et al., 2012) and cauim made from cottonseeds, rice and peanuts (Ramos et al., 2010, 2011). Calugi is a non-alcoholic food produced by the Brazilian Indians of the Javaé tribe using corn, cassava and rice as the raw materials. The inoculum is the fluid that is obtained by the chewing of sweet potatoes by the women (Almeida et al., 2007). The calugi is usually consumed in daily meals by adults and children. To identify and report an empirical fermentation used by Brazilian natives for food production and to avoid the loss of indigenous knowledge with acculturation caused by globalization, samples of calugi were collected and studied. Thus, the aims of this work were to evaluate the profile of organic acids, sugars, ethanol and volatile compounds during calugi fermentation produced from cassava and corn by gas chromatography-flame ionization detection (GC-FID) and high-performance liquid chromatography (HPLC) and furthermore, evaluate the dynamic bacterial using a culture-independent approach (PCR-DGGE).
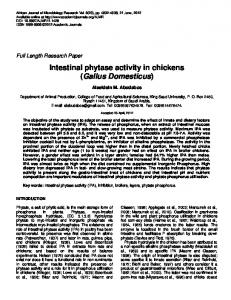
mortar and pestle. The resulting corn flour was mixed with 3 L of water and sieved to remove the peel. The cassava and corn masses were mixed with 7 L of water and cooked for 2 h, with stirring every 10 min. The sweet potato was peeled and washed before use. Approximately, 40 min after cooking (when the porridge had cooled), the inoculum (the mastication juice of the sweet potato) was added. Then, the mixture was homogenized and allowed to ferment in open aluminum vessels at the ambient temperature (approximately 30C). The diagram of traditional production methods (Figures 1 and 2) shows the preparation of the calugi porridge and the inoculation process, which are non-sterile. Four fermentations were performed in the same conditions described above for 48 h each. Sampling Samples were taken in duplicate. For each sample collected at 12 h intervals, 20 mL of fermenting substrate was added to sterile empty bottles (physicochemical analysis) and 20 mL was added to sterile bottles containing 180 mL of saline peptone diluent (0.1% peptone (Himedia, Mumbai, India), 0.5% NaCl (Merck, Darmstadt, Germany), 0.03% Na2H2 PO4 (Merck), 20% glycerol (Himedia) for determination of microbiota and were frozen until analysis. Serial dilutions (10-2 to 10-7) were prepared in saline peptone water after mixing in a Stomacher circulator at normal speed for 60 s. Enumeration, isolation, microorganisms
purification
and
maintenance
of
Microorganisms were counted using four different culture media: nutrient agar medium (Merck) was used as a general medium for the viable aerobic mesophilic bacteria (AMB) population, the plates were incubated for three days at 30°C. Violet red bile agar with glucose (VRBG) (Oxoid, Hampshire, England) was used for biletolerant Gram-negative Entorobacteriaceae (GNE), Acetic acid bacteria (AAB) were enumerated by surface inoculation on GYC agar (5% glucose (Merck), 1% yeast extract (Merck), 3% calcium carbonate (Merck), 2% agar (Merck), pH=5.6), containing 0.1% cycloheximide to inhibit yeasts growth and 50 mg/liter penicillin to inhibit LAB growth. VRBG and GYC agar were incubated at 37°C for 24-48 h and at 25°C for 5-8 days, respectively. De Man Rogosa Sharpe (MRS, Merck) agar containing 0.1% cysteine-HCl was used for LAB count. MRS plates were incubated in acrylic anaerobic jars at 30°C for three to four days. Subsequently, the morphological characteristics of each colony type were recorded and counts made for each type. For each colony type, a number of colonies corresponding to the square root of the number of colonies of that type were restreaked and purified. For long term storage, purified isolates were stored at -80°C.
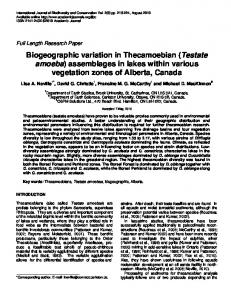
MATERIALS AND METHODS PCR amplification and DGGE conditions Calugi preparation Calugi is prepared by the Javaé people who inhabit the region along the Javaé River, the smaller affluent of the Araguaia River, and who are distributed in villages in the state of Tocantins (located in northern Brazil). This porridge was prepared in the traditional manner using cassava, corn and sweet potato (Figures 1 and 2). To prepare 10 L of calugi, approximately 700 g of dried corn (Zea mays), 6 kg of cassava tubers (Manihot utilissima) and 100 g of sweet potato (Ipomoea batatas L.) were used. The cassava tubers were peeled, washed and grated to obtain a wet mass. The resulting mass was squeezed, producing consistent dumplings that were used as the substrate for fermentation. The corn was soaked in water for 30 min and then was macerated using a rustic wooden
The initial step in the extraction of total DNA from samples was performed according to the protocol described by Ramos et al. (2010). The DNA was extracted using the QIAamp DNA Mini Kit DNA Purification from Tissues (Qiagen, Hilden, Germany), in accordance with the manufacturer‟s instructions. The samples were stored at -20°C until further use. The DNA from the bacterial community was amplified with primers 338fgc (5‟-CGC CCG CCG CGC GCG GCG GGC GGG GCG GGG GCA CGG GGG GAC TCC TAC GGG AGG CAG CAG-3‟) (the GC clamp is underlined) and518r (5‟-ATT ACC GCG GCTGCT GG-3‟), which span the V3 region of the 16S rRNA gene (Ovreas et al., 1997). The PCR mix (25 µL) was composed by: 0.625 U Taq DNA polymerase (Promega, Milan, Italy), 2.5 µL 10X buffer, 0.1 mM dNTP, 0.2 mM
Miguel et al.
841
Figure 1. A flow diagram for the processing of cassava roots, dried corn and sweet potato into calugi.
of each primer, 1.5 mM MgCl2 and 1 µL of extracted DNA. The amplification was performed according to Ramos et al. (2010); aliquots (2 µL) of the amplified products were analyzed by electrophoresis on 1% agarose gels before they were used in DGGE analysis. The PCR products were separated using DGGE (BioRad Universal Dcode Mutation Detection System, USA). Samples were directly loaded into an 8% polyacrylamide gel with 0.5x TAE and a denaturant gradient between 35 and 70%. The gradient was created using polyacrylamide containing 0-100% of the denaturant (7 M urea and 40% of formamide). Electrophoresis was performed at a constant voltage of 70 V for 16 h at a constant temperature of 60°C. After electrophoresis, the gels were stained for 30 min in a
SYBR Green I solution (Molecular Probes, Eugene, UK) (1:10.000 v/v) and analyzed with UV transillumination. The gel images were photographed using Lpix Image (LTB 20x20 HE, LPix®, Brazil).
Identification of DGGE bands The identity of selected bands in the DGGE profiles was revealed by sequencing. Fragments of selected DNA bands were excised from the gels, reamplified and sequenced by Macrogen Inc. (Seoul, South Korea) using an ABI3730 XL automatic DNA sequencer. The sequences were compared to the GenBank database using the BLAST algorithm (National Center for Biotechnology Information,
842
Afr. J. Microbiol. Res.
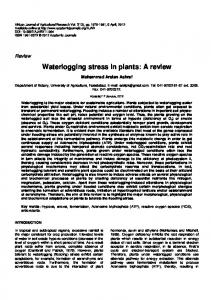
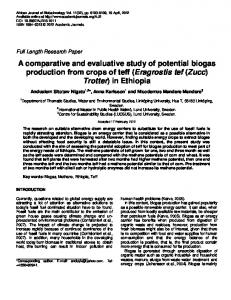
Figure 2. Steps in the preparation of calugi: peeling and removing the unwanted parts (A), washing the roots (B), grating cassava to obtain a wet mass (C), maceration of corn in a rustic wooden pestle (D), sieving (E), mixing with water and sieving to remove the peel (F), inoculation with mastication juice of the sweet potato (G) and fermented calugi (H).
Miguel et al.
Maryland, USA). Using this technique, it is possible to detect uncultivable bacteria (viable but non-culturable bacteria).
843
RESULTS Microbial count
Chemical analysis The pH, starch and protein contents of calugi were determined using the methodology proposed by AOAC (2000). Chromatographic analysis HPLC analysis Carbohydrates (glucose, sucrose, maltose and fructose), organic acids (acetic acid, lactic acid, malic acid, citric acid, propionic acid, and succinic acid) and alcohols (ethanol, methanol and glycerol) were identified according to methodology proposed by Duarte et al. (2010). The analyses were carried out using a high performance liquid chromatography system (HPLC) (Shimadzu, model LC-10Ai, Shimadzu Corp., Japan), equipped with dual detection system consisting of a UV-Vis detector (SPD-10Ai) and a refractive index detector (RID-10Ai). A Shimadzu ion exclusion column (Shim-pack SCR-101 H, 7.9 mm x 30 cm) was used operating at 50C for acids, and at 30C for ethanol, methanol and glycerol, using 100 Mm of perchloric acid as the eluent at a flow rate of 0.6 ml min-1. The acids were detected via UV absorbance (210 nm), while alcohols were detected via RID. For carbohydrates we used the column Supelcosil LC-NH2 (4.6mm x 25 cm) operating at 30C with acetonitrile:water (75:25) as mobile phase in a flow rate of 1ml min1 . The sugars were detected via RID. All samples were examined in triplicate, and individual compounds were identified based in the retention time of standards injected at the same conditions and their concentrations were determined using external calibration method. Calibration curves were constructed by injecting different concentrations of the standards under the same conditions for sample analysis and the areas obtained was plotted a linear curve whose equation was used to estimate the concentration of the compounds in the sample. GC-FID analysis The extraction of minor volatile compounds was performed according to the methodology proposed by Duarte et al. (2010). Extracts of volatile compounds were analyzed by gas chromatography (GC) using a Shimadzu GC model 17A, equipped with a flame ionization detector (FID) and a capillary column DB Wax (30 m x 0.25 mm i.d x 0.25 µm) (J & W Scientific, Folsom, Calif., U.S.A.). The operating conditions were: the oven temperature was maintained at 50C for 5 min, raised to 190C by increments of 3C min-1 and then kept at 190C for 10 min. Injector and detector temperature were kept at 230 and 240C respectively; the carrier gas (N2) was kept at a flow rate of 1.2 mL min-1. Injections of 1 µL were made in the split mode (1:10). The identification of volatile compounds was done by comparing the retention times of each compounds with those of standard compounds injected at the same conditions. The quantification of the volatile compounds was expressed as 4-nonanol (312 µg L-1 as internal standard) equivalents.
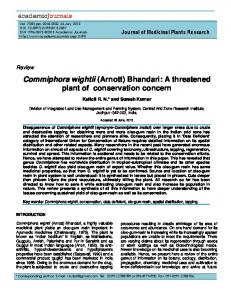
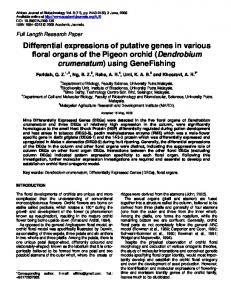
The dynamics of the microbial groups responsible for the fermentation of cassava, corn and sweet potato to produce calugi was analyzed. Throughout the calugi fermentation process, the predominant microorganisms were aerobic mesophilic bacteria (AMB). The population of AMB increased from 3.92 log to 6.95 log CFU mL-1 at the beginning (12 h) of fermentation. However, in the late stages of fermentation, the AMB counts showed a -1 declining tendency, decreasing to 4.47 log CFU mL . The population of AAB decreased from 3.82 log CFU mL-1 at -1 the onset of fermentation to 1.5 log CFU mL at 24 h, and after this time, there were no significant changes. The LAB count was approximately 3.7 log CFU mL-1 in all stages of fermentation. The Gram-negative Enterobacteriaceae were detected on VRBG agar, and the counts ranged from >1 log CFU mL-1 to 2 log CFU mL-1. Microbial community by PCR-DGGE Additionally to the microbial counts, PCR-DGGE was also used to analyze the profile of bacteria population in the cassava, corn and sweet potato porridge. The DGGE fingerprint is shown in Figure 3, and the results of the band sequencing are reported in Table 1. The sequencing for the identification of the bands revealed a 96 100% similarity with sequences in the GenBank database. In the first sampling time (T0), the identified bacteria were Corynebacterium variable (band 1), L. paracasei, L. plantarum, L. casei (bands 2, 3 and 4), uncultured Geobacteraceae bacterium (band 5), Bacillus spp. (B. cereus group) (band 6), uncultured bacteria (bands 7, 8 and 9), Streptomyces sp. (bands 10 and 12), Bacillus sp. (band 11), W. cibaria, W. confusa (bands 15 and 16), and S. salivarius (band 18). The species W. cibaria and W. confusa, in addition to E. cloacae, B. subtilis, and S. salivarius (bands 13, 17 and 18), were detected after 12 h and could be observed until 36 h of fermentation. After 48 h of fermentation, a lower diversity was observed: S. parasanguis (band 14), Bacillus spp. (B. cereus group) (band 6), W. cibaria, W. confusa and S. salivarius (bands 13, 17, and 18) were identified. The bands corresponding to L. casei (band 4), uncultured bacterium (band 5), B. cereus (band 6), uncultured bacteria (bands 7 and 8), W. cibaria (band 15), W. confusa (band 16) and S. salivarius (band 18) were found at all sampling times during the fermentation process.
Statistical analysis Principal component analyses were performed using the software XLSTAT 7.5.2 (Addinsoft‟s, New York, N.Y., U.S.A.) for the group data of the microbial counts, the carbohydrates present in the porridge and the metabolites produced during calugi fermentation.
Physicochemical and chromatographic analysis The pH value dropped from 6.20 to 4.03, indicating the spontaneous acidification of the product. The protein
844
Afr. J. Microbiol. Res.
Figure 3. Denaturing Gradient Gel Electrophoresis profiles of bacterial V3 regions of the16S rRNA gene amplified from calugi beverage throughout the 48 h of fermentation. The identification of the bands is reported in Table 1. Bands indicated by numbers were excised and after reamplification they were subjected to sequencing.
content increased, and decreasing concentrations of soluble starches were found throughout the fermentative process (Table 2). Maltose was the most abundant disaccharide throughout the fermentation process, and its concentration -1 reached a peak of 55.70 g L at 12 h of fermentation (Table 2). Glucose was found during the fermentation with the highest concentration (1.29 g L-1) measured at 12 h of fermentation. Fructose concentration increased within 12 h, but later, this carbohydrate was detected in decreasing amounts. Sucrose content was continuously consumed during fermentation and after 24 h it was no longer detected. The acids detected at the beginning of calugi fermentation were citric acid (0.87 g L-1), malic acid (0.92 g -1 -1 L ) and acetic acid (1.70 g L ). Acetic acid was the main metabolite produced at the onset of fermentation, and its concentration reached 5.47 g L-1 at 12 h. However, just 0.65 g L-1 of this acid was detected at 48 h. An increased
production of lactic acid occurred until the end of fermentation; this was observed after 24 h, reaching 3.54 -1 g L at 48 h. During the fermentation period, the amounts of malic, succinic, citric and propionic acids decreased, while the concentrations of oxalic acid remained stable. Tartaric acid was found from 24 h and was detected at low concentrations. The ethanol production during calugi fermentation was low (0.4 g L-1) at the end of the fermentation process. The glycerol concentration increased after 12 h and at the end -1 of the process, it was 3.0 g L . The methanol content at -1 -1 12 h was 0.23 g L and 0.1 g L at the end of the fermentation. GC-FID Analysis Twenty-one (21) compounds were identified and quantified during the calugi fermentation, including two alco-
Miguel et al.
845
Table 1. Identification based on BLAST comparison in GenBank, of the bands obtained by PCR-DGGE using universal primers for bacteria. a
Band(s) 1 2 3 4 5 6 7 8 9 10, 12 11 13 14 15 16 17 18
Close relative Corynebacterium variabile Lactobacillus paracasei Lactobacillus plantarum Lactobacillus casei Uncultured Geobacteraceae bacterium Bacillus cereus Uncultured bacteria Uncultured bacteria Uncultured bacteria Streptomyces sp. Bacillus sp. Enterobacter cloacae Streptococcus parasanguis Weissella cibaria Weissella confusa Bacillus subtilis Streptococcus salivarius
% similarity 97 99 100 99 96 100 98 97 99 99 98 97 99 100 100 97 99
a
b
Source CP 002917.1 FJ 861111.1 EF 426261.1 EF 348441.1 EF 668416.1 HQ 333012.1 DQ 635035.1 AB 241206.1 FN 780902.1 HM 018105.1 AY 176766 HM 438951.1 HQ 333012.1 HM 369807.1 HM 032145.1 GI 10967638.1 GU 425986.1
b
Bands are numbered as indicated on the DGGE gel shown in Figure 3. Acession number of the sequence of the closest relative found by BLAST search.
Table 2. Physical and chemical changes in calugi during 48 hours of fermentation.
Parameter pH Protein (%) Starch (%) Compounds (g/L)a Glucose Fructose Sucrose Maltose Glycerol Methanol Ethanol Acetic acid Lactic acid Citric acid Malic acid Succinic acid Propionic acid a
0 6.20 ± 0.13 13.38 ± 0.01 3.51 ± 0.01
Fermentation time (hours) 12 24 36 5.02 ± 0.05 4.59 ±0.05 4.32 ± 0.10 15.13 ± 0.04 15.31 ± 0.07 15.75 ± 0.01 3.46 ± 0.01 3.35 ± 0.08 3.14 ± 0.01
48 4.03 ± 0.10 16.36 ± 0.00 2.97 ± 0.00
0.60 ± 0.03 0.40 ± 0.05 2.79 ± 0.23 38.00 ± 3.76 0.02 ± 0.03 0.14 ± 0.02 0.26 ± 0.01 1.70 ± 0.11 0.00 ± 0.00 0.87 ± 0.06 0.92 ± 0.07 0.44 ± 0.02 0.64 ± 0.05
1.29 ± 0.29 2.11 ± 0.60 0.71 ± 0.16 55.70 ± 1.61 0.13 ± 0.00 0.23 ± 0.00 0.26 ± 0.00 5.47 ± 0.19 0.07 ± 0.00 0.73 ± 0.05 0.79 ± 0.03 0.40 ± 0.01 0.48 ± 0.02
0.53 ± 0.10 0.32 ± 0.06 nd 49.01 ± 1.24 2.98 ± 0.05 0.10 ± 0.00 0.40 ± 0.01 0.66 ± 0.10 3.54 ± 0.70 nd 0.10 ± 0.05 0.14 ± 0.02 0.60 ± 0.10
0.17 ± 0.01 0.79 ± 0.06 nd 37.81 ± 2.02 2.53 ± 0.01 0.09 ± 0.01 0.36 ± 0.00 0.66 ± 0.01 2.74 ± 0.03 nd 0.14 ± 0.00 0.17 ± 0.00 0.62 ± 0.01
0.38 ± 0.01 0.70 ± 0.01 nd 53.44 ± 3.17 2.83 ± 0.04 0.09 ± 0.00 0.38 ± 0.01 0.61 ± 0.00 3.20 ± 0.00 nd 0.13 ± 0.00 0.14 ± 0.00 0.60 ± 0.02
b
Determined by HPLC analysis; Not detected; The data are means of four replicates; ± standard deviation.
hols, three acetates, five acids, five aldehydes, two ethyl esters, three terpenoids and one acetal (Table 3). The identified volatile acids were butyric, hexanoic, octanoic, nonanoic and decanoic acids. Butyric acid was measured
only at 0 h, while octanoic and hexanoic acid were detected at 24 and at 36 h of fermentation, respectively. Nonanoic and decanoic acids were the most abundant compounds at the beginning of fermentation with concen
846
Afr. J. Microbiol. Res.
Table 3. Concentration of volatile compounds (µg/liter) identified during calugi fermentation.
Group Alcohols (2) Acetates (3)
Acids (5)
Aldehydes (5)
Ethyl esters (2) Terpenes (3) Others (1)
Compound (µg/L) Furfuryl alcohol 1,3 butanediol Ethyl acetate Isobutyl acetate Phenylethyl acetate Butyric acid Hexanoic acid Octanoic acid Nonanoic acid Decanoic acid Acetaldehyde Hexanal Octanal Furfural Decyl aldehyde Ethyl butyrate Diethyl malate a-Terpeniol b-Citronellol Guaiacol 1.1-dietoxyethane
0 20398.15 ± 12.8 759.32 ± 3.2 nd nd 783.83 ± 2.6 1222.85 ± 4.5 nd nd 580.18 ± 3.7 475.91 ± 7.4 nd nd nd 1273.98 ± 5.5 246.73 ± 4.3 nd 115.47 ± 7.4 143.49 ± 2.4 866.91 ± 6.0 126.09 ± 7.8 36.13 ± 1.1
Fermentation time (h) 12 24 230.35 ± 7.3 126.35 ± 5.4 nd nd 15.93 ± 4.4 8.78 ± 2.7 53.06 ± 8.0 148.25 ± 5.2 nd nd nd nd nd nd nd 63.58 ± 3.7 80.33 ± 2.2 258.05 ± 7.6 27.17 ± 0.3 141.03 ± 7.4 55.17 ± 6.0 45.10 ± 4.9 11.59 ± 0.9 nd 50.36 ± 6.2 nd 68.81 ± 1.3 nd 16.77 ± 3.7 nd 6.42 ± 0.3 nd nd nd nd nd 77.03 ± 6.8 nd nd nd 18.29 ± 6.3 72.21 ± 4.3
36 58.29 ± 3.0 nd 28.53 ± 0.7 114.30 ± 19.8 nd nd 24.11 ± 0.2 35.04 ± 4.6 22.89 ± 0.7 33.98 ± 6.8 102.39 ± 5.9 nd nd nd nd nd nd nd nd nd 89.12 ± 5.2
48 nd nd 9.16 ± 0.3 28.83 ± 0.8 nd nd nd 39.87 ± 9.0 36.26 ± 1.8 51.75 ± 9.7 56.51 ± 4.5 nd nd nd nd nd nd nd nd nd 82.14 ± 4.3
Nd, not detected.
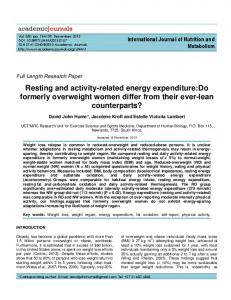
trations of 580.18 and 475.91 µg L-1, respectively. The furfuryl alcohol was found during the entire fermentation process at decreasing concentrations. The highest amount of this compound was 20,398.15 µg L-1 at the initial time of fermentation (Table 3). Five aldehydes were identified during the calugi fermentation: acetaldehyde, hexanal, octanal, furfural and decyl aldehyde. Furfural was detected throughout fermentation, and its highest concentration (1,273.98 µg L-1) was found in the T0 sample. Acetaldehyde and ethyl acetate were found from 12 h of fermentation. Isobutyl acetate was detected (28.83 µg L-1) at 48 h of fermentative process. Two ethyl esters were detected in the calugi; these compounds were identified as ethyl butyrate and diethyl malate. The latter was found in considerable amounts -1 (115.47 µg L ) at 0 h of fermentation. In the group of terpenes, α-terpeniol, b-citronellol and guaiacol were identified. These compounds were detected only at the beginning of fermentation. Multivariate analysis The principal component analysis (PCA) was performed to determine the relationship between the microbial population, the consumption of the substrates and some fermentation products to show which compounds may be
directly related to a specific microbial group (Figure 4). Principal components 1 (PC1) and 2 (PC2) together explained 88.02% of the total variance. The lower left quadrant (negative side of PC1 and PC2) shows 0 h of calugi fermentation. This sample was characterized by the presence of citric and malic acids, sucrose and starch at the beginning of the process. The upper left quadrant (positive side of PC2) shows 12 h of calugi fermentation, correlating the count in GYC medium showing the highest population of AAB with the production of acetic acid and the peaks of glucose and fructose. After 24 h of fermentation (positive side of PC1), the population of LAB (MRS count) was correlated with the production of lactic acid (Figure 4). DISCUSSION In this study, the bacterial population was slightly different compared to rice and corn calugi (Miguel et al., 2012). Ramos et al. (2011) also found high counts of mesophilic bacteria in a non-alcoholic indigenous fermented beverage produced using cottonseeds and rice. Mesophilic bacteria are commonly found in fermented foods and beverages from cereals and tubers (Almeida et al., 2007; Miguel et al., 2012). The population found in fermented porridge from cassava and corn was lower than that
Miguel et al.
847
Figure 4. Principal component analysis (PCA) of enumeration and physical parameters during calugi fermentation.
reported by Almeida et al. (2007) and Ramos et al. (2010). This difference could be due to the inoculum and the different substrates used for the beverage preparation. The use of culture-independent techniques has enabled us to determine the LAB succession during the fermentation of calugi. Different strains of LAB were detected with the progression of fermentation, and there was a decrease in the diversity of bands over time. Interesting fact can be observed in Table 2 where in the lactic acid also increased during fermentation. The analysis of the PCR-DGGE V3 regions revealed that the facultative heterofermentative L. plantarum, L. casei and L. paracasei were dominant at the initiation of the fermentation, but that at the later stages, the obligatory heterofermentative and homofermentative W. cibaria, W. confusa, S. salivarius and S. parasanguis were the dominant LAB. Species L. plantarum, L. paracasei, L. casei, and W. confusa were identified by the DGGE technique in other cereal-based foods such as a rice and peanut beverage (Ramos et al., 2010), cottonseeds and rice (Ramos et al., 2011), cassava dough (Miambi et al.,
2003) and togwa (Mugula et al., 2003). Microorganisms from B. subtilis, the Bacillus spp. (B. cereus group) and other Bacillus sp. were the main mesophilic microorganisms detected during fermentation. These species have been detected in other indigenous fermentations of cassava in Brazil and Africa (Almeida et al., 2007; AmoaAwua and Jakobsen, 1995; Assanvo et al., 2006; Padonou et al., 2009; Santos et al., 2012). For the first time, Streptomyces sp. was detected in cassava and corn fermentations. This actinobacteria are heterotrophic feeders, and they can utilize both simple and complex molecules as nutrients (Yang and Wang, 1999). In addition to the above mentioned species, E. cloacae was the GNE detected by the PCR-DGGE method, bacteria from these genera were also shown to be present in indigenous beverages in Brazil (Miguel et al., 2012, Ramos et al., 2010, 2011; Santos et al., 2012). Despite the high population of AAB found by plating, DGGE was not able to detect the acetic acid bacteria, which may be due to nucleic acid extraction efficiency and selective amplification of 16S rRNA genes (Miambi et al., 2003, Ramos et al., 2011). This finding illustrates the
848
Afr. J. Microbiol. Res.
intrinsic limitation of DGGE analysis in visualizing only the predominant species of a microbial community (Muyzer and Smalla, 1998). Considering specific limitations of both cultivation-independent and cultivationdependent methods, a polyphasic approach for broadcoverage biodiversity studies of complex ecosystems is recommended (Scheirlinck et al., 2008). There was a slight increase in the ethanol concentration after 24 h; this increase probably resulted from the LAB activity of heterofermentative (such as L. plantarum, L. casei and L. paracasei) during fermentation of calugi, this group of organisms convert sugars into lactic acid, acetic acid, fumaric acid, ethanol and carbon dioxide. There was a drop in the pH of the porridge after 12 h of fermentation; this finding is consistent with the production of organic acids (Table 2), the presence of LAB and Bacillus spp. (B. cereus group). The final pH of calugi was approximately 4.0; the production of organic acids in fermented food commonly reduces the pH to values below 4.0, which ensures the microbiological safety of the product because some pathogens do not survive at this pH (Blandino et al., 2003). Low pH values (pH 4.0) were also found in cauim fermentation (Almeida et al., 2007), in fufu production (Fagbemi and Ijah, 2006; Oyewole, 2001) and in a cottonseed and rice beverage (Ramos et al., 2011). In acidic condition, the product is safer for consumption, because some pathogens do not survive at low pH. The species of the genera Bacillus and Corynebacterium are known for their ability to hydrolyze starch (Oyewole and Odunfa, 1989), and these bacteria could be responsible for the starch hydrolysis that often occurs in cassava. Maltose can be directly related to the conversion of starch to maltose/glucose by the enzymatic action of amylases common in microbial metabolism (Almeida et al., 2007, Panda et al., 2006). Starch hydrolysis by amylolytic enzymes contained in the roots of sweet potatoes produces mainly maltose sugar; the amylase from this tuber may have aided in the continuous release of maltose during fermentation. Organic acids identified in calugi fermentations include citric, succinic, acetic, lactic, malic, tartaric, propionic and oxalic acids. The lactic acid and acetic acid are the dominant organic acids, which can be explained by the presence of LAB during the entire fermentation process. The production of the lactic and acetic acids during the fermentation of maize dough porridge and their ability to inhibit a variety of organisms has been reported (Mensah et al., 1991). In the present study, the amount of citric acid was reduced, and from 24 h, was no longer detected; citric acid may have been metabolized to acetic acid, carbon dioxide and lactic acid. The lactic acid and acetic acid are the dominant organic acids. The multivariate analysis (PCA) allowed the correlation of the amounts of organic acids with the population of specific groups of microorganisms as detected by plating. The finding that
lactic and acetic acids are produced during calugi fermentation is in agreement with the results of Giraud et al. (1998), who concluded that heterofermen-tative lactic acid fermentation occurs in most of the spontaneously fermented cassava products in Africa. Propionic acid was detected at low concentrations in calugi fermentation. In addition, these organic acids may interact with other substances such as alcohols and aldehydes, which produce additional flavor compounds during the fermentation process (Liu et al., 2011). Volatile compounds were detected during the fermentation of calugi porridge, including alcohols, acetates, aldehydes, ethyl esters, terpenes and acetal (Table 3). Cassava and corn calugi had higher number of compounds identified in relation to rice and corn calugi; this may be due to the difference between the substrates for the preparation of porridge, since there were also differences observed for carbohydrates, alcohols and acids analyzed (Miguel et al., 2012). The compounds isobutyl acetate, nonanoic and decanoic acids were the main volatiles produced at 24 h of fermentation. However, at 36 h, the more abundant compounds were acetaldehyde and 1.1-dietoxyethane. The presence of aromas representative of diacetyl, acetic acid and butyric acid make fermented cereal based products more appetizing (Blandino et al., 2003). According to some authors, ethyl butyrate is characterized as having a fruity aroma, similar to papayas and apples, butter and sweetish (Czerny et al., 2008). Lactate and acetate are important flavor enhancers in fermented cereals (Onyango et al., 2000), and the latter has been reported to act as a flavor enhancer, sensitizing consumers toward other aromatic compounds in products such as sourdough, the effect being related to its actual concentration (Gobbetti and Corsetti, 1997). Furfuryl alcohol is a product of furfural reduction by many bacteria under aerobic conditions (Boopathy, 2009), which explains the high concentrations of both compounds at the initial time of fermentation of the calugi and decreased concentrations of the compound after 48 h. This compound is commonly formed during fermentation of cereals such as corn, rice, sorghum and others (Banigo and Muller, 1972). The terpene content is considered a positive quality factor of the product because terpenes contribute to its aroma, serving to differentiate it from other beverages, and supply floral nuances to the product (Dragone et al., 2009). The 1,1-dietoxyethane compound is an acetyl that has been used as a solvent, as an intermediate in chemical synthesis for the protection of the carbonyl group in ketones and aldehydes, and in the fragrance industry. Conclusion In conclusion, this report is important for characterizing
Miguel et al.
the microbiota, the metabolites produced and the physicochemical changes that occur during fermentation of calugi porridge, produced by the Javaé people. Understanding the microbial interactions and identifying the compounds responsible for the flavor and aroma during fermentation processes is required to deliver safe products, with desirable properties, and moreover, to maintain these traditions. ACKNOWLEDGEMENTS The authors thank Conselho Nacional de Desenvolvimento Científico e Tecnológico do Brasil (CNPq), Fundação de Amparo a Pesquisa do Estado de Minas Gerais (FAPEMIG) and CAPES (Coordenação de Aperfeiçoamento de Pessoal de Nível Superior) for the financial and scholarship support. REFERENCES Almeida EG, Rashid CCTC, Schwan RF (2007). Microbial population present in fermented beverage „cauim‟ produced by Brazilian Amerindians. Int. J. Food Microbiol. 120:146-151. Amoa-Awua WKA, Jakobsen M (1995). The role of Bacillus species in the fermentation of cassava. J. Appl. Bacteriol. 79:250-256. AOAC (Official methods of analyses of the association of official analytical chemists) (2000). Seventeenth ed. vol. 2. Association of Official Analytical Chemists, Gaithersburg. pp. 915-922. Assanvo JB, Agbo GN, Behi YEN, Coulin P, Farah Z (2006). Microflora of traditional starter made from cassava for attieke production in Dabou (Côte d‟Ivoire). Food Control 7:37-41. Banigo EOI, Muller HG (1972). Carboxylic acid pattern in ogi. J. Sci Food Agric. 23:101-111. Blandino A, Al-Aseeri ME, Pandiella SS, Cantero D, Webb C (2003). Review: ceral-based fermented foods and beverage. Food Res. Int. 36:527-543. Boopathy R (2009). Anaerobic biotransformation of furfural to furfuryl alcohol by a methanogenic Archaebacterium. Int. Biodeter. Biodegrad. 63:1070-1072. Czerny M, Christlbauer M, Fischer A, Granvogl M, Hammer M, Hartl C, Hernandez NM, Schieberle P (2008). Re-investigation on odour thresholds of key food aroma compounds and development of an aroma language based on odour qualities of defined aqueou s odorant solutions. Eur. Food Res. Tech. 228:265-273. Dragone G, Mussatto SI, Oliveira JM, Teixeira JA (2009). Characterization of volatile compounds in an alcoholic beverage produced by whey fermentation. Food Chem. 112:929-935. Duarte WF, Dias DR, Oliveira JM, Teixeira JA, Silva JBA, Schwan RF (2010). Characterization of different fruit wines made from cacao, cupuassu, gabiroba, jabuticaba and umbu. Food Sci. Technol. 43:1564-1572. Fagbemi AO, Ijah UJJ (2006). Microbial population and biochemical changes during production of protein-enriched fufu. World J. Microbiol. Biotechnol. 22:635-640. Giraud E, Champailler A, Moulard S, Raimbault M (1998). Development of aminiaturized selective counting strategy of lactic acid bacteria for evaluation of mixed starter in a model cassava fermentation. J. Appl. Microbiol. 84:444-450. Gobbetti M, Corsetti A (1997). Lactobacillus sanfransisco a key sourdough lactic acid bacterium: a review. Food Microbiol. 14:175187. Kim TW, Lee JH, Kim SE, Park MH, Chang HC, Kim HY (2009). Analysis of microbial communities in doenjang, a Korean fermented soybean paste, using nested PCR-denaturing gradient gel electrophoresis. Int. J. Food Microbiol. 131:265-271.
849
Liu S, Han Y, Zhou Z (2011). Lactic acid bacteria in traditional fermented Chinese foods. Food Res. Int. 44:643-651. Mensah P, Tomkins AM, Drasar BS, Harrison TJ (1991). Antimicrobial effect of fermented Ghanaian maize dough. J. Appl. Microbiol. Biotechnol. 70:203-210. Miambi E, Guyot JP, Ampe F (2003). Identification, isolation and quantification of representative bacteria from fermented cassava dough using an integrated approach of culture-dependent and culture-independent methods. Int. J. Food Microbiol. 82:111-120. Miguel MGCP, Santos MRRM, Duarte WF, Almeida EGA, Schwan RF (2012). Physico-chemical and microbiological characterization of corn and rice „calugi‟ produced by Brazilian Amerindian people. Food Res. Int. 49:524-532. Mugula JK, Nnko SAM, Narvhus JA, Sorhaug T (2003). Microbiological and fermentation characteristics of togwa, a Tanzanian fermented food. Int. J. Food Microbiol. 80:187-199. Muyzer G, Smalla K (1998). Application of denaturing gradient gel electrophoresis (DGGE) and temperature gradient gel electrophoresis (TGGE) in microbial ecology. Anton Van Leeuw. 73:127-141. Oguntoyinbo FA, Dodd CER (2010). Bacterial dynamics during the spontaneous fermentation of cassava dough in gari production. Food Control. 21:306-312. Onyango C, Okoth MW, Mbugua SK (2000). Effect of drying lactic fermented uji (an East African sour porridge) on some carboxylic acids. J. Sci. Food Agric. 80:1854-1858. Ovreas L, Forney L, Daae FL, Torsvik V (1997). Distribution of bacterioplankton in meromictic Lake Saelenvannet, as determined by denaturing gradient electrophoresis of PCR-amplified gene fragments coding for 16S rRNA. Appl. Environ. Microbiol. 63:3367-3393. Oyewole OB (2001). Characteristics and significance of yeasts involvement in cassava fermentation for „fufu‟ production. Int. J. Food Microbiol. 65:213-218. Oyewole OB, Odunfa SA (1989). Effects of fermentation on the carbohydrate, mineral, and protein contents of cassava during “Fufu” production. J. Food Composit. Anal. 2:170-176. Padonou SW, Nielsen DS, Hounhouigan JD, Thorsen L, Nago MC, Jakobsen M (2009). The microbiota of Lafun, an African traditional cassava food product. Int. J. Food Microbiol. 133:22-30. Panda SH, Parmanick M, Ray RC (2006). Lactic acid fermentation of sweet potato (Ipomoea batatas L.) into pickles. J. Food Process. Preserv. 31:83-101. Ramos CL, Almeida EG, Freire AL, Schwan RF (2011). Diversity of bacteria and yeast in the naturally fermented cotton seed and Rice beverage produced by Brazilian Amerindians. Food Microbiol. 28:1-7. Ramos CL, Almeida EG, Pereira GVM, Cardoso PG, Dias ES, Schwan RF (2010). Determination of dynamic characteristics of microbiota in a fermented beverage produced by Brazilian Amerindians using culture-dependent and culture-independent methods. Int. J. Food Microbiol. 140:225-231. Santos CCAA, Almeida EG, Melo GVP, Schwan RF (2012). Microbiological and physicochemical characterisation of caxiri, an alcoholic beverage produced by the indigenous Juruna people of Brazil. Int J Food Microbiol. 156:112-121. Scheirlinck I, Van der Meulen R, Van Schoor A, Vancanneyt M, De Vuyst L, Vandamme P, Huys G (2008). Taxonomic structure and stability of the bacterial community in Belgian Sourdough ecosystems as assessed by culture and population fingerprinting. Appl. Environ. Microbiol. 74:2414-2423. Schwan RF, Almeida EG, Souza-Dias MA, Jespersen L (2007). Yeast diversity in rice-cassava fermentations produced by the indigenous Tapirapé people of Brazil. FEMS Yeast Res. 7:966-972. Wagley C (1988). Lágrimas de boas vindas: Os índios Tapirapé do Brasil Central. Editora da Universidade de São Paulo, Brazil. 160p. Yang SS, Wang JY (1999). Protease and amylase production of Streptomyces rimosus in submerged and solid state cultivations. Botanic Bulletin Acad Sinica. 40:259-265.