URBAN FOOTPRINT DYNAMICS IN INDIAN METROPOLIS PRIYADARSHINI J SHETTY, SHASHIKALA V, RAMACHANDRA T V CENTRE FOR INFRASTRUCTURE, SUSTAINABLE TRANSPORTATION AND URBAN PLANNING [CISTUP], INDIAN INSTITUTE OF SCIENCE, BANGALORE 560012 Email:
[email protected],
[email protected],
[email protected]
ABSTRACT Urban footprint is the amount of land required to sustain urban metabolism including the process of waste assimilation. The basic indicator to quantify urban footprint is the proportion of built up and the reduction of other land use types. This analysis gains importance in the context of rapid urbanization and consequent pressure on land, water, energy and infrastructure. Urbanisation in India is taking place at a faster rate with urban population growing at around 2.3 percent per annum. Understanding the dynamics of urban expansion is critical for providing basic amenities and infrastructure. Multi resolution remote sensing data provides the spatial data on temporal scale which is useful to capture urban footprint dynamics. This paper focuses on urban footprint dynamics for four Indian metropolis using Landsat time-series data since 1970’s. Various spatial metrics have been computed to understand the urban dynamics and its implications on other land uses. At city level the use of this metrics for administrative and composite (administrative+sprawl) boundary of a city gives us the spatiotemporal patterns of urbanization, and enable comparison across all cities. This work illustrates of the usefulness of metrics as possible instruments in devising land-use policy for future urban growth. Key words: Urbanization, urban footprint, landscape metrics.
1.
Introduction
Urbanization is the process through which cities and towns develop and grow. It includes the movement of people from rural areas to urban areas as well as movements among towns and cities (Carole Rakodi and Fiona Nunan, 2002), whereas urban footprint is the amount of land required to sustain urban metabolism, that is, to provide the raw materials on which it feeds, and process of urban waste assimilation. The basic indicator to quantify urban footprint is the proportion of built up and the reduction of other land use types. This analysis gains importance in the context of rapid urbanization and consequent pressure on land, water, energy and infrastructure. The graph of metropolitan and mega cities has continued to climb and 35 such cities now dot the Indian landscape. And scores of cities with populations in excess of 100,000 are joining the million-plus city club. India's urban issues with all their related challenges and opportunities demand the need for urban studies. India’s urban population is projected to increase to 590 million (in 2030) from 340 million (in 2008) as per the report India’s urban awakening: Building inclusive cities, sustaining economic growth. The number of Indian mega cities will double from the current three (Mumbai, Delhi and Kolkata) to six by the year 2021 (new additions will be Bangalore, Chennai and Hyderabad), when India will have the largest concentration of mega cities in the world (Chakrabati, 2001). Urban expansion takes places in substantially different forms. In any given city, new urban expansion can take place with the same densities (persons per square kilometer) as those prevailing in existing built-up areas, with increased densities, or with reduced densities. It can take place through the redevelopment of built-up areas at higher densities, through infill of the remaining open spaces in already built-up areas, or through new development in areas previously in non-urban use. New development can either be contiguous with existing built-up areas or can “leapfrog” away from them, leaving swaths of undeveloped land that separate it from existing built-up areas. It can encroach upon wetlands, watersheds, forests, and other sensitive environments that need to be protected, as well as upon farms, fields, and orchards surrounding the city. Unplanned urbanisation is resulting in unplanned and haphazard growth of large cities with negative effects on urban dweller as well as on their environment. Thus, understanding and monitoring past and current urbanization processes is essential for sustainable urban planning. In this context, remote sensing (RS) techniques have been useful understand the spati-temporal pattern of urban areas at various scales, and as data sources for the analysis of urban land cover change (Donnay et al, 2001; Batty and Howes 2001; Herold et al, 2002). The objective of this study is to analyse the spatio-temporal urban growth of four Indian mega cities- New Delhi, Mumbai, Kolkata and Hyderabad with a 10 km buffer around the already existing city boundaries 2.
Study Areas and Data
This study has been carried out focusing on the current mega cities - New Delhi, Mumbai (Bombay), and Kolkata (Calcutta) and Hyderabad. Mumbai (with a population of 16.37 million) is located at the west coast in the state Maharashtra. Delhi (with 13.78 million population) located in northern India on the flood plains of river Yamuna, has the status as the National Capital Territory and has. Kolkata (13.22 million population)_, the capital of the Indian state West Bengal, is located in eastern India in the Ganges Delta in a flat surrounding at the Hooghly River and Hyderabad city (6.42 million population) is situated in the heart of the Deccan Plateau at an average height of 540 m. Spatial growth of these cities has been analysed using temporal remote sensing data. The RS data were obtained from the Global Land Cover Facility (GLCF – http://www.landcover.org/), and from the U.S. Geological Survey (USGS) and NASA’s Landsat mission website. Beginning October 2008, the archived data of the Landsat missions were made available freely by USGS. Accordingly, the cloud free data corresponding to1990s and 2010 were downloaded and processed. Since 1982 the Thematic Mapper (TM) has
operated with 30 meter geometric resolution and seven spectral bands. Since 1999 the Enhanced Thematic Mapper (ETM) has operated with an additional panchromatic band and 15 meter geometric resolution. Having continuous, constant spectral bandwidths guarantees the comparability of the different sensors. With its field of view of 185 km the satellite is able to survey the large metropolitan areas of the study sites. Measurement of areal coverage and spatial distribution are both needed to describe the morphology of an urban area adequately (Schweitzer et al. 1998). 3.
Method
Method adopted for analysis of urban dynamics is given in figure 1. The analyses involved: i. Image registration and geo-correction of the RS data of varying spatial and temporal resolutions. ii. Generation of false colour composite (FCC) using band 2 (Green), 3 (Red) and 4 (NIR) to identify heterogeneous patches. iii. Collection of training data from FCC and Google Earth images (http://www.earth.google.com). iv. Unsupervised classification of the RS data was done with the help of the number of distinct peaks in the histogram.
v. Land use supervised classification into 4 classes – built-up, water bodies, agriculture and vegetation, and others (including all other categories) using Maximum Likelihood classifier using IDRISI Andes (Eastman, 2006; http://www.clarklabs.org). Further, the classified images were recoded to identify the expansion of built-up from 1990s to 2010.
vi. Accuracy assessment of the classified images using test data and Google Earth images. vii. Computation of spatial metrices - A wide variety of indices developed to characterize landscapes has often been applied to study spatial landscape patterns in the field of landscape ecology; they can be categorized into: area/density/edge, shape, core area, isolation/proximity, contrast, contagion, connectivity, and diversity metrics (McGarigal and Marks, 1994). But, only recently has landscape metrics been used in the study of urban morphology (Seto and Fragkias, 2005). The proliferation of landscape metrics, together with the use of remote sensing technology, provides a potential means for analyzing the spatial patterns of urban evolution (Yu and Ng, 2007). Different metrics have been used depending upon the land use and on considering the type of land use planning . Fragmentation analysis is done as it portrays the breaking up of a cohesive habitat into smaller and more isolated parcels (Forman, 1995). Various metrics computed are: a)
Shannon's Diversity Index {Entropy} (SHDI) - Shannon’s diversity index is a popular measure of diversity in community ecology, applied here to patches in the landscape. SHDI = 0 when the landscape contains only 1 patch (i.e., no diversity). SHDI increases as the number of different patch types (i.e. patch richness) increases and/or the proportional distribution of area among patch types becomes more equitable. Moreover, it is demonstrated that heterogeneity (pattern) and entropy can be considered as equivalent terms. In the present study, entropy is used as a measure of the fragmentation process, i.e. a measure of dispersion of built-up patches. Lower the index indicates compactness of the patches, while higher the index (not greater than log (n)) indicates more dispersion of the patches. b) Patch Density :-This represents the number of patches corresponding to each class type for the total landscape area. The patch density increases during the period of urban sprawling where urban patches are dispersed and spread across, while the patch density decreases when the urban patch reaches a stage of dense urban growth, and forms into one single urban patch.
c)
Perimeter area fractal dimension (PAFRAC) - This reflects shape complexity across a range of spatial scales. PAFRAC approaches 1 for shapes with very simple perimeters such as squares, and approaches 2 for shapes with highly convoluted, plane-filling perimeters. d) Clumpiness index (CLUMPY): This is computed such that it ranges from -1 when the patch type is maximally disaggregated to 1 when the patch type is maximally clumped. It returns a value of zero for a random distribution, regardless of Pi. Values less than zero indicate greater dispersion (or disaggregation) than expected under a spatially random distribution, and values greater than zero indicate greater contagion. Hence, this index provides a measure of class-specific contagion that effectively isolates the configuration component from the area component and, as such, provides an effective index of fragmentation of the focal class that is not confounded by changes in class area. The remote sensing data was obtained from the Global Land Cover Facility (GLCF – http://www.landcover.org/), and from the U.S. Geological Survey (USGS) and NASA’s Landsat mission website. Beginning October 2008, the archived data of the Landsat missions are made available freely by USGS. Accordingly, the cloud free data corresponding to the years 1990s and 2010 were downloaded and processed. The remote sensing data are processed to quantify the land cover of respective cities broadly into 4 classes – built-up, water bodies, agriculture and vegetation, and others (including all other categories). The multi-spectral data of Landsat TM with a spatial resolution of 30 m each were analyzed using IDRISI Andes (Eastman, 2006; http://www.clarklabs.org). The image analyses included image registration, rectification and enhancement, false colour composite (FCC) generation, and classification. The False color composite of the image are obtained by combining different band types depending upon the requirement, here bands 2, 3 and 4. Subsequently, the classification of the multi-spectral remote sensing data is carried through a multi-stage classification process: Unsupervised method and supervised method. In the supervised classification method the signatures were derived from the training data obtained from Google earth. The signatures generated for each of the land cover were verified with the composite image. Based on these signatures, corresponding to various land features, supervised image classification was carried out using Gaussian Maximum Likelihood Classifier.
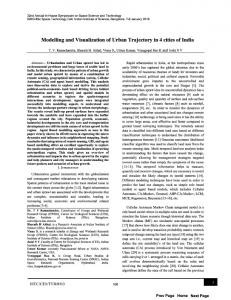
Figure 1: Overall methodology to identify the urban footprints. . 4.
Results and discussions:
The process of urban land-cover change is most commonly described as either a change in absolute area of urban space (a measure of extent) or the pace at which nonurban land is converted to urban uses (a measure of rate) (Seto et al. 2005). This study shows that the growth rate of Hyderabad for the 20 years time period has increased almost 3 times its area from 1990, whereas for Kolkata the size has increased twice, Delhi and Mumbai has followed the same pattern with increase of about around 100 sq. kms.
Figure 2: Classified images of Delhi, Mumbai, Kolkata and Hyderabad for 2010 and 1990’s
Table 1: Built-up in Sq.km
Built-up 30.00 25.00 20.00 15.00 1990 10.00 2010 5.00 0.00 Delhi
Kolkata
Hyderabad
Mumbai
Figure 3: Built-up for the cities in percentage 4.1 Landscape metrics: The entropy values for Delhi and Hyderabad cities are showing increase in entropy indicating dispersed growth (Table 2, Figure 4) in the region during the period, whereas in Mumbai and Kolkata there is a small marginal increase in both the years showing no change in its built-up growth.
SHDI 1.5 1 1990 0.5
2010
0 Delhi
Table 2: Shannon’s Entropy index
Mumbai
Kolkata
Hyderabad
Figure 4: Entropy values for the 4 cities
There is slight increase in the patch density (Figure 5) for Delhi and Mumbai, in case of Hyderabad the trend is decreasing indicating dense urban growth, while for Kolkata the patch density has increased greatly for the time period indicating dispersed patches of urban growth in outskirts of the city as well as in the city centers in a ring-shaped manner. While in case of Hyderabad city the patch density is decreased indicating re-densification of urban patches in the region.The PD of Delhi and Mumbai stays constantly at a low level highlighting a laminar coalescence and a laminar urban footprint.
The PAFRAC value for Delhi and Kolkata city is increasing from 1990’s to 2010 indicating the urban patches are becoming more irregular/convoluted in its shape, Mumbai city is retaining the complexity of its urban patches with no much changes in its PAFRAC values. While Hyderabad is differing from the above cities with decreasing PAFRAC values indicating that, with re-densification the urban patches are becoming more regular in its shape. Clumpiness index for Delhi, Mumbai and Hyderabad cities have not changed greatly indicating almost the urban patches are disaggregated, as for Kolkata the patches are increasingly disaggregated, from 1990’s to 2010.
Figure 5: Patch density for Built-up of the 4 cities
Figure 6: PAFRAC index for Built-up of 4 cities
PAFRAC
Patch Density 1.55 1.4 1.2 1 0.8 0.6 0.4 0.2 0
1.5 1.45 1990
1.4
2010
1.35
1998 2010
1.3 Delhi Delhi
Mumbai
Hyderabad
Mumbai
Hyderabad
Kolkata
Kolkata
CLUMPINESS 1 0.8 0.6
1998
0.4
2010
0.2 0 Delhi
Mumbai
Hyderabad
Kolkata
Figure 7: Clumpiness index of Built-up for 4 cities
5.
CONCLUSION
The study has demonstrated that urbanization and its spatiotemporal form, pattern and structure can be quantified and compared across cities using spatial metrices. With the urban growth in India increasing, the need to understand the type of growth is important to plan the cities efficiently. Urban growth in India may take various spatial forms, depending upon the type of development, however, many parameters in Delhi, Mumbai, Kolkata and Hyderabad showed similar results. Especially Delhi and Mumbai have shown very similar growth type corresponding to the spatiotemporal urbanization and built-up density gradients. The entropy value for Hyderabad has increased showing randomness in the growth pattern, while for other cities, the randomness is minimum. The patch density has increased in Kolkata for the time period indicating dispersed patches of urban growth in outskirts of the city as well as in the city centers in a ring-shaped manner. PAFRAC for Hyderabad is differing from the other cities with decreasing values indicating that, with re-densification the urban patches are becoming more regular in its shape. Clumpiness index for Kolkata are decreased showing increasingly disaggregated patches. Kolkata and Hyderabad, is undergoing changes in the urban form. Due to different urban topographic conditions in combination with socio-economic and political impacts Indian cities do not show a standard form. But nevertheless aspects of spatial urban growth proceeded very similar. The time series landscape metrics is important for describing, understanding and monitoring the spatial configuration of urban growth. Measuring the development stages of the Indian cities, help us decide the planning of the growth of the cities.
REFERENCES: i) ii) iii) iv)
v) vi)
vii) viii) ix) x) xi)
Batty, M. & Howes, D. predicting temporal patterns in urban development from remote imagery Chakrabati, P.G.D. Urban crisis in India: New initiatives for sustainable cities Development in practice, 2001, Vol. 11 (2-3), pp. 260-272 Donnay, J.P., B.M.J. & A., L.P. Remote sensing and urban analysis Taylor and Francis, 2001 H Taubenbock, M Wegmann, C.B.M.B.A.R. & Mehl, H. Spatiotemporal analysis of Indian mega cities The International Archives of the Photogrammetry, Remote Sensing and Spatial Information Sciences. Vol. XXXVII. Part B2. 2008 H.S. Sudhira, T.V. Ramachandra, K.S.R. & Jagadish, K. Urban Growth Analysis Using Spatial and Temporal Data Journal of the Indian Society of Remote Sensing, 2003, Vol. 31, 4 Hannes Taubenböck, Isabelle Pengler, B.S.S.C.M.H.A.R. A multi-scale urban analysis of the Hyderabad metropolitan area using remote sensing and GIS Urban Remote Sensing Joint Event 2007 Herold, M., G.N.C.C.K.C. The spatiotemporal form of urban growth: measurement, analysis and modeling Remote Sensing of Environment, 2003, Vol. 86, pp. 286-302 Herold, M., S.J.C.K.C. The use of remote sensing and landscape metrics to describe structures and changes in urban land uses. Environment and Planning, 2002, Vol. 34, pp. 1443-1458 Raghavswamy V, Pathan SK, M.P.B.R.P.P. IRS-1C applications for urban planning and development Current Science, 1996, Vol. 70 (7), pp. 582-588 Seto, K., C.F.M. Quantifying spatiotemporal patterns of urban land-use change in four cities of China with a time series of landscape metrics. Landscape Ecology, 2005, Vol. 20, pp. 871-888 Wu, J.Y. ·.Z.Y. ·.H.Z. ·.S.X. ·.X.H. ·.J. ·.J. Monitoring urban expansion and land use/land cover changes of Shanghai metropolitan area during the transitional economy (1979–2009) in China Environmental monitoring assessment, 2010