Aug 21, 2006 - The low-level cloud amount exhibits a significant increasing trend during the nighttimes, leading to the enhanced atmospheric counterradiation, ...
GEOPHYSICAL RESEARCH LETTERS, VOL. 33, L22704, doi:10.1029/2006GL027946, 2006
Change of cloud amount and the climate warming on the Tibetan Plateau Anmin Duan1 and Guoxiong Wu1 Received 21 August 2006; revised 25 September 2006; accepted 19 October 2006; published 18 November 2006.
[1] Based on the 6-hourly weather observations at 71 stations across the central and eastern Tibetan Plateau (TP) during 1961– 2003, the change of cloud amount and its possible connection with recent climate warming on TP were investigated. The low-level cloud amount exhibits a significant increasing trend during the nighttimes, leading to the enhanced atmospheric counterradiation, weakened effective terrestrial radiation, and the subsequently strong nocturnal surface warming. On the other hand, both the total and low-level cloud amounts during daytime display decreasing trends, resulting in more absorbing of direct solar radiation at the surface and the associated surface warming. Since the increase in nocturnal low-level cloud is more than the decrease of daytime low and total cloud amounts, such changes in cloud amount contribute to at least partly of the increased surface air temperature and its diminished diurnal range on TP. Citation: Duan, A., and G. Wu (2006), Change of cloud amount and the climate warming on the Tibetan Plateau, Geophys. Res. Lett., 33, L22704, doi:10.1029/2006GL027946.
1. Introduction [2] The Tibetan Plateau (TP) is the highest and largest highland in the world and exerts profound influences not only on the local climate and environment but also on the global atmospheric circulation through its thermal and mechanical forcing [e.g., Wu, 1984; Manabe and Broccoli, 1990; Yanai et al., 1992; Duan and Wu, 2005; Yanai and Wu, 2006]. Growing evidence [e.g., Liu and Chen, 2000; Niu et al., 2004] has demonstrated that a significant climate warming occurred there during the last half century. Recent analysis [Duan et al., 2006] has also shown that the climate warming is featured by strong increase of the nocturnal surface air temperature. Previous studies [Karl et al., 1991, 1993; Easterling et al., 1997] suggested that the increase of the global mean surface air temperature during the 20th century is partly caused by the daily minimum temperature increasing at a faster rate than the daily maximum. This imbalanced temperature changing rate also leads to a decrease in the diurnal temperature range (DTR) in many parts of the world. However, the changes of cloud amount and the related radiation flux on TP have not been discussed in previous studies. This work uses 6-hourly weather observations at 71 stations located on the central and eastern TP together with the daily records of surface radiation flux 1 State Key Laboratory of Numerical Modelling for Atmospheric Sciences and Geophysical Fluid Dynamics, Institute of Atmospheric Physics, Chinese Academy of Sciences, Beijing, China.
Copyright 2006 by the American Geophysical Union. 0094-8276/06/2006GL027946
at Golmud (34°440N, 101°360E, 3501 m above sea level) in the period 1961 – 2003 provided by China Meteorological Administration to investigate the long term trend of cloud amount and its connection with the recent climate warming on TP.
2. Results [3] One prominent feature of the TP climate is the much larger DTR compared to its adjacent plain regions at the same latitudes, which is due to its intense daytime solar radiation heating and nocturnal long wave radiation cooling [Yeh and Gao, 1979]. However, during the passed decades, the DTR has diminished remarkably when strong warming happened (Figure 1). The 71-station averaged warming amplitude in annual mean surface air temperature is of 0.25°C/decade and obviously larger than that for the global during 1976 – 2000 (about 0.15°C/decade [Intergovernmental Panel on Climate Change, 2001]. Considering the fact that the surface air temperature on TP is much lower than that in the adjacent plain regions, TP is therefore one of the most significant warming areas of the world. Similar result has been reported in previous papers [Liu and Chen, 2000; Niu et al., 2004]. Meanwhile, the DTR has decreased at the rate of �0.12°C/decade, and the largest DTR diminished areas, such as the north TP and south fringe of the central TP, are in accordance with the areas of the strongest warming. Note that for sparse station distribution, the case in the western TP was not discussed here. But similar results have been documented by Duan et al. [2006] in term of observations at three western stations. [4] Local effects such as urban growth, irrigation, desertification, and variation in local land use can affect the DTR [Karl et al., 1993], but these effects are minimal here because TP is a highly elevated large area with small population. Satellite data indicate that the change of landscape in TP is not so obviously compared to other parts of China [Liu et al., 2005]. However, effects of urbanization may be felt immediately in the eastern rather than western TP for relatively more population. Large-scale climatic effects on the DTR include increases in cloud cover, surface evaporative cooling from precipitation, greenhouse gases, and tropospheric aerosols. Studies indicated that there is a strong relation between trends of the DTR and decreases in pan evaporation over the former Soviet Union and the United States [Peterson et al., 1995], suggesting that the DTR decrease in these areas is influenced by increase of cloud amount and reduced insolation. However, in Figure 2 we can see that the total cloud amount (0 – 10 tenths of sky cover) at all times decreased rapidly over the central and eastern TP when the surface warming occurred. Its relative changing rates (RCR, defined as (Be � Bb)/Bb of a time
L22704
1 of 5
L22704
DUAN AND WU: CLIMATE WARMING ON TIBETAN PLATEAU
L22704
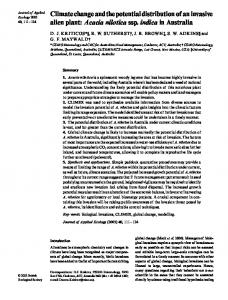
Figure 1. Linear variation rates of (a) annual mean surface air temperature and (b) diurnal range of the surface air temperature (DTR) during 1961– 2003 in units of °C/decade. Triangles, open circles, and solid circles denote stations equal to or higher than 4000, 3000, and 2000 m, respectively. The cyan area represents the Tibetan Plateau area with the average altitude higher than 2500 m. The station of Golmud is located at 34°440N, 101°360E with the height of 3501 m above sea level. series, Be and Bb are the ending and beginning values of its linear trend line, respectively) at 0000, 0600, 1200, and 1800 Lhasa Time (LT) are �9.4%, �5.5%, �5.9%, and �4.7%. This is consistent with the overall case in China [Kaiser, 1998, 2000] but is opposite to the former Soviet Union [Kaiser and Razuvaev, 1995], United States [Angell, 1990], Europe [Henderson-Sellers, 1986], and Australia [Jones and Henderson-Sellers, 1992]. On the other hand, the trend of low-level cloud was totally different between day and night with a decreasing trend at noon in the RCR of �4.5% and an increasing trend in other periods especially at dawn (the RCRs are 4.5% for 0000 LT, 7.6% for 0600 LT, and 1.8% for 1800 LT, respectively). [5] During the nighttimes, the low-level cloud is in favour of the surface warming through enhancing the atmospheric counterradiation and weakening the effective terrestrial radiation [Peixoto and Oort, 1992]. Specifically, the low-level cloud amount accounts for nearly 60% of the nocturnal total cloud amount on the plateau. The role of low-level cloud in affecting the surface air temperature, therefore, is more significant. Actually, a significant negative correlation between the air temperature and total cloud amount exists during daytime over the TP, whereas the correlation between the surface air temperature and lowlevel cloud is of strongly positive during night and negative at noon (Table 1). [6] For long-term trend, change of cloud amount plays a key role in influencing the climate change although clouds remain a dominant source of uncertainty [Intergovernmental Panel on Climate Change, 2001]. Over the central and eastern TP, the decreased total and low-level cloud amounts during daytime are propitious to receive more solar radiation and the resultant surface warming. On the other hand, the increased nocturnal low-level cloud amount can result in the surface warming during nighttime. Furthermore, the larger amplitude of the increasing of nocturnal low-level cloud amount compared to the decreasing of daytime total and low-level cloud amount is in favour of the stronger warming during night than that during day. Difference in warming amplitude between day and night provides support for this hypothesis. In the period 1961 – 2003, the linear warming rates at four times (0000, 0600, 1200, and 1800 LT) are 0.29, 0.29, 0.18, and 0.27°C/decade corresponding to RCRs of 85%, 181%, 8%, and 16%, respectively. Appar-
ently, the warming at both midnight (0000 LT) and dawn (0600 LT) is much larger than that at noon (1200 LT). [7] Whether the increased nocturnal low-level cloud amount is the major contribution to such a striking nocturnal warming still need further investigation, nevertheless it certainly acts as an important factor in inducing the nocturnal climate warming on TP. Usually, the maximum and minimum surface air temperature occurs respectively near the noon and dawn. The largest increase of low-level cloud amount at dawn and remarkable decrease of both total and low-level cloud amounts at noon can therefore affect the
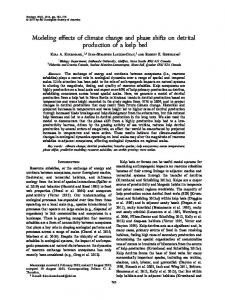
Figure 2. Annual mean times series of the 71-station averaged (a) surface air temperature, (b) low-level cloud amount, and (c) total cloud amount in the period of 1961– 2003. Temperature is in units of °C. Cloud amount varies from 0 to 10 tenths of sky cover. Red, yellow, blue, and green curves denote 0000 LT, 0600 LT, 1200 LT, and 1800 LT, respectively. Heavy lines denote linear trend.
2 of 5
DUAN AND WU: CLIMATE WARMING ON TIBETAN PLATEAU
L22704
Table 1. Simultaneous Correlation Coefficients at Four Different Times Between the 71-Station Averaged Annual Mean Surface Air Temperature and Cloud Amount in 1961 – 2003a Total cloud amount Low cloud amount
0000 LT
0600 LT
1200 LT
1800 LT
�0.32 0.45
�0.23 0.56
�0.69 �0.37
�0.58 0.04
a Here 0.26, 0.30, and 0.39 represent significant at the 90%, 95%, and 99% confidence level, respectively.
temperature diurnal cycle significantly. This is why there is a clear diminished DTR when the surface warming occurs. Moreover, abrupt increases (all the abrupt changes in this work are above the 95% confidence level by using moving t-test) of low-level cloud amount at 0000 and 0600 LT occurred in mid 1980s, in agreement with the rapid nocturnal surface warming. [8] The spatial distributions of changes in temperature and cloud amounts at both dawn and noon and their differences are shown in Figure 3. Corresponding to the overall warming, there is a widespread decreased trend of total cloud amount. On the other hand, the low-level cloud amount at dawn has increased in most areas especially over the northern and eastern TP, whereas the low-level cloud amount at noon has decreased over most TP except for the areas in Caidam Basin located in the northeastern TP and few other regions. It is worthy of noting that the increase of low-level cloud at dawn is larger than the decrease of total cloud at noon. The change of cloud amount, therefore, brought on not only the recent climate warming but also the diminished DTR on the plateau to a considerable degree. Meanwhile, compared to the overall increasing trend of air temperature at dawn, a few regions in the southern central TP present a decreasing trend in low-level cloud at dawn. Climate warming in these areas may then be ascribed to the decreased total cloud amount or other unknown reasons.
3. Further Analysis [9] Measurements of solar radiation at the surface have great importance for the evaluations of climate change and
L22704
global warming [Ramanathan et al., 2001], and radiative forcing caused by clouds, greenhouse gases, and aerosols have become a major topic of concern for the IPCC [2001]. Observation of surface solar radiation fluxes is available at 6 weather stations across the central and eastern TP. But only the Golmud station had continuous observations of the global radiation flux, diffuse radiation flux, as well as horizontal direct radiation flux throughout the period 1961– 2003. This station was then used as an example to investigate the long-term temperature trend in relation to the changes in cloud and radiation flux. Due to the radiation is based on daily total amount, the temperature and cloud amount were therefore correspondingly calculated as daily means averaged of four time values. Previous study [Che et al., 2005] based on the same database has indicated that global radiation and direct radiation had exhibited decreasing trends in 1961 – 2000 for many other parts of China. [10] The short wave heating rate and long wave cooling rate of cloud over the TP are larger than those over the plain areas, especially for the low-level clouds [Liu and Ye, 1991]. At Golmud, a significant positive correlation exists among the surface air temperature, low-level cloud amount, and direct radiation. But the correlation between the surface air temperature and diffuse radiation is strongly negative. The correlation coefficients between the annual mean surface air temperature and the low-level cloud amount, total cloud amount, horizontal direct radiation flux, diffuse radiation flux, and global radiation flux are 0.53 (above 99.9% confidence level), �0.1, 0.34, �0.44 (above 99% confidence level), and �0.01, respectively. Therefore, the lowlevel cloud amount is very important in influencing the surface air temperature but the total cloud amount seems nonsignificant at this station. Although the surface air temperature is strongly positive and negative correlations with the horizontal direct solar radiation flux and diffuse solar radiation flux, respectively, their combination effect in influencing surface air temperature tends to counteract each other. [11] Figure 4 shows the evolution of annual mean surface air temperature, DTR, low-level cloud amount, total cloud
Figure 3. Relative change rate (RCR) in percentage of (a – c) the surface air temperature, (d – f) total cloud amount, and (g – i) low-level cloud amount in the period of 1961– 2003 for 0600 LT (Figures 3a, 3d, and 3g), for 1200 LT (Figures 3b, 3e, and 3h), and representing the difference between 0600 LT and 1200 LT (Figures 3c, 3f, and 3i). Triangles, open circles, and solid circles are the same as in Figure 1. 3 of 5
L22704
DUAN AND WU: CLIMATE WARMING ON TIBETAN PLATEAU
L22704
change in radiation flux are fundamental in the surface warming on the TP.
4. Concluding Remarks
Figure 4. Annual mean time series at Golmud for years 1961 – 2003. (a) Surface air temperature, (b) DTR, (c) lowlevel cloud amount, (d) total cloud amount, (e) horizontal direct radiation flux, (f) diffuse radiation flux, and (g) global radiation flux. Temperature and DTR are in units of °C. Cloud amount varies from 0 to 10 tenths of sky cover. Units of radiation flux are 106 J m�2. Heavy lines denote linear trend.
amount, horizontal direct solar radiation flux, diffuse solar radiation flux, as well as global radiation flux at Golmud during 1961– 2003. The annual mean surface air temperature has increased substantially at a rate of 0.58°C/decade with the RCR of nearly 50%, listed in the most significant warming stations on TP. The surface warming is accompanied by a diminished DTR with the RCR of �20%. Meanwhile, the low-level cloud amount has increased remarkably with the RCR of 181% but the total cloud amount has reduced with the RCR of �6.3%. Consequently, the horizontal direct radiation flux received by land surface has increased 6.1%, and the diffuse radiation has decreased 14%. Because the intensity of the direct radiation flux is generally lager than that of diffuse radiation flux, the global radiation flux, which is the sum of them, has decreased only slightly with the RCR of �2.3%. The increased direct radiation flux and decreased diffuse radiation flux coincide with the reduced total and low-level cloud amount during daytime. Thus the change of cloud amount and the resultant
[12] Based on historical records at 71 meteorological stations across the central and eastern TP, this research revealed that during the past decades a significant change happened on the cloud amount and it is closely related to the recent climate warming and the diminished DTR over the TP. The increased low-level cloud amount during nighttime especially at dawn efficiently enhances the atmospheric counterradiation and weakens the effective terrestrial radiation, resulting nocturnal warming in large part. On the other hand, the decreased daytime total cloud amount is in favour of receiving more direct radiation in the surface layer and the resultant daytime surface warming. Moreover, the larger increase of nocturnal low-level cloud amount than the decrease of daytime total cloud amount further induce a diminished DTR to a considerable degree over the central and eastern TP. [13] The formation of cloud and the feedback mechanism between the surface air temperature and cloud amount are rather complicated and the reason why the nocturnal lowlevel cloud amount increased but the daytime low and total cloud amounts decreased requires further studies. Regional climate model results [Chen et al., 2003] have shown that the doubled global CO2 concentration could lead to the prominent winter cloud amount decreases at higher elevations on the eastern TP, and the associated net effect of the change of radiation fluxes was in favour of an enhanced surface warming. Moreover, some features of the climate warming on TP such as the large warming amplitude, diminished DTR, warmed upper troposphere and cooled lower stratosphere, as well as the significant climate change after the mid 1980s, have been reproduced by two coupled climate models forced by observed CO2 concentration of the 20th century as designed for the IPCC Fourth Assessment. The simulation results imply that the recent climate warming over the TP primarily results from the increasing anthropogenic greenhouse gases emissions [Duan et al., 2006]. However, the simulated surface warming and diminished DTR amplitudes on the central and eastern TP in these two models are no more than 0.16 and �0.13°C/decade, respectively, much weaker than the observations. It is probably due to the poor performance of the existing climate models in representing the clouds and radiation processes and suggests that there should be more factors also contributing to the recent climate warming on the TP. [14] Acknowledgments. The authors would like to thank M. Yanai and an anonymous reviewer whose critical reviews and valuable suggestions are important for the improvement of the manuscript. Special acknowledgement also gives to Huanzhu Liu of China Meteorological Administration for kindly providing the radiation data. This work was supported jointly by the Chinese National Science Foundation under grants 40523001 and 40405016 and the Chinese Ministry of Science and Technology under grant 2006CB403607.
References Angell, J. K. (1990), Variation in United States cloudiness and sunshine duration between 1950 and the drought year of 1988, J. Clim., 3, 296 – 308.
4 of 5
L22704
DUAN AND WU: CLIMATE WARMING ON TIBETAN PLATEAU
Che, H. Z., et al. (2005), Analysis of 40 years of solar radiation data from China, 1961 – 2000, Geophys. Res. Lett., 32, L06803, doi:10.1029/ 2004GL022322. Chen, B., W. C. Chao, and X. Liu (2003), Enhanced climate warming in the Tibetan Plateau due to doubling CO2: A model study, Clim. Dyn., 2, 401 – 413. Duan, A. M., and G. X. Wu (2005), Role of the Tibetan Plateau thermal forcing in the summer climate patterns over subtropical Asia, Clim. Dyn., 24, 793 – 807. Duan, A. M., G. X. Wu, Q. Zhang, and Y. M. Liu (2006), New proofs of the recent climate warming over the Tibetan Plateau as a result of the increasing greenhouse gases emissions, Chin. Sci. Bull., 51, 1396 – 1400. Easterling, D. R., B. Horton, and P. D. Jones (1997), Maximum and minimum temperature trends for the globe, Science, 277, 364 – 367. Henderson-Sellers, A. (1986), Cloud changes in a warmer Europe, Clim. Change, 8, 25 – 52. Intergovernmental Panel on Climate Change (2001), Third Assessment Report, Climate Change 2001: The Scientific Basis, edited by J. T. Houghton et al., Cambridge Univ. Press, New York. Jones, P. A., and A. Henderson-Sellers (1992), Historical records of cloudiness and sunshine in Australia, J. Clim., 5, 260 – 267. Kaiser, D. P. (1998), Analysis of total cloud amount over China, Geophys. Res. Lett., 25, 3599 – 3602. Kaiser, D. P. (2000), Decreasing cloudiness over China: An updated analysis examining additional variables, Geophys. Res. Lett., 27, 2193 – 2196. Kaiser, D. P., and V. N. Razuvaev (1995), Cloud cover and type over the former USSR, 1936 – 1983: Trends derived from the RIHMIWDC 223Station 6- and 3-hourly meteorological database, paper presented at Sixth International Meeting on Statistical Climatology, Am. Meteorol. Soc., Galway, Ireland. Karl, T. R., et al. (1991), Global warming: Evidence for asymmetric diurnal temperature change, Geophys. Res. Lett., 18, 2253 – 2256. Karl, T. R., et al. (1993), A new perspective on recent global warming: Asymmetric trends of daily maximum and minimum temperature, Bull. Am. Meteorol. Soc., 74, 1007.
L22704
Liu, C. S., and B. M. Ye (1991), The effect of cloud distribution on the radiative heating and cooling rates (Chinese with English abstract), Acta Meteorol. Sin., 49, 493. Liu, J. Y., et al. (2005), China’s changing landscape during the 1990s: Large-scale land transformation estimated with satellite data, Geophys. Res. Lett., 32, L02405, doi:10.1029/2004GL021649. Liu, X., and B. Chen (2000), Climatic warming in the Tibetan Plateau during recent decades, Int. J. Climatol., 20, 1729 – 1742. Manabe, S., and A. J. Broccoli (1990), Mountains and arid climate of middle latitudes, Science, 247, 192 – 195. Niu, T., L. X. Chen, and Z. J. Zhou (2004), The characteristics of climate change over the Tibetan Plateau in the last 40 years and the detection of climatic jumps, Adv. Atmos. Sci., 21, 193 – 203. Peixoto, J. P., and A. H. Oort (1992), Physics of Climate, 520 pp., Springer, New York. Peterson, T. C., V. S. Golubev, and P. Y. Groisman (1995), Evaporation losing its strength, Nature, 377, 687 – 688. Ramanathan, V., P. J. Crutzen, J. T. Kiehl, and D. Rosenfeld (2001), Aerosols, climate, and the hydrological cycle, Science, 294, 2119 – 2124. Wu, G. X. (1984), The nonlinear response of the atmosphere to large-scale mechanical and thermal forcing, J. Atmos. Sci., 41, 2456 – 2476. Yanai, M., and G. X. Wu (2006), Effects of the Tibetan Plateau, in The Asian Monsoon, edited by B. Wang, pp. 513 – 549, Springer, New York. Yanai, M., C. Li, and Z. Song (1992), Seasonal heating of the Tibetan Plateau and its effects on the evolution of the Asian summer monsoon, J. Meteorol. Soc. Jpn., 70, 319 – 351. Yeh, T. C., and Y. X. Gao (1979), Meteorology of the Qinghai-Xizang (Tibet) Plateau (in Chinese), 278 pp., Science Press, Beijing. ����������������������
A. Duan and G. Wu, State Key Laboratory of Numerical Modelling for Atmospheric Sciences and Geophysical Fluid Dynamics (LASG), Institute of Atmospheric Physics (IAP), Chinese Academy of Sciences (CAS), Huayanli 40, Tucheng West Road, Beijing 100029, China. (amduan@ mail.iap.ac.cn)
5 of 5