3678 Vol. 10, 3678 –3688, June 1, 2004
Clinical Cancer Research
Featured Article
Changes in Gene Expression Induced by Phosphorothioate Oligodeoxynucleotides (Including G3139) in PC3 Prostate Carcinoma Cells Are Recapitulated at Least in Part by Treatment with Interferon- and -␥ Luba Benimetskaya,1 Timo Wittenberger,4 C. A. Stein,1,2 Hans-Peter Hofmann,4 Claudia Weller,4 Johnathan C. Lai,1,3 Paul Miller,5 and Volker Gekeler4 Departments of 1Medicine, 2Pharmacology, and 3Biomedical Engineering, Columbia University, New York, New York; 4Altana Pharma AG, Konstanz, Germany; and 5Johns Hopkins University, School of Public Health, Baltimore, Maryland
ABSTRACT Purpose: G3139 is an antisense bcl-2 phosphorothioate oligodeoxyribonucleotide that is currently being evaluated in Phase III clinical trials in several human cancers. The aim of the present work was to further identify the apparent non-bcl-2-dependent mechanism of this action of this compound in PC3 prostate cancer cells. Experimental Design: We performed Affymetrix U95A oligonucleotide microarray studies on mRNA isolated from cells treated with G3139 and related oligonucleotides. Results: Hierarchical clustering revealed the presence of a set of genes of which the expression was elevated on both 1 and 3 days after oligonucleotide treatment. Significantly, the persistence of expression of the up-regulation of these genes, many of which are members of the IFN cascade, was greater for G3139 than for any other oligomer evaluated. Furthermore, many of the genes with the greatest up-regulation of expression are also those of which the expression is up-regulated after treatment of cells with IFNs. Treatment of PC3 cells with either IFN- or -␥ recapitulated some of the aspects of the molecular and phenotypic changes observed after treatment with a G3139/Lipofectin complex. These include down-regulation of bcl-2 protein expression itself, down-regulation of protein kinase C ␣ protein expression (but not that of other protein kinase C isoforms), alteration in p21/Waf1/Cip1 protein expression, up-regulation of
Received 11/19/03; revised 2/4/04; accepted 2/27/04. The costs of publication of this article were defrayed in part by the payment of page charges. This article must therefore be hereby marked advertisement in accordance with 18 U.S.C. Section 1734 solely to indicate this fact. Note: L. Benimetskaya, C. Stein, and J. Lai are currently at the Albert Einstein-Montefiore Cancer Center, Department of Oncology, Montefiore Medical Center, 111 East 210 Street, Bronx, NY 10467. Requests for reprints: C. A. Stein, Albert Einstein-Montefiore Cancer Center, Department of Oncology, Montefiore Medical Center, 111 East 210 Street, Bronx, NY 10467. Phone: (718) 920-8980; Fax: (718) 6524027; E-mail:
[email protected].
MHC-I cell surface expression, and profound suppression of cell growth in the absence of a notable increase in cellular apoptosis. However, G3139 (when complexed with Lipofectin) did not induce the up-regulation of expression of either type I or type II IFNs, nor could IFNs be found in conditioned media from treated cells. Conclusions: Oligonucleotide microarray experiments demonstrated that G3139 could induce elements of the IFN cascade in PC3 cells in vitro. In addition, the cellular phenotype obtained after treatment with exogenous IFN could, at least in part, recapitulate that obtained after G3139 treatment. Nevertheless, the oligonucleotide microarray experiments we performed also demonstrated that there are extremely large qualitative and quantitative differences between the two treatments.
INTRODUCTION G3139 is an antisense 18mer phosphorothioate oligodeoxyribonucleotide that is targeted to codons 1– 6 of the Bcl-2 mRNA (1). Phosphorothioate oligonucleotides have found extensive use in antisense experiments (2, 3), and, more recently, as therapeutic candidates (4, 5), having progressed as far in the clinical setting as registration Phase III trials in advanced melanoma, myeloma, and chronic lymphocytic leukemia. Nevertheless, despite the relatively favorable properties of phosphorothioate oligonucleotides, the interpretation of experimental data obtained from the use of these molecules is beset with a number of problems. Many, but probably not all of these problems, stem from their high affinity interactions with heparin binding proteins (6 – 8). These interactions strongly suggest that for virtually any cellular phenotype observed after G3139 treatment, the contribution of nonsequence-specific effects must be considered. For example, in T24 bladder and PC3 prostate carcinoma cells, we demonstrated recently (9) that G3139, in addition to down-regulating Bcl-2 protein and mRNA expression, also down-regulated the expression of protein kinase C (PKC)-␣ protein and mRNA expression but not that of other PKC isoforms. Subsequently (10), it was demonstrated in PC3 cells that the ability of G3139 to down-regulate bcl-2 expression, to inhibit cell growth in tissue culture, and to cause persistence of reactive oxygen species production in treated cells, could also be recapitulated by sequence variants of G3139, provided that the “bis CpG motif” was preserved. Taken together, it is clear that in addition to the Watson-Crick-based, RNase H-dependent, antisense mechanism of down-regulation of Bcl-2 expression, additional mechanisms exist that contributes greatly to the observed phenotype. In this work, we demonstrate, by microarray technology
Downloaded from clincancerres.aacrjournals.org on June 1, 2017. © 2004 American Association for Cancer Research.
Clinical Cancer Research 3679
Table 1 Oligomer
Length
G3139 G4126 2009 C20 G4232
18 18 20 20 18
Sequences of phosphorothioate oligonucleotides
Sequence 5⬘-3⬘ TCTCCCAGCGTGCGCCAT TCTCCCAGCATGTGCCAT AATCCTCCCCCAGTTCACCC CCCCCCCCCCCCCCCCCCCC TCTCCCAGCGTGCGCCAT
experiments, that G3139 (and in fact all of the phosphorothioate oligonucleotides we evaluated, but to a variably lesser extent) are capable of inducing the up-regulation of the expression of mRNA species usually associated with the treatment of cells by IFNs. Furthermore, we also demonstrate that inhibition of cell proliferation, and at least some of the changes in gene expression observed after G3139 treatment of prostate carcinoma cells, are recapitulated by treatment of the cells with IFN- and -␥. Thus, under the conditions of our experiments, it may not be necessary to evoke an antisense mechanism to entirely account for the observed phenotype in PC3 cells after G3139 treatment.
MATERIALS AND METHODS Cells. Mycoplasma-free PC3 cells were obtained from the American Type Culture Collection (Rockville, MD) and were grown in RPMI (Invitrogen, Grand Island, NY), containing 10% (v/v) heat-inactivated (56°C) fetal bovine serum supplemented as described previously (10). Stock cultures were main-
Comments Two CpG motifs, targeted to Bcl-2 initiation codon G3139 variant with single base mismatch at each CpG motif No CpG motifs, targeted to Bcl-2 coding region G3139 variant with cytosine C5-methyl at each CpG motif
tained at 37°C in a humidified 5% CO2 incubator. PC3 cells were not used after the passages 10 –12. Oligonucleotide Microarray. mRNA was isolated by standard procedures after treatment of PC3 prostate cancer cells with the appropriate oligonucleotides or IFNs (3 days of continuous treatment; IFN-: 210 pM; IFN-␥; 700 pM). The corresponding cDNA was synthesized (Superscript Choice DoubleStranded cDNA Synthesis kit; Life Technologies, Inc.). Biotinlabeled cRNA was synthesized from the cDNA by using T7 RNA polymerase and the BioArray High Yield RNA Transcript Labeling kit (Enzo). This cRNA was fragmented at 94°C (pH 8.1), in the presence of Mg2⫹. Hybridization to an Affymetrix U95A Gene Chip was performed for 16 h at 45°C. The hybridized biotinylated-cRNA on the chip was stained with 10 g/ml streptavidin-phycoerythrin, restained by a biotinylated antistreptavidin monoclonal antibody (mAb; 3 g/ml), and then again with streptavidin-phycoerythrin. After completion of staining, the chip was scanned by the laser scanning Hewlett
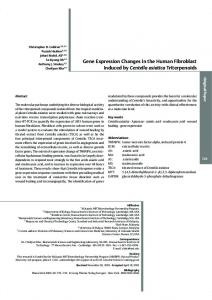
Fig. 1 Representative Northern blot (A) and reverse transcription-PCR (RT-PCR; B) analysis demonstrating G3139-induced down-regulation of Bcl-2 mRNA expression. PC3 cells were treated with complexes of either G3139 or G4126 (400 nM) and Lipofectin (15 g/ml; 5 h; Opti-MEM), and then for an additional 67 h in complete medium without complexes, and total mRNA was isolated after 1 and 3 days. Northern blot analysis (A) was performed as described in “Materials and Methods.” Thirty g of mRNA was loaded in each lane of the 1% denaturing agarose gel, transferred to Hybond-N nylon membranes, and probed with either Bcl-2 or control G3PDH cDNA probes. RT-PCR (B) was performed as described in the text. The reaction products were separated on 1% agarose gels and stained with ethidium bromide. The Bcl-2 amplicon was 459-bp long, and -actin amplicon was 246-bp long. DNA size markers are shown in the left lanes. Control (Cⴱ): RT-PCR reaction in the absence of forward primer.
Downloaded from clincancerres.aacrjournals.org on June 1, 2017. © 2004 American Association for Cancer Research.
3680 G3139 Induces the Interferon Cascade in PC3 Cells
Packard G2500A Gene Array Scanner (excitation wavelength ⫽ 488 nm). Data Analysis Conditions. Algorithms embedded in the Gene Data Expressionist (Basel, CH) software that take all of the signals from the perfect match probe sets and calculate the expression values were used for condensing data. Global normalization was applied (scaling all values of mRNA expression) so that the log mean of the average signal was arbitrarily set to 103. Each 3-day experiment was performed in triplicate; each 1-day experiment was performed once. A Student’s t test was performed comparing each triplicate set to every other triplicate set. A threshold of significant differential expression (P ⬍ 10⫺4) was applied. In an additional comparison, a Student’s t test performed comparing each triplicate to the sum of all of the others. In this test a significance threshold P ⬍ 10⫺5 was applied. In addition, a Kruskal-Wallis test (detects genes differentially expressed in one group compared with one or more of the other groups) was applied for all of the triplicate groups (significance threshold P ⬍ 0.01 was applied). We identified 590 probe sets by these methods. For the 1-day analysis, control (untreated) cells were compared with treatment of cells with G3139 (10 M) without Lipofectin. Their expression profiles were very similar and were used to generate a t test for comparison to the rest of the groups. These two were also compared against G4126, G3139, 2009, G4232, and C20, all transfected with Lipofectin. In total, 41 genes were obtained (P ⬍ 10⫺4). These genes are the ones that are affected in common either by transfection or by the oligonucleotides. For the 1-day versus 3-day analysis, a Student’s t test was performed (P ⬍ 10⫺5), and 1303 probe sets were obtained, of which 39 had a ⬎2-fold (arbitrarily chosen) change between the group means. (A principal component analysis selected an additional 68 genes with a strong association that did not fulfill one of the two criteria). To cluster all of the probe sets, 132 were subtracted from the original 590 as being specific for C20 at 3 days (either up or down-regulated). A total of 458 probe sets remained. We added 41 probe sets from the day 1 analysis and 107 from the day 1 versus day 3 analysis to the total. The total number of probe sets, therefore, after subtraction of all of the overlap, was 558. A self-organizing map clustering was then performed. We could assign 520 probe sets to one of the following four clusters: (a) expression higher after 1 day than 3 days: 51 probe sets; (b) expression higher after 3 days than 1 day: 58 probe sets; (c) expression higher in oligonucleotide-transfected cells at 3 days versus controls at 3 days (C20, which is included in the analysis, does not cause higher expression and is similar to control): 356 probe sets; (d) same as 3, but higher expression at 1 day versus 3 days: 49 probe sets. Because the genes obtained from clusters 1 and 2 were altered to approximately the same extent for all of the oligonucleotides, they were felt to be related either to the transfection process, the oligonucleotide backbone, or both, and will not be discussed further. Reagents. The anti-bcl-2 mAb was from Dako (Carpinteria, CA). The anti-PKC mAb was from Transduction Laboratories (Lexington, KY) and the anti-PKC-1, ⑀, and polyclonal antibodies were from Invitrogen (Carlsbad, CA). The anti-␣-
tubulin mAb was from Sigma-Aldrich (St. Louis, MO). The anti-p21 mAb was from Santa Cruz Biotechnology (Santa Cruz, CA). FITC-conjugated mouse anti-human mAbs MHC class I (HLA-ABC) and class II (HLA-DR) were from BD PharMingen (San Diego, CA). Lipofectin was from Invitrogen. Human IFN-␥ (specific activity ⫽ 4.24 ⫻ 106 units/mg) was from PBL Biomedical Laboratories (Piscataway, NJ). Human IFN--1a (200 million units/mg) was from Biogen, Inc. (Cambridge, MA) and was generously donated by Paul Fisher. Phosphorothioate oligonucleotides were synthesized and purified via standard procedures and kindly supplied by Genta (Berkeley Heights, NJ). A list of the oligomers used in these experiments is presented in Table 1. Oligonucleotide Transfections. Cells were seeded the day before the experiment in six-well plates at a density of 25 ⫻ 104 cells per well, to be 60 –70% confluent on the day of the experiment. All of the transfections were performed in OptiMEM (Invitrogen). The incubation time for oligonucleotide/ Lipofectin complexes was 5 h. The total incubation time before cell lysis and protein isolation was 72 h at 37°C. Western Blot Analysis. Cells treated with oligonucleotide-lipid complexes were extracted in lysis buffer (10) at 4°C for 1 h. Aliquots of cell extracts, containing 25–50 g of protein, were resolved by SDS-PAGE, and then transferred to Hybond ECL filter paper (Amersham, Arlington Heights, IL). After
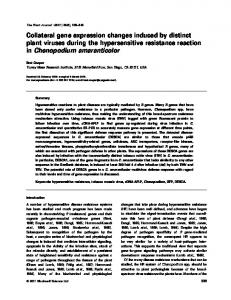
Fig. 2 Depiction of expression of genes in cluster 3 (see “Materials and Methods”) as derived from the cDNA microarray analysis of PC3 cells treated with complexes of oligonucleotides (400 nM) and Lipofectin (15 g/ml) for 5 h in Opti-MEM, and then in complete medium without complexes. Cellular RNA was isolated either 1 or 3 days after treatment. Experiments were performed in triplicate for RNA isolated after 3 days and once for RNA isolated after 1 day. Control, cells not treated with oligonucleotide; LF, Lipofectin. Values of mRNA expression (Y axis) were normalized to 103. Individual values of gene expression exist as invisible points on each vertical line and are connected by horizontal lines. Each horizontal line thus represents the expression pattern of a single gene as a function of time after either oligonucleotide treatment or in untreated cells.
Downloaded from clincancerres.aacrjournals.org on June 1, 2017. © 2004 American Association for Cancer Research.
Clinical Cancer Research 3681
Table 2
Genes whose expression is upregulated in the oligonucleotide microarray analysisa A. Upregulation by phosphorothioate oligonucleotides and IFN- or -␥
Gene name
Gene symbol
37014_at
MX1
425_at 1358_s_at 287_at 675_at 39061_at 37641_at 38389_at 1107_s_at 1456_s_at 36412_s_at 39263_at 38432_at AFFXHUMISGF3A/ M97935_3_at 464_s_at 36100_at 2031_s_at 38584_at
IFI27
Oligo fold ⌬
IFN fold ⌬
6.2
32.8
5.9 5.5 5 3.6 3.5 3.4 3.3 3 3 2.9 2.7 2.7 2.6
13.4 18.4 2.8 25.3 51.6 12 19.3 10.9 7.4 6 16.3 7.9 5.9
2.4 2.3 2.3 2.1
12.1 5.2 2.1 21.4
Oligo fold ⌬
IFN fold ⌬
4.4 3.8 3.4 2.4 2.3 2.3 2.1 2.1 1.8 1.8 1.7 1.3
24.8 2.3 8.0 48.4 15.8 2.5 9.2 3.0 20.4 2.3 3.2 1.6
Oligo fold ⌬
IFN fold ⌬
3.8 3.6 3.6 3.3 3.1
2.2 1.6 2.0 1.7 1.2
3.0
2.1
3.0 2.9 2.8 2.7 2.7 2.6 2.5 2.5
1.7 2.0 1.6 1.7 1.3 2.0 1.8 1.5
Gene description
Oligo fold ⌬
IFN fold ⌬
v-maf musculoaponeurotic fibrosarcoma oncogene homolog F (avian) Cluster Incl. X72790; human endogenous retrovirus mRNA for ORF Ephrin-B2 Secretory granule, neuroendocrine protein 1 (7B2 protein) Zinc finger protein 259
2.5 2.1 1.9 1.7 1.6
2.7 2.1 2.3 4.2 1.7
Gene description
OAS2 ISG15 STAT1
Myxovirus (influenza virus) resistance 1, IFN-inducible protein p78 (mouse) IFN, ␣-inducible protein 27 IFN, ␣-inducible protein (clone IFI-6–16) Activating transcription factor 3 IFN induced transmembrane protein 1 (9–27) Bone marrow stromal cell antigen 2 IFN-induced protein 44 2⬘,5⬘-oligoadenylate synthetase 1 (40–46 kD) IFN-stimulated protein, 15 kDa IFN, ␥-inducible protein 16 IFN regulatory factor 7 2⬘-5⬘-oligoadenylate synthetase 2 (69–71 kD) IFN-stimulated protein, 15 kDa Signal transducer and activator of transcription 1, 91 kD
IFI35 VEGF CDKN1A IFIT4
IFN-induced protein 35 Vascular endothelial growth factor Cyclin-dependent kinase inhibitor 1A (p21, Cip1) IFN-induced protein with tetratricopeptide repeats 4
ATF3 IFITM1 BST2 OAS1 ISG15 IFI16
B. Upregulation by phosphorothioate oligonucleotides and IFN- Gene name 32814_at 35488_at 35372_r_at 38549_at 879_at 1005_at 39264_at 33253_at 34491_at 32069_at 34012_at 40199_at
Gene symbol IFIT1 SNAPC1 IL8
Gene description IFN-induced protein with tetratricopeptide repeats 1 Small nuclear RNA activating complex polypeptide 1, 43 kD Interleukin 8 Vipirin Myxovirus (influenza virus) resistance 2 (mouse) Dual specificity phosphatase 1 2⬘-5⬘-oligoadenylate synthetase 2 (69–71 kD) Tripartite motif-containing 14 2⬘-5⬘-oligoadenylate synthetase-like Nedd4 binding protein 1 Keratin, hair, acidic, 4 msh homeo box homolog 1 (Drosophila)
MX2 DUSP1 OAS2 TRIM14 OASL KIAA0615 KRTHA4 MSX1
C. Upregulation predominantly by phosphorothioate oligonucleotides alone Gene name 34777_at 41848_f_at 1911_s_at 39822_s_at 38105_at
Gene symbol ADM IL24 GADD45A GADD45B FLJ11021
34279_at 35127_at 36209_at 38374_at 32317_s_at 32729_at 37679_at 41665_at 39897_at
H2AFA
MYH3 IFRD1 PCF11 DDX16
Gene description Adrenomedullin Interleukin 24 Growth arrest and DNA-damage-inducible, ␣ Growth arrest and DNA-damage-inducible,  Hypothetical protein FLJ11021 similar to splicing factor, arginine/ serine-rich 4 Homo sapiens mRNA; cDNA DKFZp586O031 (from clone DKFZp586O031) [BLAST] H2A histone family, member A Bromodomain containing 2 Transforming growth factor- inducible early growth response Sulfotransferase family, cytosolic, 1A, Phenol-preferring, member 2 Myosin, heavy polypeptide 3, skeletal muscle, embryonic IFN-related developmental regulator 1 PCF11p homolog KIAA1966 protein D. Upregulation by phosphorothioate oligonucleotides and IFN-␥
Gene name 32835_at 38935_at 34335_at 34265_at 32518_at
Gene symbol MAFF EFNB2 SGNE1 ZNF259
Downloaded from clincancerres.aacrjournals.org on June 1, 2017. © 2004 American Association for Cancer Research.
3682 G3139 Induces the Interferon Cascade in PC3 Cells
Table 2 Gene name 1052_s_at 39074_at 38670_at 37932_at 40004_at 38020_at
Gene symbol CEBPD PP591 TRIP11 SIX1 KIAA0652
Continued
Gene description CCAAT/enhancer binding protein (C/EBP), ␦ Hypothetical protein PP591 Zinc finger protein 313 Thyroid hormone receptor interactor 11 Sine oculis homeobox homolog 1 (Drosophila) KIAA0652 gene product
Oligo fold ⌬
IFN fold ⌬
1.4 1.4 1.4 1.3 1.2 1.2
2.5 1.6 1.5 1.3 1.6 1.5
a Fold ⌬, fold upregulation of mRNA expression (arithmetic mean, n ⫽ 3, individual data points are within 10% of the mean) in G3139-treated PC3 cells (versus untreated control cells), 67 h after a 5-h incubation of complexes of 400 nM G3139/Lipofectin, as described in the text. Note that the same genes of which the expression is upregulated by G3139 are also upregulated by each oligonucleotide, shown in Fig. 2. However, the day 3 scores obtained after treatment of PC3 cells with these other oligonucleotides were generally diminished versus G3139 (see Fig. 2).
treatment with appropriate primary and secondary antibody, enhanced chemiluminescence was performed. Determination of the Rate of Cell Proliferation. Briefly, 15–20 ⫻ 104 cells were seeded in six-well plates and allowed to attach overnight. Cells were then treated with the appropriate concentrations of oligonucleotide complexed to Lipofectin (15 g/ml) for 5 h 37°C. After 3–7 days of incubation, cells were trypsinized and harvested, and their viability was determined by trypan blue exclusion. Experiments were performed in triplicate, and data are presented as the average ⫾ SD. In no experiment did ⬎10 –15% of cells stain with trypan blue. Annexin V Cell Surface Binding. Cells treated for 72 h with oligonucleotides were harvested after trypsinization, and apoptotic cells were assayed by flow cytometry using the Annexin V-FITC apoptosis detection kit (Becton Dickinson, San Jose, CA). Early apoptotic cells bound to Annexin V-FITC but excluded propidium iodide. Cells in late apoptotic stages were labeled with both Annexin V-FITC and propidium iodide. Isolation of RNA, Reverse Transcription-PCR (RTPCR), and TaqMan PCR Analysis. Total RNA was isolated from PC3 cells using the RNeasy kit (Qiagen, Valencia, CA). RNA was reverse-transcribed with Platinum Taq (Invitrogen).
All of the RT-PCR reactions (50 l final volume) were performed as follows: 50°C for 35 min, 94°C for 2 min, 37 cycles consisting of 60°C for 30 s, 72°C for 1 min, 94°C for 30 s, and finally 72°C for 10 min. The forward and reverse primers for amplification of bcl-2 were 5⬘-GGTGCCACCTGTGGTCCACCTG-3⬘ and 5⬘-CTTCACTTGTGGCCCAGATAGG-3⬘, respectively (11). The primers (5⬘-GAGCTGCGTGTGGCTCCCGAGG-3⬘, forward; 5⬘-CGCAGGATGGCATGGGGGAGGGCATACCCC-3⬘, reverse; Ref. 11) designed to amplify a 246-bp fragment of -actin were used to normalize for RNA concentration. For TaqMan PCR analysis, total RNA was reverse transcribed for 1 h at 37°C using random hexanucleotide primers and RAV-2 reverse transcriptase (Amersham Biosciences, Chalfont St. Giles, United Kingdom). Amplification was performed on an ABI Prism 7900HT sequence detection system (Applied Biosystems, Weiterstadt, Germany) using AmpliTaq Gold DNA polymerase. Primers were obtained from Applied Biosystems (Assays-on-Demand program). For normalization of RNA concentrations, TaqMan PCR analysis of the 18S rRNA was used. Northern Blot Analysis. Total cellular RNA was isolated using TRIzol Reagent (Life Technologies, Inc.). Twenty-
Fig. 3 Venn diagram demonstrating changes in gene expression caused either by phosphorothioate oligonucleotides ⫾ IFN- ⫾ IFN-␥ or by each individually. Each of the two large circles represents the number of genes of which the expression is changed (the vast majority are induced) by either IFN- or -␥. The ellipsoid represents the genes of which the expression is changed (the vast majority are induced) by phosphorothioate oligonucleotides.
Downloaded from clincancerres.aacrjournals.org on June 1, 2017. © 2004 American Association for Cancer Research.
Clinical Cancer Research 3683
five to 30 g was resolved on 1.2% agarose gel containing 1.1% formaldehyde and transferred to Hybond-N nylon membranes (Amersham). The membranes were probed for bcl-2, washed, and exposed to X-ray film as described previously (10). Flow Cytometric Analysis of Cell Surface MHC-I and -II Expression. PC3 cells were transfected with either G3139 or G4126 for 5 h in Opti-MEM as described above, or treated continuously with IFN-␥ (700 pM) for 2, 3, or 4 days. Then, the cells were incubated with FITC-conjugated anti-MHC class I or class II antibody at 4°C for 30 min and analyzed by flow cytometry.
RESULTS Down-Regulation of bcl-2 mRNA Expression in Oligonucleotide-Treated PC3 Cells. As has been demonstrated previously (10), G3139 and related oligonucleotides down-regulate the expression of bcl-2 protein in PC3 prostate cancer cells. As demonstrated by Northern and RT-PCR analysis (Fig. 1), the expression of bcl-2 mRNA is also down-regulated. However, bcl-2 protein is predominately membrane-bound. Thus, whereas bcl-2 mRNA is maximally down-regulated 24 h after a 5-h transfection with G3139 (but far less so with control, 2-base mismatch G4126), it took 72 h for bcl-2 protein to achieve maximal down-regulation (10). Furthermore, recovery of mRNA expression to control levels occurred by 3 days. Oligonucleotide Microarray Analysis of Oligonucleotide-Treated PC3 Cells. The expression levels of mRNAs defined by Cluster 3 is shown in Fig. 2. Twenty-four h after treatment, the scaled expression values of these genes in control, untreated cells, and in cells exposed to 10 M G3139 in the absence of the Lipofection transfection reagent, are approximately identical. Some of the genes that are found in Cluster 3 are presented in Table 2, where the scores represent fold up-regulation of mRNA expression in oligonucleotide/Lipofectin-treated PC3 cells after 3 days. As can be seen in Fig. 2, the expression of virtually all of these mRNAs was also up-regulated on day 1 by all of the oligomers tested. By day 3, however, up-regulation of mRNA expression in this cluster persisted most strongly for G3139 (Fig. 2), but less so in the order 2009 ⬎ 4126 ⬎⬎ C20. (It should be noted that 2009 and C20 are both two bases longer than G3139). These data demonstrate that effects observed at 3 days with G3139 and the other oligonucleotides are not purely the result of transfection, of Lipofectin, or of the oligonucleotide backbone, but rather, alterations in the intensity of gene expression induced by these molecules. Strikingly, as demonstrated in Table 2 (arbitrarily truncated at a score of a 2.3-fold increase in mRNA expression), up-regulation of expression of many of the same genes can also be observed when cells are treated with IFNs, or are exposed to lipopolysaccharide or double-stranded (ds) RNA (12, 13). Note also that what distinguishes G3139-treated cells from those treated with other oligonucleotides is not the identity of the up-regulated genes but rather the persistence of upregulation of gene expression in cluster 3. Induction of Expression of IFN-Related Genes in Oligonucleotide- and IFN-Treated PC3 Cells. IFN-related mRNAs found to be up-regulated in Cluster 3 of microarray assay
Fig. 4 Representative Western blot analysis demonstrating concentration-dependent down-regulation of Bcl-2 protein expression in PC3 cells by IFN- (A) and -␥ (B). Cells were treated with IFN- or -␥ at the indicated concentrations continuously for 3 days and then harvested. Protein samples (30 – 40 g protein/lane) were analyzed by Western blotting as described in “Materials and Methods,” with tubulin used as a control protein species. Percentage of inhibition versus control, untreated cells was determined as a function of IFN concentration by laser-scanning densitometry.
include: MxA (human Mx1), as well as MxB, IFI27, IFI35, 9 –27 (IFITM-1), 6 –16 (IFI16), 2⬘-5⬘ oligoadenylate synthetase (OAS) 1, OAS 2, IFI41, the transcription factor ISGF3 (also known as IRF-9) and its subunit STAT1 (which is required by type I IFNs; Ref. 14), and the cyclin-dependent kinase inhibitor p21/Waf1/Cip1. However, we found no evidence either at 1 or
Downloaded from clincancerres.aacrjournals.org on June 1, 2017. © 2004 American Association for Cancer Research.
3684 G3139 Induces the Interferon Cascade in PC3 Cells
Fig. 5 Representative reverse transcription-PCR (RT-PCR) analysis demonstrating that IFN-␥ down-regulates Bcl-2 mRNA expression after 1 day but that expression recovers after 3 days. Cells were treated with IFN-␥ continuously for 1 day or 3 days, and total mRNA was isolated. RT-PCR was performed as described in “Materials and Methods.” The reaction products were separated on 1% agarose gels and stained with ethidium bromide. The Bcl-2 amplicon was 459-bp long and the -actin amplicon was 246-bp long. The right lanes correspond to DNA size markers. Control (Cⴱ), RT-PCR reaction in the absence of forward primer.
3 days for the up-regulation of either IFN- or -␥ mRNA expression. Confirmation of the oligonucleotide microarray data were provided by TaqMan real-time RT-PCR. In G3139-treated cells, MxA, ISG15, OAS1, and OAS2 mRNAs are all up-regulated approximately 4 – 6-fold. As expected, the expression of these mRNAs was also highly up-regulated (30 – 60-fold) by treatment of cells with either IFN- or -␥ (data not shown).6 The relationship between the expression of genes changed by phosphorothioate oligonucleotides (400 nM; 5-h treatment; RNA isolated 67 h later) as compared with that changed by IFN- and -␥ (72 h of continuous treatment before RNA isolation) is shown in the Venn diagram in Fig. 3. There is a significant overlap (338 genes) in the gene expression changes induced by IFN- and -␥. A change in expression of 138 of these 338 genes is also induced by phosphorothioate oligonucleotides (virtually all are up-regulated). Some of these genes are listed individually in Table 2A. For virtually all of them, it should be noted that induction by IFN- tends to peak after 1 day, whereas induction by IFN-␥ is maximal only after 3 days of continuous treatment. Furthermore, whereas the induction of gene expression can be qualitatively similar for phosphorothioates and IFNs (although it should also be noted that 199 genes induced by IFNs- and -␥ are not induced by phosphorothioates), treatment of cells with IFNs (Table 2A) produces far more dramatic effects on induction of mRNA expression. A similar situation exists with a set of 14 genes of which the expression is up-regulated by IFN- and by phosphorothioates, but not by IFN-␥. Most of these genes are only minimally induced (4.4-fold maximum induction) by phosphorothiotes (Table 2B), but some, such as IFIT1,
6
These data are available on request at
[email protected].
vipirin, and OASL are induced, respectively, 24.8, 48.4, and 20.4-fold by IFN-. The expression of an additional 14 genes is changed (all are up-regulated) by phosphorothioate oligonucleotides but not by IFNs (Table 2C); these changes for the most part appear relatively minimal. For 2 genes, adrenomedullin and IL24, no increase in protein expression could be observed by Western blotting (data not shown). Finally, the expression of 11 genes minimally induced by phosphorothioates is also induced by IFN-␥ but not by IFN- (Table 2D). Treatment of PC3 Cells with IFN- or -␥ Mimics Aspects of the Phenotype Observed After G3139 Treatment. As demonstrated in Fig. 4, A and B, respectively, IFN- and -␥ treatment of PC3 cells, similar to G3139 treatment, also produced a dramatic down-regulation (maximal 95% for IFN- at 250 pM) of bcl-2 protein expression (after 3 days). This was also observed in cells treated with IFN-␥, with inhibition (⬃80%) found at 700 pM. Bcl-2 mRNA expression, as assessed by RT-PCR, was down-regulated 24 h after treatment, by both IFN- (data not shown) and -␥ (Fig. 5). However, by 3 days after IFN treatment, again as determined by RT-PCR, bcl-2 mRNA levels recover to approximately those found in untreated cells. This is unlike what was observed in G3139-treated cells, in which bcl-2 mRNA levels remain suppressed for as long as 5– 6 days. Treatment of PC3 cells with both IFN- and -␥ also produced significant down-regulation of PKC-␣ protein expression (⬃75%; Fig. 6, B and C, respectively) at the same concentrations that produced maximal bcl-2 protein down-regulation. Again, as with G3139, which also causes down-regulation of PKC-␣ protein expression (Fig. 6A), there was no down-regulation of expression of other PKC isoforms, including PKC-1, -⑀, and - (Fig. 5C)
Downloaded from clincancerres.aacrjournals.org on June 1, 2017. © 2004 American Association for Cancer Research.
Clinical Cancer Research 3685
Fig. 6 Representative Western blot analysis demonstrating that oligonucleotide G3139 (A), IFN- (B), and IFN-␥ (C) down-regulate Bcl-2 and protein kinase C (PKC)-␣ protein expression. In contrast, essentially no change in the levels of expression of the PKC-1, ⑀, and isoforms were observed. Cells were treated either with complexes of G3139 or G4126 (400 nM) and Lipofectin (15 g/ml) for 5 h in Opti-MEM and then for an additional 67 h in complete medium without complexes or continuously for 3 days with IFN- or -␥ (concentrations indicated in the figure), and harvested. Protein samples (30 – 40 g of protein/lane) were analyzed by Western blotting as described in “Materials and Methods,” with tubulin used as a control protein species. Percentage of inhibition was determined as a function of G3139 (versus control G4126) or IFN concentration (versus control, untreated cells) by laser-scanning densitometry.
By 1 day after oligonucleotide transfection, levels of p21/ Waf1/Cip1 protein expression appear to be approximately equal to those observed in the control, untreated cells. However, 2 days later, levels of p21 protein expression in untreated cells declined to almost undetectable levels. In contrast, in G3139treated cells (Fig. 7), the level of p21 protein expression is some 28-fold higher versus untreated cells and 14-fold higher than in G4126 treated cells. A similar pattern of expression of p21 is also seen 3 days after treatment of PC3 cells with IFN- (250 pM) and IFN-␥ (700 pM). IFN-␥ also dramatically up-regulated the cell-surface expression of MHC-I but not MHC-II (data not shown) on PC3 cells, as detected flow cytometrically after fluorescent mAb
staining (Fig. 8). Similarly, G3139, but not G4126, up-regulated MHC-I (⬃60% increase in mean channel number) but not MHC-II expression versus control, untreated cells, albeit to a much smaller extent than did IFN-␥. Nevertheless, this increase was highly statistically significant, as determined by a Student’s two-sided t test (Fig. 8). The expression of MHC-I mRNA was not up-regulated in the oligonucleotide microarray assay. Similar to what we observed after G3139 treatment of PC3 cells, continuous treatment of PC3 cells with IFN- and -␥ caused almost complete cessation of cell growth. However, this was associated with minimal loss in cellular viability as judged by trypan blue exclusion for at least 5 days, again similar to what was observed with G3139 treatment (Fig. 9). However
Downloaded from clincancerres.aacrjournals.org on June 1, 2017. © 2004 American Association for Cancer Research.
3686 G3139 Induces the Interferon Cascade in PC3 Cells
production was observed by treatment of PC3 cells for 3 days with either G3139 or G4126. In fact, we observed a small decrease (to 1.5 ⫾ 0.1 ⫻ 10⫺2 pmol/mg protein) in the concentration of IFN-, but not -␥. IFN-␣ could be detected in the lysates of untreated cells (⬃1.0 ⫾ 0.2 ⫻ 10⫺3 pmol/mg protein), but its concentration decreased to ⬃4.0 ⫾ 0.2 ⫻ 10⫺4 pmol/mg protein after treatment with either G4126 or G3139.
DISCUSSION
Fig. 7 Representative Western blot analysis demonstrating that G3139 (A), IFN- (B), and IFN-␥ (C) block the time-dependent decrease of p21 protein expression in PC3 cells. Cells were treated either with complexes of either G3139 or G4126 (400 nM) and Lipofectin (15 g/ml; 5 h; Opti-MEM) and then for an additional 67 h in complete medium without complexes. Cells were also treated with IFN- or -␥ continuously (concentrations indicated in the figure), and harvested after 3 days. Protein samples (30 –50 g protein/lane) were subjected to Western blotting as described in “Materials and Methods,” with tubulin used as a control protein species. Percentage of inhibition (for G3139 versus control G4126; for IFNs versus control, untreated cells) was determined as a function of IFN concentration by laser-scanning densitometry.
(10), cessation of cellular proliferation was not associated with a significant increase in apoptosis, as measured by Annexin V binding. In control, untreated cells, 4.9% of the population was in early apoptosis, with 4.2% in late apoptosis/early necrosis. This increased to 5.9% and 5.8%, respectively, after G4126 treatment and 10.4% and 10.6% with G3139 treatment. After 3 days of continuous treatment with IFN- (1250 pM) or -␥ (700 pM), no more than 0.3% of cells were in early apoptosis, and no more than 8.9% could be found in late apoptosis/early necrosis. After treatment of PC3 cells with G3139, relatively high levels of reactive oxygen species are produced relative to the low rate of cellular proliferation (10). Nevertheless, unlike after treatment with G3139, IFN- or -␥- treatment of PC3 cells did not promote the production of high levels of reactive oxygen species relative to the cellular proliferation rate (data not shown). G3139 Does Not Induce Production of IFNs by PC3 Cells. We then determined, via ELISA assay, whether G3139 was inducing PC3 cells to secrete either type I or II IFNs. The lower limit of detection of the ELISA assays is 12.5 pM for IFN- and 0.6 pM for IFN-␥. However, we could not detect any IFN in the culture media at concentrations above these lower limits (data not shown). On the other hand, both IFN- and -␥ could easily be detected by ELISA in both treated and untreated PC3 cell lysates (⬃2.0 ⫾ 0.3 ⫻ 10⫺2 and 6 ⫾ 2 ⫻ 10⫺4 pmol/mg protein for IFN- and -␥, respectively). However, no statistically significant induction of endogenous IFN protein
We have demonstrated, by oligonucleotide microarray and TaqMan real-time RT-PCR, that the expression of certain cellular genes usually associated with exposure of immunocompetent cells to dsRNA, IFN, and viruses, are also up-regulated by transfection of phosphorothioate oligonucleotides in PC3 prostate carcinoma cells. Furthermore, this up-regulation strongly persists for as long as 3 days after a five-hour treatment with G3139. The up-regulation of the same genes (cluster 3) can also be observed, but at lower amplitude, with all of the other oligonucleotides used in this study. However, it is critical to note that the data presented herein should not be extrapolated to other cell systems, nor should it be uncritically assumed that these mechanisms as described are necessarily clinically relevant. The molecular basis for the relatively long-term up-regulation of the IFN cascade induced by G3139 is unclear. However, it is possible that up-regulation of IFN-related growth suppressive genes leads to the long-term suppression of cell
Fig. 8 Time dependence of the effects of G3139, G4126, and IFN-␥ on MHC class I expression on the surface of PC3 cells. Cells were treated either with complexes of G3139 or G4126 (400 nM) and Lipofectin (15 g/ml) for 5 h in Opti-MEM and then for an additional 67 h in complete medium without complexes or continuously with IFN-␥ for 2– 4 days. MHC class I cell-surface expression was analyzed by flow cytometric analysis after FITC-labeled anti-MHC-I monoclonal antibody staining as described in “Materials and Methods” (excitation wavelength, 488 nm; 104 cells/sample were analyzed at a rate of 100 –200 cells/s). Experiments were performed in triplicate and data are presented as the average mean; bars, ⫾SD. A Student two-sample t test assuming unequal variances was used to determine the equality of the means of two samples. P ⫽ 0.05. ⴱ, statistically significant difference (P ⬍ 0.05) between G4126 and G3139 treated cells. Control, cells not treated with either IFN-␥ or oligonucleotides.
Downloaded from clincancerres.aacrjournals.org on June 1, 2017. © 2004 American Association for Cancer Research.
Clinical Cancer Research 3687
Fig. 9 The rate of proliferation of PC3 prostate cancer cells is significantly reduced by treatment with G3139 (A) or IFN- (B) as assessed by the trypan blue exclusion method. IFN-␥ (C) slightly affected the proliferation rate (only after 5 days continuous treatment). Cells 15– 20 ⫻ 104 were seeded in six-well plates, and treated either with complexes of G3139 or G4126 (400 nM) and Lipofectin (15 g/ml) for 5 h in Opti-MEM, and then for an additional 67 h in complete medium without complexes, or with IFN- or -␥ continuously for 3 days (concentrations indicated in the figure). Cells were counted daily. Data are presented as the average; bars, ⫾SD; n ⫽ 3.
growth in complete media and loss of ability to clone in soft agar (10). This strongly growth suppressed phenotype might, in turn, be associated with the presence of the “bis-CpG” motif found in G3139 (10), which is not present in any of the other oligomers evaluated in that study. In murine bone marrow-derived macrophages, the TLR3 receptor regulates the response to naked dsRNA (12, 15), which ultimately leads to activation of nuclear factor B. However, increased nuclear localization of nuclear factor B was not observed in electrophoretic gel mobility shift assays 3 days after treatment of PC3 cell with G3139 (data not shown). The TLR4 receptor, on the other hand, mediates the response to lipopolysaccharide (12, 16) and like copolymer of polyinosinic and polycytidylic acids, also leads to nuclear factor B activation, making it unlikely that either of these two receptors is involved in the changes in gene expression caused by oligonucleotide treatment. In addition, the lack of any effect of naked G3139, even at a 10 M concentration, indicates that cellular uptake of the oligonucleotide is required. Furthermore, the effects described in this work are independent of TLR9, the CpG receptor (17, 18), as the expression of its mRNA was not detected in PC3 cells in either an oligonucleotide microarray assay or by TaqMan RT-PCR. Rather, it seems likely that significant extraendosomal oligonucleotide internalization, and possibly nuclear localization, must occur. Human prostate cancer cells are highly sensitive to the antiproliferative effects of IFNs (19). Some of the IFN-related mRNA species up-regulated by phosphorothioate oligodeoxynucleotides in general, but especially by G3139, appear to be highly growth suppressive. For example, IFIT1 mRNA, the transcription product of the 561 gene that is responsible for the translation of p56, was identified by the microarray. Its expression may be strongly induced by dsRNA (as short as 85 bp; Ref. 20) or IFN- (13). P56 appears to be growth suppressive (14), acting by inhibiting protein synthesis (14). This pathway of protein synthesis inhibition does not seem to require dsRNA, unlike the protein kinase R and 2–5 (A) synthetase pathways, both of which are also activated by IFN. Although the expression of mRNA for both OAS1 and OAS2 was found to be increased in the microarray assay, the protein product of translation of these mRNAs may be inactive, because it requires dsRNA to polymerize ATP to produce RNase L-activating 2⬘-5⬘ oligoadenylates (21). However, no clear source of dsRNA in these experiments exists, and, thus, it cannot be the OAS that is inducing growth suppression. We have also demonstrated that at least some of the changes in gene expression induced by G3139, including upregulation of p21/Waf1/Cip1 protein expression and down-regulation of PKC-␣ and bcl-2 protein expression itself, were also observed after treatment with IFN- and -␥. Interestingly, however, although the expression of bcl-2 mRNA was down-regulated by IFN-␥ at 24 h after treatment, it recovered by 72 h, unlike bcl-2 protein, of which the expression remained low. Thus, it appears likely that the decrease in bcl-2 protein expression in IFN-treated cells is a result of block of translation of the mRNA, an increased rate of degradation, or both. This hypothesis is supported by the fact that G4126-treated cells demonstrate the identical pattern of changes in expression of bcl-2 mRNA with time, yet bcl-2 protein expression is not diminished
Downloaded from clincancerres.aacrjournals.org on June 1, 2017. © 2004 American Association for Cancer Research.
3688 G3139 Induces the Interferon Cascade in PC3 Cells
by 3 days after treatment. However, this is unlike what was observed after G3139 treatment, where at 72 h both bcl-2 protein and mRNA expression remain low. Indeed, we believe that G3139 treatment of PC3 cells is so highly effective at the down-regulation of bcl-2 protein expression precisely because it does so by two distinct mechanisms: an antisense RNase Hdependent mechanism, which is active at the level of the bcl-2 mRNA, and an “IFN-mimetic” mechanism, which appears to be active post-translationally. We also observed up-regulation of the expression of p21/ Waf1/Cip1 mRNA expression in the oligonucleotide microarray analysis after treatment of PC3 cells with G3139. This correlates with the very large increase in p21 protein expression also observed in these cells. It also appears that type I IFNs, similar to G3139, can block the progression of many cell types from the G1 into the S phase of the cell cycle (19). In DU145 cells, this has been associated previously with an IFN-induced doubling in levels of p21/Waf1/Cip1 protein expression, and presumably at least in part results from the ability of this protein to bind cyclin E-cyclin-dependent kinase 2 and block its activity. Nevertheless, the mechanism by which IFN-response genes are activated is somewhat unclear. We had originally hypothesized that G3139 was inducing the up-regulation of production of IFN- or -␥ protein, which could then activate IFN receptors in an autocrine/paracrine fashion. This possibility is ruled out by the ELISA data that demonstrate a 50% decrease in intracellular IFN concentration after oligonucleotide treatment. Added to this, there is insufficient IFN-␥ in the culture medium (⬍10 pM) to bind to and activate the cell surface IFN-␥ receptor (Kd ⫽ 100 pM). Moreover, the oligonucleotides cannot be directly binding to and activating IFN receptors, because treatment of cells with naked oligonucleotides does not recapitulate the observed phenotype. Teleologically, the origin of the hypothesized “dsRNAlike” or “IFN-mimetic” mechanism observed in this work is also unclear. The only single-stranded DNA genome is found in parvoviridae, which appear to be very inefficient at inducing type I IFNs in mammalian cells (22). Likewise, neither single stranded oligodeoxyribonucleotides nor their phosphorothioate analogs have been known previously to be inducers of IFN or of IFN-related proteins in carcinoma cells (23), as opposed to their induction in immunocompetent cells. Finally, it should be noted that although the experiments presented above are highly representative, not all of the genes described here were induced under all of the transfection conditions. The transfection process is complex, and differences in particle size, rate of adsorption to the cell surface, rate of cellular endocytosis, and rate of endosomal egress may all contribute to differences in the intranucleotide concentration of oligonucleotide, and hence to the observed phenotype.
REFERENCES 1. Klasa RJ, Gillum AM, Klem RE, Frankel SR. Oblimerson Bcl-2 antisense: facilitating apoptosis in anticancer treatment. Antisense Nucleic Acid Drug Dev 2002;12:193–213. 2. Miyake H, Tolcher A, Gleave ME. Chemosensitization and delayed androgen-independent recurrence of prostate cancer with the use of antisense Bcl-2 oligodeoxynucleotides. J Natl Cancer Inst 2000;92:34– 41. 3. Chi K, Wallis AE, Lee CH, et al. Effects of Bcl-2 modulation with G3139 antisense oligonucleotide on human breast cancer cells are
independent of inherent Bcl-2 protein expression. Breast Cancer Res Treat 2000;63:199 –212. 4. Jansen B, Schlagbauer-Wadl H, Brown BD, et al. Bcl-2 antisense therapy chemosensitizes human melanoma in SCID mice. Nat Med 1998;4:232– 4. 5. Jansen B, Wacheck V, Heere-Ress E, et al. Chemosensitisation of malignant melanoma by BCL2 antisense therapy. Lancet 2000;356: 1728 –33. 6. Guvakova MA, Yakubov LA, Vlodavsky I, Tonkinson JL, Stein CA. Phosphorothioate oligodeoxynucleotides bind to basic fibroblast growth factor, inhibit its binding to cell surface receptors, and remove it from low affinity binding sites on extracellular matrix. J Biol Chem 1995; 270:2620 –7. 7. Khaled Z, Benimetskaya L, Khan T, et al. Multiple mechanisms may contribute to the cellular antiadhesive effects of phosphorothioate oligodeoxynucelotides. Nucl Acids Res 1996;24:737– 45. 8. Rockwell P, O’Connor W, King K, Goldstein N, Zhang L, Stein CA. Cell surface perturbations of the EGF and VEGF receptors by phosphorothioate oligonucleotides. Proc Nat Acad Sci 1997;94:6523– 8. 9. Benimetskaya L, Miller P, Benimetsky S, et al. Inhibition of potentially anti-apoptotic proteins by antisense protein kinase C-␣ (Isis 3521) and antisense bcl-2 (G3139) phosphorothioate oligonucleotides: Relationship to the decreased viability of T24 Bladder and PC3 prostate cancer cells. Mol Pharmacol 2001;60:1296 –307. 10. Lai JC, Benimetskaya L, Santella RM, Wang Q, Miller PS, Stein CA. G3139 (Oblimersen) may inhibit prostate cancer cell growth in a partially bis-CpG-dependent, non-antisense manner. Mol Cancer Ther 2003;2:1031– 43. 11. Bargou R, Daniel PT, Mapara MY, et al. Expression of the bcl-2 gene family in normal and malignant breast tissue: low bax-alpha expression in tumors cells correlates with resistance towards apoptosis. Int J Cancer 1995;60:854 –9. 12. Doyle S, Vaidya S, O’Connell R, et al. IRF3 mediates a TLR3/ TLR4-specific antiviral gene program. Immunity 2002;17:251– 63. 13. Geiss G, Jin G, Guo J, Bumgarner R, Katze M, Sen G. A comprehensive view of regulation of gene expression by double-stranded RNAmediated cell signaling. J Bio Chem 2001;276:30178 – 82. 14. Guo J, Hui D, Merrick W, Sen G. A new pathway of translational regulation mediated by eukaryotic initiation factor 3. EMBO J 2000b; 19:6891–9. 15. Alexopoulou L, Czopik Holt A, Medzhitov R, Flavell R. Recognition of double-stranded RNA and activation of NF-kB by Toll-like receptor 3. Nature 2001;413:732– 8. 16. Takeuchi O, Akira S. Toll-like receptors; their physiological role and signal transduction system. International Immunopharmacology 2001;1:625–35. 17. Ballas Z, Rasmussen W, Krieg A. Induction of NK activity in murine and human cells by CpG motifs in oligodeoxynucleotides and bacterial DNA. J Immunol 1996;157:1840 –5. 18. Ballas Z, Krieg A, Warren T, et al. Divergent therapeutic and immunologic effects of oligodeoxynucleotides with distinct CpG motifs. J Immunol 2001;167:4878 – 86. 19. Hobeika A, Subramaniam P, Johnson H. IFN-alpha induces the expression of the cyclin-dependent kinase inhibitor p21 in human prostate cancer cells, Oncogene 1997;14:1165–70. 20. Guo J, Peters K, Sen G. Induction of the human protein P56 by interferon, double stranded RNA, or virus induction. Virology 2000a; 267:209 –19. 21. Ghosh A, Sarkar S, Sen G. Cell growth regulatory and antiviral effects of the P69 isozyme of 2–5 (A) synthetase. Virology 2000;266: 313–28. 22. Schlehofer J, Rentrop M, Mannel D. Parvoviruses are inefficient in inducing interferon-beta, tumor necrosis factor-alpha, or interleukin-6 in mammalian cells. Med Microbiol Immunol 1992;181:153– 64. 23. Matsukura M, Shinozuka K, Zon G, et al. Phosphorothioate analogs of oligodeoxynucleotides: Inhibitors of replication and cytopathic effects of human immunodeficiency virus. Proc Nat Acad Sci 1987;84: 7706 –10.
Downloaded from clincancerres.aacrjournals.org on June 1, 2017. © 2004 American Association for Cancer Research.
Changes in Gene Expression Induced by Phosphorothioate Oligodeoxynucleotides (Including G3139) in PC3 Prostate Carcinoma Cells Are Recapitulated at Least in Part by Treatment with Interferon- β and -γ Luba Benimetskaya, Timo Wittenberger, C. A. Stein, et al. Clin Cancer Res 2004;10:3678-3688.
Updated version
Cited articles Citing articles
E-mail alerts Reprints and Subscriptions Permissions
Access the most recent version of this article at: http://clincancerres.aacrjournals.org/content/10/11/3678
This article cites 22 articles, 11 of which you can access for free at: http://clincancerres.aacrjournals.org/content/10/11/3678.full.html#ref-list-1 This article has been cited by 8 HighWire-hosted articles. Access the articles at: /content/10/11/3678.full.html#related-urls
Sign up to receive free email-alerts related to this article or journal. To order reprints of this article or to subscribe to the journal, contact the AACR Publications Department at
[email protected]. To request permission to re-use all or part of this article, contact the AACR Publications Department at
[email protected].
Downloaded from clincancerres.aacrjournals.org on June 1, 2017. © 2004 American Association for Cancer Research.