Jan 20, 2010 - 7 Abbreviations used: ATF4, activating transcription factor 4; CHOP, CCAAT/enhancer binding protein homologous protein; CRP, C-reactive ...
The Journal of Nutrition. First published ahead of print January 20, 2010 as doi: 10.3945/jn.109.117374. The Journal of Nutrition Nutrient Physiology, Metabolism, and Nutrient-Nutrient Interactions
Changes in Intestinal Bifidobacteria Levels Are Associated with the Inflammatory Response in Magnesium-Deficient Mice1–3 Barbara D. Pachikian,4 Audrey M. Neyrinck,4 Louise Deldicque,6 Fabienne C. De Backer,4 Emilie Catry,4 Evelyne M. Dewulf,4 Florence M. Sohet,4 Laure B. Bindels,4 Amandine Everard,4 Marc Francaux,6 Yves Guiot,5 Patrice D. Cani,4 and Nathalie M. Delzenne4* 4 Metabolism and Nutrition Research Group, Louvain Drug Research Institute and 5Department of Pathology, Universite´ catholique de Louvain, Brussels 1200, Belgium; and 6Research Group in Muscle and Exercise Physiology, Institute of Neuroscience, Universite´ catholique de Louvain, Louvain-la-Neuve 1348, Belgium
Abstract Magnesium (Mg) deficiency is a common nutritional disorder that is linked to an inflammatory state characterized by increased plasma acute phase protein and proinflammatory cytokine concentrations. Recent studies have shown that changes in the composition of gut microbiota composition participate in systemic inflammation. In this study, therefore, we assessed the potential role of gut microbiota in intestinal and systemic inflammation associated with Mg deficiency in mice. For this purpose, mice were fed a control or Mg-deficient diet (500 mg vs. 70 mg Mg/kg) for 4 or 21 d. Compared with the mice fed the control diet, mice fed the Mg-deficient diet for 4 d had a lower gut bifidobacteria content (minus 1.5 log), a 36–50% lower mRNA content of factors controlling gut barrier function in the ileum (zonula occludens-1, occludin, proglucagon), and a higher mRNA content (by ;2-fold) in the liver and/or intestine of tumor necrosis factor-a, interleukin-6, CCAAT/enhancer binding protein homologous protein, and activating transcription factor 4, reflecting inflammatory and cellular stress. In contrast, mice fed the Mg-deficient diet for 21 d had a higher cecal bifidobacteria content compared with the control group, a phenomenon accompanied by restoration of the intestinal barrier and the absence of inflammation. In conclusion, we show that Mg deficiency, independently of any other changes in nutrient intake, modulates the concentration of bifidobacteria in the gut, a phenomenon that may time-dependently affect inflammation and metabolic disorders in mice. J. Nutr. doi: 10.3945/jn.109.117374.
Introduction Magnesium (Mg) is the second most abundant intracellular cation after potassium and plays an essential role in numerous fundamental cellular reactions (1). Mg deficiency is associated with several metabolic disorders, including type 2 diabetes (2,3), metabolic syndrome (4–6), dyslipidemia (7–9), and hypertension (10–13). In addition, systemic inflammation has been observed in subjects with hypomagnesemia (14,15). Gut and systemic inflammation in rodent models of Mg deficiency are characterized by leukocyte and macrophage activation with increased production of inflammatory cytokines and acute phase proteins (14,16,17). The mechanism underlying the
1 Supported by the Fonds National de la Recherche Scientifique (convention FRSM 3.4574.07) and by the Re´gion Wallonne (Walnut 20). 2 Author disclosures: B. D. Pachikian, A. M. Neyrinck, L. Deldicque, F. C. De Backer, E. Catry, E. M. Dewulf, F. M. Sohet, L. B. Bindels, A. Everard, M. Francaux, Y. Guiot, P. D. Cani, and N. M. Delzenne, no conflicts of interest. 3 Supplemental Table 1 and Supplemental Figure 1 are available with the online posting of this paper at jn.nutrition.org. * To whom correspondence should be addressed. E-mail: nathalie.delzenne@ uclouvain.be.
immunomodulation occurring during Mg deficiency remains poorly described. In our laboratory, we have demonstrated a link between gut microbiota and systemic inflammation that drives the metabolic disturbances in obesity (18–21). Lipopolysaccharide (LPS)7 is a major component of the outer membrane of Gram-negative bacteria, which, once in the circulation, can trigger the secretion of proinflammatory cytokines (21,22). In several models of obese mice, a decrease in cecal content of lactic acid-producing bacteria, such as bifidobacteria, correlated with higher intestinal permeability. Increased permeability promotes LPS translocation that drives endotoxemia and inflammation (19,20). Therefore, in this study, we analyzed the intestinal and systemic inflammatory response occurring in Mg-deficient mice and related these data to changes in gut microbiota composition.
7 Abbreviations used: ATF4, activating transcription factor 4; CHOP, CCAAT/enhancer binding protein homologous protein; CRP, C-reactive protein; IL, interleukin; LPS, lipopolysaccharide; Occ, occludin; PG, proglucagon; TNFa, tumor necrosis factor-a; ZO-1, zonula occludens-1.
0022-3166/08 $8.00 ã 2010 American Society for Nutrition. Manuscript received October 13, 2009. Initial review completed November 6, 2009. Revision accepted December 16, 2009. doi: 10.3945/jn.109.117374.
Copyright (C) 2010 by the American Society for Nutrition
1 of 6
Materials and Methods Animals and diets. Male C57Bl/6J mice (9 wk old; Charles River) were housed in groups of 4 mice per cage at 228C in a 12-h-light/-dark cycle and given free access to diet and water. After an acclimatization period of 1 wk, the mice (n = 8/group) were fed a control (Mg+) (D10001, Research Diets) or a Mg-deficient diet (Mg2) (D16601, Research Diets) for 4 or 21 d (Table 1). Distilled water was provided for drinking. The Mg concentration was 500 mg/kg in the control diet and 70 mg/kg in the deficient diet. Food intake, taking into account spillage, was recorded daily during the treatment as previously described (23,24). All experiments were approved by the local animal ethics committee and the housing conditions were as specified by the Belgian Law of November 14, 1993 on the protection of laboratory animals (agreement no. LA 1230314). Tissue samples. At the end of the study period, mice were anesthetized (ketamine/xylazine intraperitoneal, 100 and 10 mg/kg of body weight, respectively). The liver was immediately clamped in liquid N2 and kept at 2808C. Ileum tissue, proximal colon tissue, and cecal content were collected and stored at 2808C. A fraction of ileum was washed with PBS, mounted in embedding medium (Tissue-tek, Sakura), and stored at 2808C until use for immunofluorescence analysis. The jejunal mucosa was scraped off and stored at 2808C. Liver, spleen, fatty tissues (epididymal, subcutaneous, and visceral), cecal content, and cecal tissue were weighed. Blood samples. Portal vein blood was centrifuged 3 min at 13,000 3 g and stored at –80 8C. Serum LPS concentrations were determined using a kit based on a Limulus amebocyte extract (LAL kit; Cambrex Bioscience) as previously described (20); samples were diluted 1:100 in LPSfree water. Cava vein blood was centrifuged 3 min at 13,000 3 g and stored at –80 8C. The serum Mg concentration was determined using a Quantichrom magnesium assay kit (DIMG-250 Bioassay Systems). Disaccharidase activity. The jejunal sucrase, lactase, and maltase activities were assessed in the jejunal mucosa following the method of Dahlqvist (25).
TABLE 1
Composition of Mg+ and Mg2 diets
Ingredient
Casein DL-Methionine Corn starch Sucrose Cellulose, BW200 Corn oil Mineral mix S100011 Mineral mix S166012 Vitamin mix V100013 Choline bitartrate Total
Mg+ composition, % 20 0.3 15 50 5 5 3.5 0 1 0.2 100
1
Mg2 kJ/kg diet 3349 50 2512 8374 0 1884 69 0 167 0 16405
composition, % 20 0.3 15 50 5 5 0 3.5 1 0.2 100
kJ/kg diet 3349 50 2512 8374 0 1884 0 83 167 0 16419
Containing the following (g/kg mineral mix): 500 calcium phosphate, 24 magnesium oxide, 220 potassium citrate.1H2O, 52 potassium sulphate, 74 sodium chloride, 0.55 chromium potassium sulphate.12H2O, 0.3 cupric carbonate, 0.01 potassium iodate, 6 ferric citrate, 3.5 manganous carbonate, 0.01 sodium selenite, 1.6 zinc carbonate, and 118 sucrose. 2 Containing the following (g/kg mineral mix): 500 calcium phosphate, 220 potassium citrate.1H2O, 52 potassium sulphate, 74 sodium chloride, 0.55 chromium potassium sulphate.12H2O, 0.3 cupric carbonate, 0.01 potassium iodate, 6 ferric citrate, 3.5 manganous carbonate, 0.01 sodium selenite, 1.6 zinc carbonate, and 142 sucrose. 3 Containing the following (g/kg vitamin mix): 0.8 retinol palmitate, 1 cholecalciferol, 10 dl-a tocopherol acetate, 0.05 mg menadione, 0.02 biotin, 0.001 cyanocobalamin, 0.2 folic acid, 3 nicotinic acid, 1.7 calcium pantothenate, 0.7 pyridoxine, 0.6 riboflavin, 0.6 thiamin, and 978.42 sucrose.
2 of 6
Pachikian et al.
Immunofluorescence analysis of occludin and ZO-1. The immunofluorescence analysis of occludin (Occ) and zonula occludens-1 (ZO-1) in ileum was performed as previously described (20). Real-time quantitative PCR. Total RNA was isolated from liver tissue, ileum, and proximal colon using the TriPure reagent (Roche). cDNA was prepared by RT of 1 g total RNA using the Kit Reverse transcription System (Promega). Real-time PCR were performed with a StepOnePlus instrument and software (Applied Biosystems) as described (19). RPL19 RNA was chosen as an invariant standard. Gene transcripts for tumor necrosis factor-a (TNFa), interleukin (IL)-6, Occ, ZO-1, CCAAT/ enhancer binding protein homologous protein (CHOP), activating transcription factor 4 (ATF4), CD68, F4/80, C-reactive protein (CRP), IL-1b, and proglucagon (PG) were amplified using gene-specific primers (Supplemental Table 1). Real-time quantitative PCR for microbial cecal content. The cecal contents of Gram-positive Bifidobacterium spp. and Lactobacillus spp. were quantified as described previously (19). Results were expressed as [Log10 (bacterial cells/g of cecal content)]. Statistical analysis. Results are presented as mean 6 SEM. Mg+ and Mg2 mice were compared at each time using Student’s t-test with GraphPad Prism version 4.00 for Windows. Associations between variables were assessed by Pearson correlation test. P , 0.05 was considered significant.
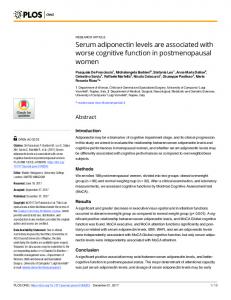
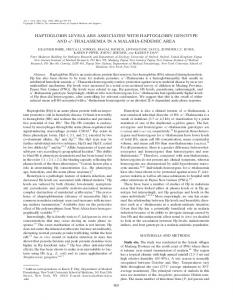
Results Mg2 mice had a lower body weight than Mg+ mice after 21 d. We assessed Mg deficiency from the serum Mg concentration. The serum Mg levels in the Mg2 mice were 43 and 60% lower than the corresponding control values after 4 and 21 d, respectively (Table 2). Mice fed a Mg-deficient diet for 4 d did not differ in food intake or body weight compared with Mg+ mice, although epididymal adipose tissue weight was ~22% lower (Table 2). After 21 d, Mg2 mice had lower body weight and white adipose tissue mass than Mg+ mice. The progressive loss of fat mass and body weight in the Mg2 mice may in part be explained by the lower total energy intake observed in these mice during the 21 d of the study period compared with Mg+ mice (Table 2). Mg deficiency modulated gut microbiota. After 4 d, Mg2 mice had ~43% less cecal content of bifidobacteria compared with Mg+ mice (Fig. 1A). The lactobacilli content did not differ between the groups at d 4 (Fig. 1B). Cecal tissue and content weight did not differ between Mg+ and Mg2 mice at d 4 (Table 2). Surprisingly, after 21 d, Mg2 mice had higher cecal tissue and content weights (Table 2) and a higher intestinal content of bifidobacteria and lactobacilli (Fig. 1C,D). The cecal content of bacteroides did not differ between Mg+ mice and Mg- mice after either 4 or 21 d (data not shown). We measured the jejunal disaccharidase activity to assess carbohydrate digestibility in the upper part of the intestine. Jejunal lactase, maltase, and sucrase activities were lower in Mg2 mice compared with Mg+ mice after 4 d (Supplemental Fig. 1). 4 d of Mg deficiency induced colonic inflammation and decreased factors controlling ileal permeability. After 4 d of Mg deficiency, the expression of Occ and ZO-1, 2 tight junction proteins, was ~37% less in the ileum of Mg2 compared with Mg+ mice (Table 3). The immunofluorescence assay performed on ileum sections of 4 d Mg+ mice revealed an intact network of Occ and ZO-1 proteins that were predominantly localized along
TABLE 2
Body and relative organs weight, energy intake, and serum Mg in mice fed a Mg+ or Mg2 diet for 4 or 21 d1 4 d of treatment
Body weight, g Spleen, g/100 g body weight Liver, g/100 g body weight EAT,2 g/100 g body weight SAT,3 g/100 g body weight VAT,4 g/100 g body weight Cecal tissue, g/100 g body weight Cecal content, g Total energy intake, kJ/mouse Serum Mg, mmol/L
21 d of treatment
Mg+
Mg2
Mg+
Mg2
22.89 6 0.35 0.28 6 0.01 3.64 6 0.12 1.74 6 0.10 0.95 6 0.05 0.68 6 0.05 0.26 6 0.01 0.11 6 0.01 160.02 6 4.06 0.79 6 0.03
22.79 6 0.41 0.32 6 0.03 3.87 6 0.08 1.36 6 0.11* 0.95 6 0.12 0.77 6 0.11 0.28 6 0.02 0.14 6 0.01 143.27 6 9.38 0.45 6 0.06*
23.79 6 0.53 0.31 6 0.01 3.91 6 0.10 1.23 6 0.05 1.44 6 0.06 0.64 6 0.05 0.24 6 0.02 0.13 6 0.02 953.84 6 27.80 0.80 6 0.02
21.92 6 0.40* 0.30 6 0.02 3.59 6 0.08* 1.10 6 0.05 1.33 6 0.06 0.47 6 0.03* 0.31 6 0.01* 0.17 6 0.01* 793.82 6 6.32* 0.32 6 0.02*
Data are presented as mean 6 SEM, n = 8. *Different from Mg+, P , 0.05. EAT, Epididymal adipose tissue. 3 SAT, Subcutaneous adipose tissue. 4 VAT, Visceral adipose tissue. 1 2
the apical cellular border (Fig. 2A,C). On the contrary, 4 d Mg2 mice exhibited discontinuous ZO-1 and Occ staining in the ileum (Fig. 2B,D). Similarly, Mg2 mice had ~ 50% lower ileal content of PG mRNA, a precursor of glucagon-like peptide-2 that participates in the control of gut permeability (20,26–28). These alterations were not associated with any sign of inflammation or stress in the ileum. In fact, at d 4, Mg+ and Mg2 mice did not differ in the ileal expression of TNFa and IL-6, 2 cytokines, or of ATF4 and CHOP, 2 markers of cellular stress associated with the inflammatory process (Table 3). In contrast, in the proximal colon of mice fed for 4 d with a Mg-deficient diet, there were no differences in mRNA content of the genes involved in intestinal permeability (PG, Occ, and ZO-1) compared with Mg+ mice; however, there was a higher expression of factors involved in cellular stress and inflammation (Table 3). CD68 and F4/80 expression, 2 markers of monocyte infiltration, was similar in Mg+ and Mg2 mice in the
ileum and was 25–50% higher in the proximal colon of Mg2 mice compared with Mg+ mice (Table 3). After 21 d of treatment, Mg+ and Mg2 mice did not differ in inflammation-related variables, monocyte infiltration, gut barrier function, or metabolic stress in the ileum or in the proximal colon (Table 3). Moreover, the immunofluorescence staining of ZO-1 and Occ in the ileum sections was similar in Mg+ and Mg2 mice after 21 d (Fig. 2E–H). 4 d of Mg deficiency induced systemic inflammation. Because the 4-d Mg deficiency induced systemic inflammation, we assessed systemic inflammation. Mg2 mice tended to have higher (P = 0.11) plasma LPS concentrations than did Mg+ mice after 4 d (LPS: Mg+, 8.0 6 1.0 EU/L; Mg2, 12.2 6 2.1 EU/L). The plasma LPS concentration did not differ between Mg+ and Mg2 mice after 21 d (LPS: Mg+, 8.9 6 3.5 EU/L; Mg2, 10.1 6 1.6 EU/L).
FIGURE 1 Cecal content of Bifidobacterium spp., and Lactobacillus spp. in mice fed a Mg+ or Mg2 diet for 4 d (A,B) or 21 d (C,D). Values are means 6 SEM, n = 8. *Different from Mg+, P , 0.05.
Gut microbiota and magnesium deficiency
3 of 6
TABLE 3
mRNA levels of factors involved in gut barrier function, inflammation, and cellular stress in mice fed a Mg+ or Mg2 diet for 4 or 21 d1 4 d of treatment Mg+
Ileum TNFa IL-6 ATF4 CHOP F4/80 CD68 Occ ZO-1 PG Proximal colon TNFa IL-6 ATF4 CHOP F4/80 CD68 Occ ZO-1 PG 1
Mg2
21 d of treatment Mg+
Mg2
6 0.18 6 0.19 6 0.06 6 0.07 6 0.09 6 0.09 6 0.10 6 0.09 6 0.14
1.05 1.27 0.98 1.21 0.84 0.99 0.64 0.66 0.55
relative expression 6 0.31 1.06 6 0.17 6 0.20 1.12 6 0.22 6 0.05 1.02 6 0.09 6 0.10 1.04 6 0.12 6 0.11 1.00 6 0.20 6 0.18 1.05 6 0.13 6 0.06* 1.18 6 0.24 1.18 6 0.24 6 0.07* 6 0.13* 1.24 6 0.34
0.67 1.41 1.21 1.34 1.24 1.11 1.13 1.27 1.39
6 0.13 6 0.11 6 0.13 6 0.15 6 0.15 6 0.10 6 0.25 6 0.22 6 0.46
1.25 6 0.31 1.03 6 0.11 1.02 6 0.07 1.05 6 0.12 1.01 6 0.06 1.02 6 0.08 1.06 6 0.13 1.05 6 0.12 1.06 6 0.16
3.00 3.03 1.34 1.64 1.51 1.28 1.15 1.25 0.81
6 0.39* 6 0.68* 6 0.07* 6 0.13* 6 0.18* 6 0.09* 6 0.18 6 0.13 6 0.26
0.76 1.18 1.39 1.17 1.10 1.11 0.98 0.97 0.36
6 0.25 6 0.12 6 0.09 6 0.08 6 0.09 6 0.09 6 0.10 6 0.07 6 0.05*
1.09 1.08 1.01 1.02 1.03 1.02 1.03 1.03 1.09
1.25 1.12 1.03 1.01 1.03 1.00 1.09 1.06 1.12
6 0.33 6 0.20 6 0.10 6 0.05 6 0.09 6 0.03 6 0.18 6 0.14 6 0.21
Data are presented as mean 6 SEM, n = 8. *Different from Mg+, P , 0.05.
After 4 d, Mg2 mice had a higher hepatic mRNA content of IL-6 and TNFa than Mg+ mice (Fig. 3A). After 21 d, the hepatic mRNA content of TNFa, IL-1b, CD68, and CRP did not differ between Mg+ and Mg2 mice, except for significantly lower IL-6 mRNA content in Mg2 mice (Fig. 3B). Bifidobacteria content correlated negatively with liver and proximal colon markers of inflammation. Cecal bifidobacteria content correlated negatively with inflammatory markers in the liver (IL-6: r = 20.65, P = 0.0003; TNFa: r = 20.44, P = 0.02) and in the proximal colon (IL-6: r = 20.42, P = 0.02; TNFa: r = 20.64, P = 0.0002) of Mg+ and Mg2 mice after 4 and 21 d.
Discussion Several studies have described systemic inflammation in Mgdeficient rodents, characterized by infiltration of leukocytes and phagocytic cells in various tissues (such as heart, lung, skeletal muscle, intestine, and thymus) and higher plasma levels of a number of positive acute phase proteins and cytokines, such as IL-6 and TNFa (14,29). However, a higher plasma TNFa concentration has not always been observed during Mg deficiency (17). Moreover, the mechanism underlying the immunomodulation linked to Mg deficiency remains poorly described. In our laboratory, we have demonstrated a link between gut microbiota and inflammation in several models of obesity (20,30). The concentration of bifidobacteria correlated inversely with endotoxemia, fat mass development, and disturbances in glucose metabolism in high-fat–fed mice (18). In this study, we show that the cecal content of bifidobacteria, and to a lesser extent of lactobacilli, decreases during short-term (4 d) Mg deficiency. This effect occurred independently of any 4 of 6
Pachikian et al.
FIGURE 2 Immunofluorescence staining of the ileum epithelial tight junction proteins in mice fed a Mg+ or Mg2 diet for 4 d (Occ: A,B; ZO-1: C,D) or 21 d (Occ: E,F; ZO-1: G,H).
significant change in food intake and was therefore not attributable to any changes in other nutrients. Some studies have revealed the importance of Mg in bifidobacteria physiology (31,32). Mg requirements are much higher for Gram-positive than for Gram-negative bacteria (33). Interestingly, the concentrations of bifidobacteria and lactobacilli were higher in Mg2 mice than in Mg+ mice after 21 d of treatment. This phenomenon may be interpreted as an adaptive mechanism. Despite a lower nutrient intake, Mg2 mice had a greater cecal content and tissue weight than Mg+ mice at 21 d. This observation suggests increased fermentation in Mg2 mice, which could be explained by decreased activity of the intestinal enzymes involved in carbohydrate digestion, leading to an increased availability of nutrients in the ceco-colon for fermentation. In fact, we observed reduced activity of the disaccharidases in Mg2 mice compared with Mg+ mice. Bifidobacteria are known to reduce intestinal LPS and to improve mucosal barrier function (34–37). In our study, Mg2 mice had a lower cecal bifidobacteria content at d 4 than Mg+ mice and this was associated with a lower ileal content of ZO-1 and Occ mRNA, 2 tight junction proteins that control gut barrier function. Analogous to the observation previously made in obese animals (20), we can relate the decrease in ZO-1 and Occ to a lower expression of PG in the ileum of Mg2 mice at 4 d.
gut microbiota composition (more bifidobacteria and lactobacilli, less bacteroides). In conclusion, we show that targeted nutritional modulation of dietary mineral content (i.e. Mg level) may drive changes in gut microbiota composition, which has consequences on host metabolism. Acknowledgements B.D.P., A.M.N., P.D.C, and N.M.D designed research; B.D.P, L.D., F.C.D.B., E.C., E.M.D., F.M.S., L.B.B., A.E., and P.D.C. conducted research; B.D.P. analyzed data; B.D.P., A.M.N., M.F., Y.G., P.D.C., and N.M.D. wrote the paper; and N.M.D. had primary responsibility for final content. All authors read and approved the final manuscript. P.D.C. is research associate from the FRS-FNRS (Fonds de la Recherche Scientifique, Belgium). L.B.B. and L.D. are Research Fellow and Postdoctoral Researcher from the FRS-FNRS, respectively. We thank Olivier Rottier and Damien Naslain for excellent technical assistance.
Literature Cited FIGURE 3 Liver content of TNFa, IL-6, IL-1b, CD68, and CRP mRNA in mice fed a Mg+ or a Mg2 diet for 4 d (A) or 21 d (B). Values are mean 6 SEM, n = 8. See Supplemental Table 1 for primer sequences and abbreviations. *Different from Mg+, P , 0.05.
1. 2.
3.
PG mRNA is translated into glucagon-like peptide-2, an intestinotrophic peptide that has been shown to decrease gut permeability (26–28). The higher intestinal permeability observed after 4 d of Mg deficiency could explain the higher portal LPS concentration. Systemic exposure to LPS is an important inflammatory trigger (22) and is commonly associated with hepatic inflammation (20). Chmielinska et al. (38) suggested the presence of increased intestinal permeability in Mg-deficient rats. These investigators described increased expression of the CD14 receptor, which specifically binds LPS in the heart, gut, and liver tissue of Mgdeficient rats. Our results are in agreement with this previous observation, because mice deficient in Mg for 4 d had a higher mRNA content of IL-6 and TNFa, 2 proinflammatory cytokines, in the liver and in the proximal colon than control mice. Moreover, Mg2 mice exhibited a higher expression of CD68 and F4/80 in the proximal colon, suggesting monocyte infiltration. Inflammation is often accompanied by cellular alterations. Several reports have demonstrated that inflammatory cytokines can induce endoplasmic reticulum stress and, therefore, activate the unfolded protein response (39). Moreover, a study conducted in mice demonstrated that LPS induced the expression of ATF4 and CHOP in the lung (40). In the present study, the proximal colon of Mg2 mice at 4 d, which exhibited a higher IL-6 and TNFa mRNA content, also had a higher expression of stress markers, such as ATF4 and CHOP, compared with Mg+ mice. The impact of Mg deficiency on cellular and inflammatory stress seemed confined to the proximal colon, because in the ileum, these markers were not modified by Mg deficiency. We can, therefore, suggest that decreased bifidobacteria content as a result of short-term Mg deficiency may participate in increased intestinal permeability, resulting in colonic and systemic inflammation. Despite a progressive loss of body weight, the mice fed a Mg-deficient diet for a longer period had no signs of inflammation, in accordance with restoration of
4. 5.
6.
7.
8.
9.
10. 11. 12. 13.
14.
15.
16.
Wolf FI, Cittadini A. Chemistry and biochemistry of magnesium. Mol Aspects Med. 2003;24:3–9. Barbagallo M, Dominguez LJ. Magnesium metabolism in type 2 diabetes mellitus, metabolic syndrome and insulin resistance. Arch Biochem Biophys. 2007;458:40–7. Guerrero-Romero F, Rascon-Pacheco RA, Rodriguez-Moran M, de la Pena JE, Wacher N. Hypomagnesaemia and risk for metabolic glucose disorders: a 10-year follow-up study. Eur J Clin Invest. 2008;38: 389–96. Guerrero-Romero F, Rodriguez-Moran M. Low serum magnesium levels and metabolic syndrome. Acta Diabetol. 2002;39:209–13. Lima ML, Cruz T, Rodrigues LE, Bomfim O, Melo J, Correia R, Porto M, Cedro A, Vicente E. Serum and intracellular magnesium deficiency in patients with metabolic syndrome: evidences for its relation to insulin resistance. Diabetes Res Clin Pract. 2009;83:257–62. Evangelopoulos AA, Vallianou NG, Panagiotakos DB, Georgiou A, Zacharias GA, Alevra AN, Zalokosta GJ, Vogiatzakis ED, Avgerinos PC. An inverse relationship between cumulating components of the metabolic syndrome and serum magnesium levels. Nutr Res. 2008; 28:659–63. Corica F, Corsonello A, Ientile R, Cucinotta D, Di BA, Perticone F, Dominguez LJ, Barbagallo M. Serum ionized magnesium levels in relation to metabolic syndrome in type 2 diabetic patients. J Am Coll Nutr. 2006;25:210–5. Nozue T, Kobayashi A, Uemasu F, Takagi Y, Sako A, Endoh H. Magnesium status, serum HDL cholesterol, and apolipoprotein A-1 levels. J Pediatr Gastroenterol Nutr. 1995;20:316–8. Guerrero-Romero F, Rodriguez-Moran M. Hypomagnesemia is linked to low serum HDL-cholesterol irrespective of serum glucose values. J Diabetes Complications. 2000;14:272–6. Sontia B, Touyz RM. Magnesium transport in hypertension. Pathophysiology. 2007;14:205–11. Swaminathan R. Magnesium metabolism and its disorders. Clin Biochem Rev. 2003;24:47–66. Sontia B, Touyz RM. Role of magnesium in hypertension. Arch Biochem Biophys. 2007;458:33–9. Hajjar I, Kotchen T. Regional variations of blood pressure in the United States are associated with regional variations in dietary intakes: the NHANES-III data. J Nutr. 2003;133:211–4. Mazur A, Maier JA, Rock E, Gueux E, Nowacki W, Rayssiguier Y. Magnesium and the inflammatory response: potential physiopathological implications. Arch Biochem Biophys. 2007;458:48–56. Song Y, Ridker PM, Manson JE, Cook NR, Buring JE, Liu S. Magnesium intake, C-reactive protein, and the prevalence of metabolic syndrome in middle-aged and older U.S. women. Diabetes Care. 2005;28:1438–44. Scanlan BJ, Tuft B, Elfrey JE, Smith A, Zhao A, Morimoto M, Chmielinska JJ, Tejero-Taldo MI, Mak I, et al. Intestinal inflammation
Gut microbiota and magnesium deficiency
5 of 6
17.
18.
19.
20.
21.
22.
23.
24.
25. 26.
27.
caused by magnesium deficiency alters basal and oxidative stressinduced intestinal function. Mol Cell Biochem. 2007;306:59–69. Malpuech-Brugere C, Nowacki W, Daveau M, Gueux E, Linard C, Rock E, Lebreton J, Mazur A, Rayssiguier Y. Inflammatory response following acute magnesium deficiency in the rat. Biochim Biophys Acta. 2000;1501:91–8. Cani PD, Neyrinck AM, Fava F, Knauf C, Burcelin RG, Tuohy KM, Gibson GR, Delzenne NM. Selective increases of bifidobacteria in gut microflora improve high-fat-diet-induced diabetes in mice through a mechanism associated with endotoxaemia. Diabetologia. 2007;50: 2374–83. Cani PD, Bibiloni R, Knauf C, Waget A, Neyrinck AM, Delzenne NM, Burcelin R. Changes in gut microbiota control metabolic endotoxemiainduced inflammation in high-fat diet-induced obesity and diabetes in mice. Diabetes. 2008;57:1470–81. Cani PD, Possemiers S, Van de Wiele T, Guiot Y, Everard A, Rottier O, Geurts L, Naslain D, Neyrinck AM, et al. Changes in gut microbiota control inflammation in obese mice through a mechanism involving GLP-2-driven improvement of gut permeability. Gut. 2009;58: 1091–103. Cani PD, Amar J, Iglesias MA, Poggi M, Knauf C, Bastelica D, Neyrinck AM, Fava F, Tuohy KM, et al. Metabolic endotoxemia initiates obesity and insulin resistance. Diabetes. 2007;56:1761–72. Wright SD, Ramos RA, Tobias PS, Ulevitch RJ, Mathison JC. CD14, a receptor for complexes of lipopolysaccharide (LPS) and LPS binding protein. Science. 1990;249:1431–3. Cani PD, Dewever C, Delzenne NM. Inulin-type fructans modulate gastrointestinal peptides involved in appetite regulation (glucagon-like peptide-1 and ghrelin) in rats. Br J Nutr. 2004;92:521–6. Cani PD, Neyrinck AM, Maton N, Delzenne NM. Oligofructose promotes satiety in rats fed a high-fat diet: involvement of glucagon-like Peptide-1. Obes Res. 2005;13:1000–7. Dahlqvist A. Assay of intestinal disaccharidases. Anal Biochem. 1968;22:99–107. Cameron HL, Perdue MH. Stress impairs murine intestinal barrier function: improvement by glucagon-like peptide-2. J Pharmacol Exp Ther. 2005;314:214–20. Cameron HL, Yang PC, Perdue MH. Glucagon-like peptide-2-enhanced barrier function reduces pathophysiology in a model of food allergy. Am J Physiol Gastrointest Liver Physiol. 2003;284:G905–12.
6 of 6
Pachikian et al.
28. Benjamin MA, McKay DM, Yang PC, Cameron H, Perdue MH. Glucagon-like peptide-2 enhances intestinal epithelial barrier function of both transcellular and paracellular pathways in the mouse. Gut. 2000;47:112–9. 29. Weglicki WB, Phillips TM, Freedman AM, Cassidy MM, Dickens BF. Magnesium-deficiency elevates circulating levels of inflammatory cytokines and endothelin. Mol Cell Biochem. 1992;110:169–73. 30. Cani PD, Delzenne NM. The role of the gut microbiota in energy metabolism and metabolic disease. Curr Pharm Des. 2009;15:1546–58. 31. Topouzian N, Joseph BJ, Bezkorovainy A. Effect of various metals and calcium metabolism inhibitors on the growth of Bifidobacterium bifidum var. pennsylvanicus. J Pediatr Gastroenterol Nutr. 1984;3: 137–42. 32. Molenkamp GC, Veerkamp JH. Effects of antibiotics on metabolism of peptidoglycan, protein, and lipids in Bifidobacterium bifidum subsp. pennsylvanicus. Antimicrob Agents Chemother. 1976;10:786–94. 33. Webb M. The influence of magnesium on cell division. IV. The specificity of magnesium. J Gen Microbiol. 1951;5:480–4. 34. Wang Z, Xiao G, Yao Y, Guo S, Lu K, Sheng Z. The role of bifidobacteria in gut barrier function after thermal injury in rats. J Trauma. 2006;61:650–7. 35. Griffiths EA, Duffy LC, Schanbacher FL, Qiao H, Dryja D, Leavens A, Rossman J, Rich G, Dirienzo D, et al. In vivo effects of bifidobacteria and lactoferrin on gut endotoxin concentration and mucosal immunity in Balb/c mice. Dig Dis Sci. 2004;49:579–89. 36. Wang ZT, Yao YM, Xiao GX, Sheng ZY. Risk factors of development of gut-derived bacterial translocation in thermally injured rats. World J Gastroenterol. 2004;10:1619–24. 37. Ruan X, Shi H, Xia G, Xiao Y, Dong J, Ming F, Wang S. Encapsulated Bifidobacteria reduced bacterial translocation in rats following hemorrhagic shock and resuscitation. Nutrition. 2007;23:754–61. 38. Chmielinska JJ, Tejero-Taldo MI, Mak IT, Weglicki WB. Intestinal and cardiac inflammatory response shows enhanced endotoxin receptor (CD14) expression in magnesium deficiency. Mol Cell Biochem. 2005;278:53–7. 39. Zhang K, Kaufman RJ. From endoplasmic-reticulum stress to the inflammatory response. Nature. 2008;454:455–62. 40. Endo M, Oyadomari S, Suga M, Mori M, Gotoh T. The ER stress pathway involving CHOP is activated in the lungs of LPS-treated mice. J Biochem. 2005;138:501–7.