451
Changes in the Composition of Circulating CD8+ T Cell Subsets during Acute Epstein-Barr and Human Immunodeficiency Virus Infections in Humans Marijke Th. L. Roos,1 Rene´ A. W. van Lier,2 Do¨rte Hamann,1 Gerlinde J. Knol,1 Irma Verhoofstad,1 Debbie van Baarle,1 Frank Miedema,1,3 and Peter Th. A. Schellekens1,4
Departments of 1Clinical Viro-Immunology and 2Immunobiology, CLB and Laboratory for Experimental and Clinical Immunology of the University of Amsterdam at the CLB, and Departments of 3Human Retrovirology and 4Internal Medicine, Academic Medical Center, University of Amsterdam, Amsterdam, The Netherlands
In response to viral infection, unprimed naive CD8+, major histocompatibility complex class I–restricted, virus-specific T cells clonally expand and differentiate into memory- and effector-type cells. Changes in CD8+ subset distribution were studied in 17 subjects with acute human immunodeficiency virus type 1 infection and in 14 subjects with acute Epstein-Barr virus (EBV) infection, with combined CD45RO, CD27, and CD28 monoclonal antibodies. A vast expansion of memory-type CD45RO+CD27+CD8+ T cells, with high expression of the cell-cycle marker Ki-67, was observed in both infections. Strikingly, CD45RO+CD27+CD282 cells increased 110-fold in acute viral infection and had high Ki-67 expression. In acute EBV infection, a substantial portion of the expanded T cells were EBV-peptide specific. These cells resided mainly in the CD45RO+CD27+ subpopulation, with most in the CD27+CD282 subpopulation. Content of perforin expression, as a measure of cytotoxic capacity, was relatively low in the CD27+CD28+ T cells and highest in the CD272CD282 subpopulation.
Within the CD81 T cell population, unprimed or naive cells that have not yet encountered antigen and primed cells that have encountered antigen can be distinguished. Antigenic challenge induces the formation of effector cells, which exert specific functions, such as cytolysis of virus-infected cells and memory cells, which, on renewed contact with the same pathogen, rapidly induce the generation of novel effector cells and thus provide the basis for immunity [1]. In vitro, cytotoxic T lymphocyte (CTL) effector cells express perforin and can lyse specific targets, without prior activation [2]. Without further activation, memory-type cells do not display cytolytic potential [2–6]. Previously, the frequencies of the antigen-specific T cells were generally estimated by using limiting-dilution assays. Recently, novel methods of estimating frequencies of antigen-specific T cells have been described. These include assays to detect interferon (IFN)–g release from individual CD81 T cells after specific stimulation [7] and the use of tetrameric major histocompatibility complex (MHC)–peptide complexes to directly stain T cells of the appropriate specificity [8–10]. CD81 T cells can be subdivided into naive, effector, and memory cells with a combination of CD45RA and CD27 monoclonal antibodies (MAbs) [11]. On the basis of functional and phenoReceived 29 November 1999; revised 3 May 2000; electronically published 24 July 2000. Informed consent was obtained, from all patients, to sample their blood and to use the data for this study. Reprints or correspondence: Dr. Peter Th. A. Schellekens, CLB, Dept. of Clinical Viro-Immunology, P.O. Box 9190, 1006 AD Amsterdam, The Netherlands (
[email protected]). The Journal of Infectious Diseases 2000; 182:451–8 q 2000 by the Infectious Diseases Society of America. All rights reserved. 0022-1899/2000/18202-0010$02.00
typic characteristics, it was concluded that CD45RA1CD271 cells represent naive cells [11]. Effector-type cells have a CD45RA1CD272 phenotype and a strong cytolytic activity, without prior in vitro stimulation. As expected, according to their function, CD45RA1CD272 T cells have high perforin and granzyme expression, are the only CD81 T cells that contain Fasligand mRNA, and abundantly produce IFN-g and tumor necrosis factor (TNF)–a. Memory-type cells can be characterized as CD45RA2CD271, and they express CD45RO. It is expected that, during a response to an acute viral infection, the composition of circulating CD81 subsets will change. Indeed, in acute viral infection, transient increases in the number of CD81 T cells (mainly activated CD45RO1 T cells) have been reported [12–17]. To investigate changes induced by acute viral infection on subset composition within the CD81 compartment, we studied subjects with acute human immunodeficiency virus (HIV) type 1 infection or acute EpsteinBarr virus (EBV) infection. HIV-1–infected subjects were studied within 3 weeks after seroconversion, and EBV-infected subjects were studied within 2 weeks after the onset of illness. To dissect the CD81 subpopulations, we used a combination of CD45RO and CD27, together with the intracellular analysis of perforin [18–20], and the cell-cycle marker Ki-67 [21, 22]. On activation in vivo, T cells lose CD28 [23–26]; thus, this marker was included in the analysis. Furthermore, during acute EBV infection, antigen-specific CD81 T cell subpopulations were identified by use of tetrameric MHC-peptide complexes. Our study allows the proposal of a model for differentiation of CD81 T cells during viral infections. Moreover, we identified the CD81CD45RO1CD271CD282 phenotype that may characterize T cells in transition from the proliferative
452
Roos et al.
CD81CD45RO1CD271 pool to the nondividing effector population.
Materials and Methods Study population. Phenotypic characteristics of CD81 subsets were analyzed in patients with acute HIV or EBV infections. Blood samples were obtained from 17 patients within 3 weeks after seroconversion to HIV-1 [15]. Fourteen EBV-infected patients were selected on the basis of consultation with their general practitioners, whose diagnoses of clinical disease were confirmed by a positive reaction in the Paul-Bunnell test and marked lymphocytosis that consisted of 110% atypical lymphocytes. Blood samples were obtained from EBV patients within 14 days after the onset of illness. Healthy individuals (n p 22 ) served as controls. Assays were done on fresh whole blood or on peripheral blood mononuclear cells (PBMC). The characteristics of the participants are presented in table 1. MAbs. CD81 T cells were subdivided into naive (CD45RO2 CD271), memory (CD45RO1CD271 and CD45RO1CD272), and effector (CD45RO2CD272) cells. In contrast to another study that used the CD45RA/CD27 combination [11], we used CD45RO combined with CD27. This combination resulted in subset distributions comparable to those in the CD45RA/CD27 combination. We also measured the combined expression of CD27 and CD28. A paucity of material sometimes precluded the simultaneous measurement of all markers. Fluorescein isothiocyanate (FITC)–conjugated CD28 MAb, CD27 MAb, mouse IgG1 control MAb, phycoerythrin (PE)–conjugated mouse IgG2a and IgG2b control MAbs, and biotinylated CD27 MAb were produced at CLB (Amsterdam). PEconjugated CD28 MAb and peridinin chlorophyll protein (PerCP)– conjugated CD8 MAb were purchased from Becton Dickinson (San Jose, CA). PE- and FITC-labeled CD45RO MAbs were obtained from DAKO (Glostrup, Denmark). FITC-labeled Ki-67 MAb was purchased from Immunotech (Marseilles, France), FITC-conjugated perforin MAb was purchased from Ho¨lzel Diagnostika (Ko¨ln, Germany), and allophycocyanin (APC)–labeled streptavidin was from Caltag (South San Francisco, CA). Intracellular staining for Ki-67 and perforin. The nuclear antigen Ki-67, which is expressed in all phases of the cell cycle, is located in the outer parts of the nucleolus and can be used to determine the percentage of proliferating cells [21, 22]. For Ki-67 expression, blood (200 mL) was surface stained with CD8-PerCP and a combination of CD45RO-PE and biotinylated CD27 or a combination of CD28-PE and biotinylated CD27. Intracellular perforin expression was determined in the CD27 and CD28 subsets. Mouse IgG1–FITC control MAb was used as negative control. After cell-surface staining, we washed cells twice with PBS/0.15% bovine serum albumin (BSA) and incubated them with streptavidin-APC.
JID 2000;182 (August)
Red blood cells were lysed, and lymphocytes were fixed with fluorescence-activated cell sorter (FACS) lysing solution (Becton Dickinson, San Jose), permeabilized with permeabilization solution (Becton Dickinson, San Jose), and washed with PBS/0.15% BSA. Subsequent staining with Ki-67–FITC or perforin-FITC MAb was done. Cells were washed twice with PBS/0.15% BSA and were resuspended in 150 mL of fixation buffer (CellFIX; Becton Dickinson, San Jose), after which data acquisition and analyses were done by 4-color flow cytometry (FACSCalibur; Becton Dickinson, Mountain View, CA) with Cellquest software (Becton Dickinson, San Jose). Twenty thousand CD81 cells were analyzed. During all steps, samples were kept at room temperature; incubation steps were done for 30 min, and fixation and permeabilization were done for 10 min. Cryopreserved material was available for 9 patients. The staining procedure for PBMC (1 3 10 6 cells) was identical to that described above for whole blood, with the exception that incubation steps were done at 47C. In a set of preliminary experiments, we showed that cryopreservation did not affect the percentage of Ki-671 cells (data not shown). Cytotoxicity assay. CTL activity was determined in a CD3 MAb–mediated redirected cytotoxicity assay as described elsewhere [27]. For subset purification, CD81 T cells were prepared by positive enrichment, using a magnetic activated cell sorting system (Miltenyi Biotec, Bergisch-Gladbach, Germany), as reported elsewhere [11]. Next, cells were stained with PE-conjugated CD28 and FITCconjugated CD27 and sorted into CD281CD271, CD271CD282, and CD272CD282 populations on a FACStar (Becton Dickinson, Mountain View, CA). MHC-peptide tetrameric complexes. HLA-B8 tetramers complexed with the EBV peptide RAKFKQLL, derived from the lytic protein BZLF1 [28], were provided by A. J. McMichael and M. F. C. Callan (John Radcliffe Hospital, Oxford, UK). We used 4color staining to measure antigen-specific frequencies. PBMC (1 3 10 6) were stained with APC-conjugated tetrameric complexes in combination with either CD8-PerCP, CD45RO-PE, and CD27FITC or CD8-PerCP, CD28-PE, and CD27-FITC (at 47C). After being incubated with FACS lysing solution (at room temperature), cells were washed twice with cold PBS/0.15% BSA and were resuspended in 100 mL of fixation buffer (Becton Dickinson, San Jose). Time of incubation, data acquisition, and analysis were identical to those described above for Ki-67 analysis. Statistical analysis. Values of the subsets were analyzed between the different study populations, by the Wilcoxon rank sum test.
Results Subsets of CD81 T cells in acute viral infection. As expected, the patients with acute HIV-1 and EBV infections had elevated CD81 T cell numbers, which resulted in inverted CD4/CD8
Table 1. Characteristics of study patients with acute human immunodeficiency virus (HIV) or Epstein-Barr virus (EBV) infection. Study group Controls HIV-1 infected EBV infected NOTE.
No. tested
Age, years
CD41 3109/L
CD81 3109/L
CD4/CD8 ratio
22 17 14
31 (21–60) 34 (24–56) 24 (16–57)
0.87 (0.54–1.72) 0.45 (0.22–1.64) 1.08 (0.42–2.37)
0.52 (0.27–1.01) 1.56 (0.60–2.94) 4.80 (1.20–14.6)
1.76 (0.93–4.33) 0.36 (0.07–1.15) 0.20 (0.13–0.41)
Data are median (range).
JID 2000;182 (August)
Virus-Induced CD81 T Cell Differentiation
453
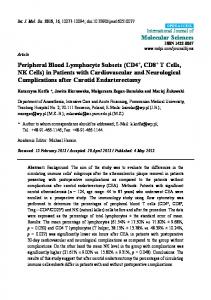
Figure 1. CD81 cell subset distribution and Ki-67 expression in lymphocytes of a healthy control and a subject with acute Epstein-Barr virus (EBV) infection. A, Distribution and percentages of the CD45RO/CD27 and CD27/CD28 subpopulations among the total CD81 T cell population. B, Staining for the intracellular antigen Ki-67 in CD81 T cells. Values were 1% in the healthy control and 34% in the patient with acute EBV infection. C, Distribution of Ki-671 cells (in black) in the total cell population (in gray). Percentages of Ki-671 cells in the subsets are presented.
ratios (table 1). The increase in CD81 T cells was caused mainly by an expansion of CD45RO1CD271 cells and, to a lesser extent, by expansion of CD45RO1CD272 cells (table 2, figure 1). The CD45RO2 subset did not increase substantially, although the increase in CD45RO2CD271 cells just reached significance in acute EBV infection. The Ki-67 antigen was expressed mainly in the CD45RO1 subsets. Within the CD45RO2 subsets, the naive cells showed a variable but overall low expression of Ki-67, whereas in CD45RO2CD272 effector-type cells the Ki-67 antigen was hardly demonstrable, except in 1 patient with EBV infection. Several reports have documented expansion of the CD81 CD45RO1CD282 T cells during viral infections. These cells are present in low numbers in healthy individuals. To investigate the relationship between this population, which has several effector cell–type properties, and the above-defined subsets, the expression of CD28, in relation to CD27, on CD81 T cells was also analyzed. In healthy controls, expression of CD27 and CD28 appears to be closely linked, resulting in very low CD271 CD282 and CD272CD281 cell numbers (table 3, figure 1). The acute stage of viral infection was characterized by a considerable expansion of CD271CD281 cells, but most striking was the augmentation of the CD271CD282 subset. In HIV-1 infection, there was a moderate increase in the number of CD272CD282 cells, whereas in EBV infection this fraction was
more markedly increased. All fractions displayed an increase in Ki-67 expression. Perforin expression in CD27 and CD28 subsets in acute viral infection. CTLs contain granules in the cytoplasm that hold several proteolytic enzymes, including perforin and granzymes A and B, which play an important role in the cytotoxic activity of CTLs. As reported elsewhere [11], CD81CD45RO2CD272 cells are unique in that they, without additional stimulation in vitro, contain high levels of both proteolytic enzymes. In healthy controls, perforin expression was virtually absent in the CD271CD281 subset, intermediately present in the CD271 CD282 subset, and primarily present in the CD272CD282 fraction (table 4). In the acute stage of HIV-1 infection, although the number of cells in the different subsets clearly increased, the proportion of perforin-positive cells in these subpopulations still was comparable to that in healthy controls. In acute EBV infection, the proportion of perforin-positive cells in the subsets that are CD271 seemed to be higher than the proportion found in acute HIV infection. However, in each group, only 4 patients were tested and there was a considerable overlap, so the differences failed to reach statistical significance. Cytotoxic capacity in acute EBV infection. Because the proportion of perforin-positive cells in the different subsets during acute EBV infection were increased, we addressed the question of whether these cells behave as CTLs ex vivo. Cytotoxic capacity
454
Roos et al.
JID 2000;182 (August)
Table 2. Percentages and absolute numbers of CD81 subsets defined by CD45RO and CD27 cells and percentage of Ki-67 expression in each subset in healthy controls and patients with acute human immunodeficiency virus (HIV)–1 or Epstein-Barr virus (EBV) infection. Study group a
b
Controls 1
CD8 cell subset CD45RO2CD271 Ki-67 CD45RO1CD271 Ki-67 CD45RO1CD272 Ki-67 CD45RO2CD272 Ki-67
Percentage (naive cells) (memory cells) (memory/effector cells) (effector cells)
52 1 33 2 3
(14–74) (0–14) (5–59) (0–6) (1–34) NA 11.5 (3–48) 1 (0–6)
c
HIV-1
Absolute no. 310 /L 9
0.23 (0.05–0.55) 0.13 (0.03–0.39) 0.02 (0.01–0.11) 0.04 (0.01–0.20)
Percentage 21 5 61 32 9 25 8 2
(3–35) (1–26) (26–79) (16–69) (0–20) (11–59) (2–28) (0–14)
EBV
Absolute no. 310 /L 9
0.30 (0.05–0.59) e
0.98 (0.23–2.06) f
0.09 (0–0.46)
0.10 (0.03–0.38)
Percentage 10 16 63 40 14 39 2 6
(3–24) (0–42) (25–90) (7–57) (2–68) (18–58) (1–10) (2–56)
Absolute no. 3109/L d
0.44 (0.12–2.63) f
3.32 (1.62–9.2)
f
1.32 (0.05–6.09)
0.10 (0.03–1.46)
NOTE. Data are median (range). NA, not available because of a very low no. of events. a 20 Subjects tested for absolute no. of subsets/20 tested for Ki-67 expression in each subset. b 17 Subjects tested for absolute no. of subsets/10 tested for Ki-67 expression in each subset. c 13 Subjects tested for absolute no. of subsets/7 tested for Ki-67 expression in each subset. d Comparison of acute stage vs. controls, P ! .05, by Wilcoxon rank sum test. e Comparison of acute stage vs. controls, P ! .001, by Wilcoxon rank sum test. f Comparison of acute stage vs. controls, P ! .003, by Wilcoxon rank sum test.
in freshly purified CD81 subsets is shown in a CD3 MAb–mediated redirected cytotoxicity assay. As expected, in a healthy control, cytolytic activity was found predominantly in the CD272CD282 subset (figure 2A). In agreement with the presence of perforin in the subsets of the patient with acute EBV infection, cytotoxic capacity already could be found in the CD271CD281 subpopulation at about a factor 2 level lower than that in the CD271CD282 and the CD272CD282 fractions (figure 2B). Enumeration of T cells specific for EBV by using MHC-peptide tetrameric complexes. We next analyzed the frequency of T cells specific for the EBV peptide RAKFKQLL, which was derived from the lytic protein BZLF1, using HLA-B8/peptide tetrameric complexes. In healthy-HLA-B8–positive-EBV-seronegative controls, T cells specific for this peptide are virtually absent [28]. Frequencies of antigen-specific T cells were measured for 3 HLA-B8–positive patients with acute EBV infection. Figure 3B shows that almost all tetramer-positive cells reside in the CD45RO1 population, with equal proportions in the CD271 and CD272 subsets. Figure 3C shows again that CD272CD281 subpopulations are nearly absent, whereas the numbers of CD272CD282 cells are very low. From figure 3D, it is clear that the highest proportion of antigen-specific cells can be found in the CD271CD282 subpopulation. It has been suggested that the expansion of CD81 T cells in various acute viral infections may be wholly accounted for by antigen-specific T cells, and a possible role for bystander cells may have to be rethought [10]. Assuming that the expansion of the CD271CD282 subpopulation was due only to antigenspecific cells, then in patient 1 the proportion of antigen-reactive cells in this subpopulation that were recognized by this tetrameric staining was 35% of all EBV antigen–specific cells (figure 3D). By extrapolation, this may imply that only 35% of this patient’s EBV-specific cells are recognized by this tetramer (i.e., that the real proportion of EBV-specific cells is a factor 100/
35 greater than that determined by tetrameric staining). In patient 1, the tetramer-positive cells amounted to 31% of CD81 cells. This means that the real proportion of EBV-positive cells in this patient was 100/35 3 31% p 88.6% of CD81 cells. From that calculation, it can be determined that 11.4% of the cells are not involved in the immune response against EBV (i.e., 0.114 3 14.6 3 10 9/L p 1.66 3 10 9 cells/L. The same calculations for patients 2 and 3 revealed that 1.29 3 10 9/L and 0.56 3 10 9/L, respectively, of the CD81 T cells were not involved in the EBV-specific T cell response. CD81 T cell numbers not involved in EBV are close to the normal range of the number of CD81 T cells in healthy individuals, which suggests that the expansion is EBV specific and leaves a constant pool of CD81 T cells uncommitted. Discussion In this study, we documented changes in circulating CD81 subsets induced by acute HIV-1 or EBV infection. The most striking findings are that (1) CD81 lymphocytosis, a well-known and common finding in these acute viral infections, is caused by a dramatic expansion of memory-type CD45RO1CD271 T cells; (2) in virus-infected individuals, the CD271CD282 population within the CD81 memory-type subset expands considerably; (3) the high percentage of Ki-671 cells in both memory CD271CD281 and CD271CD282 subpopulations demonstrates that, compared with cells in healthy controls, a great deal of these cells are cycling; (4) in the acute stage, many CD81 T cells contain perforin and have a high cytolytic capacity in a redirected assay; and (5) during the acute stage, large numbers of antigen-specific T cells, detected by MHC-peptide tetrameric complexes, reside in the memory-type fraction (CD45RO1 CD271); however, the percentage of tetrameric-positive cells is ∼2 times higher in the CD271CD282 fraction than in the CD271 CD281 fraction.
JID 2000;182 (August)
Virus-Induced CD81 T Cell Differentiation
455
ligand for CD27, a member of the TNF-R family, is CD70. After binding its ligand, CD27 provides a costimulatory signal for T cell proliferation and cytokine production [31]. Next, CD27 is down-regulated, and the complete and irreversible loss of this molecule may mark terminal T cell differentiation [32]. It can be argued that down-regulation of costimulatory molecules could be instrumental in determining the balance between the proliferating memory pool and the nonproliferating effector pool [33]. In another study, we evaluated the correlation between both measurements of naive and memory CD81 T cells in 122 samples from healthy controls and HIV-1–infected individuals. CD81 T cell subsets co-expressing CD45RA and either CD62L or CD27 were regarded as truly naive cells, whereas remaining CD81 T cells, including cells expressing CD45RO and cells expressing CD45RA without CD62L or CD27, were regarded as memory lymphocytes. A good correlation existed between both methods for the enumeration of naive CD81 T cells (ratio Pearsson [Rp], 0.96; P ! .005) and memory CD81 T cells, (Rp, 0.98; P ! .005), and the differences did not systematically vary over the range of measurements [34]. By using these definitions, the expansion of CD81 T cells in acutely virally infected patients occurs mainly in the CD45RO1CD271 memory-type cells. In acutely HIV-1–infected persons, the emergence of CD81CD282 T cells has been demonstrated [23–26]. Experiments in vitro showed that CD81CD282 cells are derived from CD81CD281 precursors [35]. We analyzed the combined expression of CD27 and CD28. At birth, virtually all peripheral CD81 T cells express both CD27 and CD28 [11, 36–38]. We found that healthy human adults accumulate CD272CD282 T cells, whereas the other 2 subsets remain very low. Therefore, it is remarkable that, during acute viral infection, the CD271 Figure 2. Cytotoxic capacity of CD81 T cell subsets in a CD3 monoclonal antibody–mediated, redirected cytotoxicity assay. Data are for a healthy control (A) and a patient with acute Epstein-Barr virus (EBV) infection (B). Fractions tested in the control were CD81 (v), CD81CD271CD281 (m), and CD81CD272CD282 (m) cells. Perforin values for these subsets were 21%, 7%, and 55%, respectively. In the patient with acute EBV infection, fractions tested were CD81CD271CD281 (m), CD81CD271CD282 (.), and CD81CD272 CD282 (m) cells. Perforin values for these subsets were 25%, 27%, and 53%, respectively.
Several reports that used only the CD45RA/RO definition of naive and memory cells have documented that the increase in CD81 cells during the acute stage of EBV and HIV-1 infection occurs mainly in the memory population [16, 17]; however, the validity of CD45RO/RA markers alone for the distinction between naive and memory cells has been questioned [11, 29, 30]. The use of a combination of CD45RA and CD62L has been proposed for a more refined distinction of naive, memory, and effector cells [29]. Mainly for practical reasons, we advocated the combined use of CD45RA and CD27 cells [11]. The
Table 3. Absolute numbers of CD81 subsets defined by CD27 and CD28 monoclonal antibodies, and percentage of Ki-67 expression in healthy controls and in patients with acute human immunodeficiency virus (HIV)–1 or Epstein-Barr virus (EBV) infection. Study group Subset CD271CD281 Ki-67 CD271CD282 Ki-67 CD272CD281 Ki-67 CD272CD282 Ki-67
a
Controls
0.35 (0.11–0.90) 1 (0–22) 0.045 (0.02–0.08) NA 0.01 (0–0.05) NA 0.06 (0.02–0.28) 2 (0–7)
b
c
HIV-1
EBV d
0.89 (0.26–1.53) 29 (14–48) f 0.45 (0.15–1.09) 20 (6–62) 0.02 (0–0.11) NA d 0.19 (0.09–0.68) 11 (3–64)
e
2.70 (0.66–8.76) 35 (6–51) e 1.03 (0.42–3.16) 26 (3–62) g 0.29 (0–1.34) NA e 0.60 (0.10–4.12) 23 (1–60)
NOTE. Data for subsets are median (range) 3109/L; data for Ki-67 are median (range) percentage of expression in each subset. NA, not available because of a very low number of events. a 22 Subjects tested for absolute no. of subsets/19 tested for Ki-67 expression. b 17 Subjects tested for absolute no. of subsets/11 tested for Ki-67 expression. c 14 Subjects tested for absolute no. of subsets/8 tested for Ki-67 expression. d Comparison of acute stage vs. controls, P ! .005, Wilcoxon rank sum test. e Comparison of acute stage vs. controls, P ! .003, Wilcoxon rank sum test. f Comparison of acute stage vs. controls, P ! .001, Wilcoxon rank sum test. g Comparison of acute stage vs. controls, P ! .02, Wilcoxon rank sum test.
456
Roos et al.
JID 2000;182 (August)
Figure 3. HLA-B8/RAKFKQLL–specific cells in 3 patients with acute Epstein-Barr virus (EBV) infection. Distribution and percentage of CD45RO/CD27 (A) and CD27/CD28 (C) subpopulations are presented among the total CD81 T cell population. Distribution and percentage of tetramer-positive cells are shown (in black) among the CD45RO/CD27 (B) and CD27/CD28 (D) cell populations (in grey).
CD282 subpopulation emerges. In 3 patients with acute EBV infection, this cell population contains the highest percentage of antigen-specific cells, as determined by tetrameric staining. It has been proposed that antigen-specific T cells could be wholly accountable for the expansion of CD81 T cells in various acute viral infections [10, 39, 40]. For this reason, it can be argued that virtually all cells in the CD271CD282 fraction are antigen specific and that the CD271CD281 population contains both antigen-specific cells and cells not involved in the ongoing immune response. On the basis of these assumptions, the number of cells not involved in EBV responses could be calculated and appeared to be within the range of CD81 T cells found in normal donors. This would mean that the expanded CD81 T cell population is EBV specific and has little bystander components and that there remains a constant pool of uncommitted CD81 T cells. It is not possible to label cells in patients and follow them
over time. Nevertheless, we believe that it is defensible to integrate the observations that we made during acute viral infection into a model for CD81 T cell differentiation in vivo [33]. Viral antigens will induce activation of naive (CD45RO2 CD271CD281) T cells that convert into the CD45RO1CD271 CD281 phenotype [11]. Clonal expansion occurs within this subset, as evidenced by considerable expression of Ki-67. Differentiation toward the effector cell type is accompanied by the successive loss of CD28 and CD27 expression. Cells within this differentiation pathway gain perforin expression but gradually lose the capacity to proliferate as Ki-67 expression successively decreases (table 2). The absence of CD28 and, eventually, other costimulatory molecules probably renders these cells less able to undergo extensive clonal expansion and correlates well with the observation that the mitogenic potential of normal healthy control CD282 T cells in vitro is low [11, 25, 26, 41]. Since the
Virus-Induced CD81 T Cell Differentiation
JID 2000;182 (August)
Table 4. Absolute numbers of CD81 subsets defined by CD27 and CD28 monoclonal antibodies and percentage perforin in healthy controls and in patients with acute human immunodeficiency virus (HIV)–1 or Epstein-Barr virus (EBV) infection. Study group a
Subset 1
1
CD27 CD28 Perforin CD271CD282 Perforin CD272CD282 Perforin
b
c
Controls
HIV-1
EBV
0.36 (0.18–0.90) 1 (0–22) 0.04 (0.02–0.07) 20 (1–33) 0.06 (0.02–0.28) 67 (12–90)
0.90 (0.26–1.22) 7 (0–53) 0.34 (0.15–0.81) 26 (7–95) 0.19 (0.13–0.63) 75.5 (57–97)
1.20 (0.66–3.15) 60 (25–78) 0.74 (0.42–1.23) 87 (27–96) 0.14 (0.10–0.31) 92 (53–96)
NOTE. Data for subsets are median (range) 3109/L; data for perforin are percentage expression in each subset. a 11 Subjects tested for absolute no. of subsets/11 subjects tested for perforin expression in each subset. b 4 Subjects tested for absolute no. of subsets/4 subjects tested for perforin expression in each subset. c 4 Subjects tested for absolute no. of subsets/4 subjects tested for perforin expression in each subset.
regulation of CD45 isoform expression appears to be closely regulated by mitogenic T cell activation, this inability to cycle may well explain the reexpression of the CD45RA form on the most differentiated effector cells [11]. This model appears to be supported by recent studies in humans and animals, using tetrameric-MHC class I–peptide complexes [8, 9, 28, 42, 43]. For instance, in a study of humans with acute EBV infection, Callan et al. [28] found that most EBV-specific CD81 cells display the CD45RO1 phenotype and have variable CD28 expression [28]. Of importance, in recent studies, it also was demonstrated in asymptomatic EBV carriers that the proportion of antigen-specific T cells expressing CD45RA increases [30, 44]. During acute viral infection, the division time of the virus-specific CD81 T cells shortens substantially [39]. It is conceivable that the higher percentage of Ki-67–positive cells in the CD272CD282 subset in some patients can be explained by proliferating cells that are in the process of losing CD28 and CD27. Likewise, the expression of perforin in CD271CD281 cells may be explained by the fact that cytolytic mediators are among the genes that are rapidly induced in stimulated CD81 T cells [45]. In support of the notion that CD81CD45RA1CD272 T cells undergo substantial division before they become terminally differentiated, we recently found that the telomeric restriction fragment (TRF) length of this effector population is ∼0.5 kb shorter than that of the CD45RO1 memory-type cells and 2.3 5 1.0 kb shorter than that of the CD45RA1CD271 naive-type CD81 cells [46]. This agrees with other reports [35, 38, 47] and with studies that found that, in HIV-1 infection and after bone marrow transplantation, the CD81CD282 cells had a shorter TRF than that of the CD81CD281 cells [38, 48, 49]. This CD282 population overlaps to a large extent with the CD45RA2CD272 cells as they were defined in our present study. Persistence of these cells may be of importance in the initial eradication of virus-infected cells and on renewed infection or reactivation [1].
457
The present report shows part of the maturation and differentiation pathways that CD81 T lymphocytes may undergo during an acute viral infection. It seems that the acute response to HIV-1 does not differ substantially from the response against acute EBV infection. Whether this type of response is universal for all acute viral infections or is limited to infections in which the stage is in the lymphoid system itself has yet to be elucidated. This type of analysis may prove useful to more clearly define correlates of protective immunity not only in viral infection but also in immunization protocols aimed to generate antitumor or antiviral immunity. Acknowledgments We thank J. Prins (University of Amsterdam, Amsterdam, The Netherlands), F. Kroon (Leiden University Medical Center, Leiden, The Netherlands) and C. Delprat and P. Groeneveld (Sofia Hospital, Zwolle, The Netherlands) for providing the patient material. We thank A. J. McMichael and M. F. C. Callan (John Radcliffe Hospital, Oxford, United Kingdom) for providing the major histocompatibility complex–peptide tetrameric complexes and Linda Dekker, Tom Leenen, Anneke Meinesz, Berend Hooibrink, and Paul Baars (CLB, Amsterdam) for their help.
References 1. Ahmed R, Gray D. Immunological memory and protective immunity: understanding their relation. Science 1996; 272:54–60. 2. Zimmermann C, Brduscha-Riem K, Blaser C, Zinkernagel RM, Pircher H. Visualisation, characterisation, and turnover of CD81 memory T cells in virus-infected hosts. J Exp Med 1996; 183:1367–75. 3. McFarland HI, Nahill SR, Maciaszek JW, Welsh RM. CD11b (Mac-1): a marker for CD81 cytotoxic T cell activation and memory in virus infection. J Immunol 1992; 149:1326–33. 4. Andersson EC, Christensen JP, Marker O, Thomson AR. Changes in cell adhesion molecule expression on T cells associated with systemic virus infection. J Immunol 1994; 152:1237–45. 5. Christensen JP, Andersson EC, Scheynius A, Marker O, Thomsen AR. Alpha 4 integrin directs virus-activated CD81 T cells to sites of infection. J Immunol 1995; 154:5293–301. 6. Walker PR, Ohteki T, Lopez JA, MacDonald HR, Maryanski JL. Distinct phenotypes of antigen-selected CD8 T cells emerge at different stages of an in vivo immune response. J Immunol 1995; 155:3443–52. 7. Lalvani A, Brookes R, Hambleton S, Britton WJ, Hill AV, McMichael AJ. Rapid effector function in CD81 memory T cells. J Exp Med 1997; 186: 859–65. 8. Altman DJ, Moss PAH, Goulder PJR, et al. Phenotypic analysis of antigenspecific T lymphocytes. Science 1996; 274:94–6. 9. Wilson JDK, Ogg GS, Allen RL, et al. Oligoclonal expansions of CD81 T cells in chronic HIV infection are antigen specific. J Exp Med 1998; 188:785–90. 10. McMichael AJ, O’Callaghan CA. A new look at T cells. J Exp Med 1998; 187: 1367–71. 11. Hamann D, Baars PA, Rep MHG, et al. Phenotypic and functional separation of memory and effector human CD81 T cells. J Exp Med 1997; 186:1407–18. 12. Tosato G, Magrath I, Koski I, Dooley N, Blaese M. Activation of suppressor T cells during Epstein-Barr virus–induced infectious mononucleosis. N Engl J Med 1979; 301:1133–7. 13. De Waele M, Thielemans C, Van Camp BKG. Characterization of immunoregulatory T cells in EBV-induced infectious mononucleosis by monoclonal antibodies. N Engl J Med 1981; 304:460–2.
458
Roos et al.
14. Carney WP, Rubin RH, Hoffman RA, Hansen WP, Healey K, Hirsch MS. Analysis of T-lymphocyte subsets in cytomegalovirus mononucleosis. J Immunol 1981; 126:2114–6. 15. Roos MThL, Lange JMA, De Goede REY, et al. Viral phenotype and immune response in primary human immunodeficiency virus type 1 (HIV1) infection. J Infect Dis 1992; 165:427–32. 16. Cossarizza A, Ortolani C, Mussini C, et al. Massive activation of immune cells with an intact T cell repertoire in acute human immunodeficiency virus syndrome. J Infect Dis 1995; 172:105–12. 17. Lynne JE, Schmid I, Matud JL, et al. Major expansions of select CD81 subsets in acute Epstein-Barr virus infection: comparison with chronic human immunodeficiency virus disease. J Infect Dis 1998; 177:1083–7. 18. Kagi D, Vignaux F, Lederman B, et al. Fas and perforin pathways as major mechanisms of T-cell mediated cytotoxicity. Science 1994; 265:528–30. 19. Lowin B, Hahne M, Mattman C, Tschopp J. Cytolytic T-cell cytotoxicity is mediated through perforin and Fas lytic pathways. Nature 1994; 370:650–2. 20. Liu CC, Walsh CM, Young JDE. Perforin: structure and function. Immunol Today 1995; 16:194–201. 21. Gerdes J, Lemke H, Baisch H, Wacker HH, Schwab U, Stein H. Cell cycle analysis of a cell proliferation–associated human nuclear antigen defined by the monoclonal antibody Ki-67. J Immunol 1984; 133:1710–5. 22. Gerdes J, Schlueter LLC, Duchrow M, et al. Immunobiochemical and molecular biologic characterization of the cell proliferation–associated nuclear antigen that is defined by monoclonal antibody Ki-67. Am J Pathol 1991; 138: 867–73. 23. Gruters RA, Terpstra FG, De Goede REY, et al. Immunological and virological markers in individuals progressing from seroconversion to AIDS. AIDS 1991; 5:837–44. 24. Giorgi JV, Boumsell L, Autran B. Reactivity of workshop T-cell section MAb with circulating CD41 and CD81 T cells in HIV disease and following in vitro activation. In: Schlossman SF, ed. Leucocyte typing V. Oxford, UK: Oxford University Press, 1995:446–61. 25. Borthwick NJ, Bofill M, Gombert WM, et al. Lymphocyte activation in HIV1 infection. II. Functional defects of CD282 T cells. AIDS 1994; 8:431–41. 26. Brinchmann JE, Dobloug JH, Heger BH, Haaheim LL, Sannes M, Egeland T. Expression of costimulatory molecule CD28 on T cells in human immunodeficiency virus type 1 infection: functional and clinical correlations. J Infect Dis 1994; 169:730–8. 27. De Jong R, Brouwer M, Rebel VI, Van Seventer GA, Miedema F, Van Lier R. Generation of alloreactive cytolytic T lymphocytes by immobilized anti-CD3 monoclonal antibodies: analysis of requirements for human cytolytic T-lymphocytic differentiation. Immunology 1990; 70:357–64. 28. Callan MFC, Tan L, Annels N, et al. Direct visualization of antigen-specific CD81 T cells during the primary immune response to Epstein-Barr virus in vivo. J Exp Med 1998; 187:1395–402. 29. Roederer M, Gregson Dubs J, Anderson MT, Raju PA, Herzenberg LA, Herzenberg LA. CD8 naive T cell counts decrease progressively in HIVinfected adults. J Clin Invest 1995; 95:2061–6. 30. Tan LA, Gudgeon N, Annels N, et al. A re-evaluation of the frequency of CD81 T cells specific for EBV in healthy virus carriers. J Immunol 1999; 162:1827–35. 31. Hintzen RQ, Lens SMA, Lammers K, Kuiper H, Beckmann P, Van Lier RAW. Engagement of CD27 with its ligand provides a second signal for T-cell activation. J Immunol 1995; 154:2612–23.
JID 2000;182 (August)
32. Hintzen R, de Jong R, Lens SMA, Brouwer M, Baars P, Van Lier RAW. Regulation of CD27 expression on subsets of mature T lymphocytes. J Immunol 1993; 151:2426–35. 33. Hamann D, Roos MThL, Van Lier RAW. Faces and phases of human CD81 T cell development. Immunol Today 1999; 20:177–80. 34. Pakker NG, Kroon EDMB, Roos MTL, et al. Immune restoration does not invariably occur following long-term HIV-1 suppression during antiretroviral therapy. AIDS 1999; 13:203–12. 35. Posnett DN, Edinger JW, Manavalan JS, Irwin C, Marodon G. Differentiation of human CD8 T cells: implications for in vivo persistence of CD81CD282 cytotoxic effector clones. Int Immunol 1999; 11:229–41. 36. Fagnoni FF, Vescovini R, Mazzola M, et al. Expansion of CD81CD282 T cells in healthy ageing people, including centenarians. Immunology 1996; 88: 501–7. 37. Effros RB, Boucher N, Porter V, et al. Decline in CD281 T cells in centenarians and in long-term T cell cultures: a possible cause for both in vivo and in vitro immunosenescence. Exp Gerontol 1994; 29:601–9. 38. Nociari MM, Telford W, Russo C. Postthymic development of CD282CD81 T cell subset: age-associated expansion and shift from memory to naive phenotype. J Immunol 1999; 162:3327–35. 39. Murali-Krishna K, Altman JD, Suresh M, et al. Counting antigen-specific CD8 T cells: a reevaluation of bystander activation during viral infection. Immunity 1998; 8:177–87. 40. Wilson JDK, Ogg GS, Allen RL, et al. Direct visualization of HIV-1–specific cytotoxic T lymphocytes during primary infection. AIDS 2000; 14:225–33. 41. Azuma M, Phillips JH, Lanier LL. CD282 T lymphocytes: antigenic and functional properties. J Immunol 1993; 150:1147–59. 42. Kuroda MJ, Schmitz JE, Barouch DH, et al. Analysis of Gag-specific cytotoxic T lymphocytes in simian immunodeficiency virus–infected Rhesus monkeys by cell staining with a tetrameric major histocompatibility complex class I–peptide complex. J Exp Med 1998; 187:1373–81. 43. Gallimore A, Glithero A, Godkin A, et al. Induction and exhaustion of lymphocytic choriomeningitis virus–specific cytotoxic T lymphocytes visualized using soluble tetrameric major histocompatibility complex class I–peptide complexes. J Exp Med 1998; 187:1383–93. 44. Wills MR, Carmichael AJ, Mynard K, et al. The human cytotoxic Tlymphocyte (CTL) response to cytomegalovirus is dominated by structural protein pp65: frequency, specificity, and T-cell receptor usage of pp65specific CTL. J Virol 1996; 70:7569–79. 45. Jacob J, Baltimore D. Modelling T-cell memory by genetic marking of memory T cells in vivo. Nature 1999; 399:593–7. 46. Hamann D, Kostense S, Wolthers KC, et al. Evidence that human CD81 CD45RA1CD272 cells are induced by antigen and evolve through extensive rounds of division. Int Immunol 1999; 11:1027–33. 47. Rufer N, Brummerdorf TH, Kolvraa S, et al. Telomere fluorescence measurements in granulocytes and T lymphocyte subsets point to a high turnover of hematopoietic stem cells and memory T cells in early childhood. J Exp Med 1999; 190:157–67. 48. Effros RB, Allsopp RC, Chiu CP, et al. Shortened telomeres in the expanded CD282CD81 cell subset in HIV disease implicate replicative senescence in HIV pathogenesis. AIDS 1996; 10:F17–22. 49. Rufer N, Dragowska W, Thornbury G, Roosnek E, Lansdorp PM. Telomere length dynamics in human lymphocyte subpopulations measured by flow cytometry. Nat Biotechnol 1998; 16:743–7.