Gen. Physiol. Biophys. (2005), 24, 147—159
147
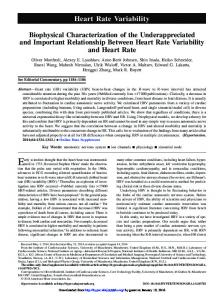
Changes in Ultraweak Photon Emission and Heart Rate Variability of Epinephrine-Injected Rats Y.-Z.Yoon1, J. Kim1 , B.-C. Lee1 , Y.-U. Kim2 , S. K. Lee2 and K.-S. Soh1 1 2
Biomedical Physics Laboratory 25-414, School of Physics, Seoul National University, Seoul, Republic of Korea. E-mail:
[email protected] College of Pharmacy and Research Institute of Pharmaceutical Sciences, Seoul National University, Seoul 151-742, Republic of Korea
Abstract. Ultraweak photons which are spontaneously emitted from a living body may be applicable as a non-invasive tool to characterize the physiological state of the living body. We investigated changes in the intensity of ultraweak photon emission, body temperature and the cardiovascular autonomic activity induced by epinephrine injection to rats. A high dose of epinephrine can make changes to the cardiovascular autonomic activity or body temperature. Photon emission of the dorsal part, rectal temperature and heart rate variability (HRV) were measured from eight Sprague-Dawley rats. The intensities of photon emissions for saline injections, which were used as a control, decreased from 13042 ± 71 counts/min at the start of measurements to 8709 ± 915 counts/min at 1 h after the injections. In the case with epinephrine injections, the intensity of photon emission reduced slowly from 13361 ± 354 counts/min to 11040 ± 433 counts/min. Rectal temperature increased in both saline- and epinephrine-injected rats, but one hour after the injections the temperature in the epinephrine case was slightly higher than that in the saline case. The standard deviation of the QRS wave complex interval (RR interval) increased from 1 to 4 (p < 0.05) and the spectral ratio of the low frequency component to the high frequency component in the HRV data LF (0.19 ∼ 0.74 Hz) / HF (0.78 ∼ 2.50 Hz) decreased from 0.81 to 0.26 (p < 0.05) in the case of epinephrine injection while no change was found in the case of saline injection. Thus, ultraweak photon emission was closely related to the cardiovascular autonomic activity. Key words: Ultraweak photon emission — Heart rate variability — Rectal temperature — Epinephrine — Rat
Correspondence to: Jungdae Kim, Biomedical Physics Laboratory 25-414, School of Physics, Seoul National University, Seoul 151-747, Republic of Korea E-mail:
[email protected]
148
Yoon et al.
Abbreviations: ECG, electrocardiogram; EEG, electroencephalogram; HRV, heart rate variability; QRS, combination of Q, R, and S wave; RR interval, time interval between the consecutive R waves in ECG signal; SDNN, standard deviation of the RR interval; RMSSD, root mean square of successive differences; PSD, power spectral density; LF, low frequency (0.19–0.74 Hz); HF, high frequency (0.78–2.50 Hz); PMT, photomultiplier tube. Introduction Intrinsic and endogenous photon emission from various biological systems such as cells, tissues, and animals has been investigated in recent years (van Wijk and van Aken 1991; Kobayashi et al. 1999; Voeikov et al. 1999; Kim et al. 2003). This photon emission was referred to as ultraweak photon emission because of its extremely weak intensity of a few up to several thousands of photons per second. Based on several experiments related to bio-photon communication (Albrecht-Buehler 1992; Popp et al. 1994; Shen et al. 1994), it was suggested that the central nervous system would be a good subject to study both photon communication/regulation and microtubular photon guidance (Grass et al. 2004). Neurons are large cells with wide arborization and have an active metabolism for photon emission. They also contain little pigment and are characterized by a prominent cytoskeleton consisting of hollow microtubules. On the other hand, it is known that cardiovascular autonomic activity relates to several centers controlled by a series of parallel pathways involving specific regions of the central nervous system extending from the cerebral cortex to the spinal cord (Spyer 1993; Dampney 1994). A correlation between electroencephalogram (EEG) and heart rate variability (HRV) in deep anesthesia has been proposed and an animal study has been designed to analyze simultaneously these two oscillatory signals (Troncoso et al. 1995). The HRV represents a fluctuation of the time interval between the consecutive beats in the ECG. In this circumstance, it is timely to investigate a correlation between the intensity of ultraweak photon emission and the HRV measurements through animal experiments. In this paper we report our experimental results that showed simultaneous changes in the photon emission intensity and the HRV measurements for rats. In order to make some changes in HRV, we injected epinephrine into rats and measured the photon emission, electrocardiogram (ECG), as well as the rectal temperature. Materials and Methods Animal preparation Male Sprague–Dawley rats (Hanlym Lab. Animal Co., Korea) between 240 and 260 g body weight were maintained on a 12 : 12 h light : dark cycle with diet and water available ad libitum. All animals were handled in accordance with National
Ultraweak Photon Emission and HRV of Epinephrine-Injected Rats
149
Institute of Health Guidelines for the humane care of laboratory animals. In order to detect ultraweak photon emissions from the rats, we used a photomultiplier tube (PMT, H6180-01, Hamamatsu, Japan) and associated data acquisition systems. The minimum photosensitive area of the PMT was 15 mm diameter and the sensitive wavelength range was from 300 nm to 650 nm. The peak response at 400 nm is 3.2 × 10⁵ cps/pW. A special dark box (70 × 90 × 500 mm3 ) was designed for the elimination of unnecessary background noise and for the detection of photons from the rat. Before each measurement the sympathomimetic drug was prepared in such a way that an ampule of 0.75 ml epinephrine (1 mg/ml, Daihan Pharm. Korea) was mixed with 0.75 ml saline. Ketamine (150 mg/kg, i.p.) was used in our experiment to anesthetize rats. For the administration of epinephrine, a 24-gauge catheter (Dukwoo Medical, Korea) was injected into the ventral part of the rats. Epinephrine was intraperitoneally injected into the rats at a speed of 1 ml/min. For measurement of an untreated rat, 1.50 ml saline was injected in the same way for the purpose of obtaining control data. Three metal needles were used for our ECG sensors. Two needles were injected into the front limbs of an anesthetized rat and the third one was injected into the left leg of the rat. For measuring rectal temperature, we used a K-type thermocouple. After the setup of the catheter, the ECG needles and the thermocouple, the rat was moved into a dark box for the measurement of photon emissions. The position of the PMT was above the dorsal part which is 10 cm from the head of the rat. The height between the PMT and the dorsal part was 5 cm. The electric wires from the ECG needles and the thermocouple were connected into the signal amplifiers and the analog/digital converter which were outside the dark box. A small plastic pipe was connected between the catheter and the syringe for the drug administration. Experiments were performed in a dark room in which the dark box was contained. After 10 min control period inside the dark box, the drug was injected for 2 min. After that all the signal measurements were continued for an hour. The experiments were done during day time (10 o’clock – 18 o’clock). The room temperature during the experiments was kept constant between 21 and 23 ◦C. Data acquisition and analysis The ECG signal was transferred to the amplifiers (National Instruments, SCXI1000, SCXI 1125, USA) and the A/D converter (National Instruments, DAQ-AI16XE-50, USA). The sampling rate for the ECG was 1000 Hz and the time resolution for the RR intervals (time interval between the consecutive R waves in ECG signal) was 1 ms. The ECG signal was saved on a personal computer every 5 min. The ECG is characterized by a recurrent sequence of five principal waves, denoted by P, Q, R, S and T. QRS complex is a combination of the Q, R and S waves. After QRS peak detection by the method described in Pan and Tomkins (1985) and Nagin and Selishchev (2001), a time series of RR intervals was obtained. For the analysis of HRV, several Fortran programs were implemented. The time domain analysis was made by the calculation of statistical properties such as
150
Yoon et al.
the mean of the RR interval, the standard deviation of the RR interval (SDNN), and the root mean square of successive differences (RMSSD) of the RR intervals. The frequency domain analysis was made by cubic spline function curve fitting to the data of the RR intervals, re-sampling at 0.1 s, followed by power spectral density (PSD) analysis. There were two kinds of method for the PSD analysis which were classified as nonparametric and parametric. The advantages and disadvantages of the two methods were described well in Task force of the European Society of Cardiology and the North American Society of Pacing Electrophysiology (1996) and Balocchi et al. (2000). In most instances, both methods provide comparable results. We used the parametric method of the autoregressive model with order 12. The relevant computer algorithm can be obtained from Press et al. (1992). The ratios of low frequency to high frequency (LF/HF) components of power spectral densities were calculated from the power spectral analysis. The ranges of LF and HF were taken as 0.19 ∼ 0.74 Hz and 0.78 ∼ 2.50 Hz, respectively. Paired Student’s t-tests were used to compare the data before and after the injection, and the corresponding one-tail p-values for each HRV measurement were also presented.
Figure 1. Changes in ultraweak photon emissions of saline- and epinephrine-injected rats. The photon emissions were presented in counts per minute over the whole experimental time period. 10 min after the start of measurement (0 min in the figures) 2 ml saline and 2 ml epinephrine (0.5 mg/ml) were injected for 2 min intraperitoneally using a catheter. Afterwards, the photon emissions for a rat from the dorsal part were continuously measured for an hour. Data points represent the mean ± S.D. which were calculated from the results of four rats for each treatment. Comparisons of photon emission between the saline and epinephrine were made by unpaired t-test. * p < 0.05.
Ultraweak Photon Emission and HRV of Epinephrine-Injected Rats
151
Results The changes in ultraweak photon emissions of saline- and epinephrine-injected rats are shown in Fig. 1. The photon emissions are presented in counts per min over the whole experimental time periods which were composed of a 10-min dark adaptation period, a 2-min injection time and a 1-h measurement period afterwards. Data points represent the mean ± SD which were calculated from the results of four rats for each treatment. In the saline case, the intensity of photon emission continuously decreased from 13,000 counts/min at the start to 8700 counts/min 1 h after. This time course of photon emission was similar to several cases when the anesthetized rats were left in the dark box without any saline injection for an hour. In the epinephrine case, the intensity of photon emission showed a slow decrease and a slight increase 30 min afterwards. Clear distinctions were evident within 50 min. The measurements of rectal temperature were made simultaneously and the signals for rectal temperature were transferred and calibrated in units of degrees Celsius. As shown in Fig. 2, the changes in rectal temperatures were seen to occur in completely different patterns from those of photon emission. The rectal temperature increased just after both saline and epinephrine injections. Their patterns of increase were almost identical for the two cases. At 60 min, however, it eventually showed a discrepancy in the rectal temperature. We analyzed the data for the correlation between the rectal temperature and
Figure 2. Changes in rectal temperatures of saline- and epinephrine-injected rats. In the same conditions as described in Fig. 1, the signal for rectal temperature was transferred and calibrated in units of degrees Celsius. Comparisons of rectal temperature between the saline and epinephrine were made by unpaired t-test. * p < 0.05.
152
Yoon et al. 250 200 150 100 50
Rat1 0
10
20
30
40
50
60
Peak RR intervals (ms)
250 200 150 100 50
70
Rat2 0
10
20
30
40
50
60
250 200 150 100 50
70
Rat3 0
10
20
30
40
50
60
250 200 150 100 50
70
Rat4 0
10
20
30
40
50
60
70
Time (min)
Figure 3. Peak RR intervals during the whole time period of the saline-treated measurements. Four rats (Rat1, 2, 3, 4) were used and 1.5 ml saline for each rat was injected. ECG signals were measured at 1000 Hz sampling rate and RR intervals were calculated by the QRS complex detection.
photon emission by the nonparametric correlation method. There was no correlation between them in the case of saline injection (the nonparametric correlation coefficient, Spearman r = −0.45; two-tailed p-value = 0.268). However, significant correlation between the temperature and photon emission was shown in the case of epinephrine injection (Spearman r = −0.76 and two-tailed p-value = 0.037). With the ECG signals, we could obtain the RR intervals for HRV measurements during the whole time period of the saline-treated measurement as shown in Fig. 3. Four rats (Rat1, 2, 3, 4) were used and 1.5 ml saline for each rat was injected. We could see that the patterns of RR intervals were more or less uniform over the whole experimental time period. In Fig. 4, the RR intervals during the whole time period of the epinephrine-treated measurement are also presented, which were measured with four rats (Rat5, 6, 7, 8) injected with 1.5 ml epinephrine. Visible changes in the RR intervals occurred at about 20 min after the drug injection and their response times were not as rapid as shown in the case of rectal temperature. In Fig. 5, the PSD for a 5-min time period of RR interval variability data for saline injection are presented. The solid line is for the control time period (5–10
Ultraweak Photon Emission and HRV of Epinephrine-Injected Rats
153
250 200 150 100 50
Rat5 0
10
20
30
40
50
60
Peak RR intervals (ms)
250 200 150 100 50
70
Rat6 0
10
20
30
40
50
60
250 200 150 100 50
70
Rat7 0
10
20
30
40
50
60
250 200 150 100 50
70
Rat8 0
10
20
30
40
50
60
70
Time (min)
Figure 4. Peak RR intervals during the whole time period of the epinephrine-treated measurements. Four rats (Rat5, 6, 7, 8) were used and 1.5 ml epinephrine was injected for each rat.
min) before the injection of 1.5 ml saline. The dotted line is for the time period (50–55 min) after the injection of saline. Fig. 6 presents the PSD for a 5-min time period of RR interval variability data for epinephrine injections. The solid line is for the control time period (5–10 min) before the injection of 1.5 ml epinephrine (0.5 mg/ml). The dotted line is for the time period (50–55 min) after the injection of epinephrine. Overall values for the PSD of epinephrine showed variations from the PSD values for the control time periods larger than those for the corresponding variations in the saline case. Fig. 7 shows LF/HF values of saline- and epinephrineinjected rats as the measurement time elapsed. The LF/HF decreased drastically after the epinephrine injections. We presented the time courses of photon emission due to the ephinephrine injection subtracted by the saline effect and the LF/HF simultaneously in Fig. 8. In Table 1, we present various HRV measurements of the data before and after the treatment with saline and epinephrine injections into eight rats. Paired t-tests were used to compare the data before and after the injection, and the corresponding one-tail p-values for each HRV measurement are presented in the columns for “After injection”. Table 1 shows an increase in RMSSD (p = 0.01) due to the saline injection. RMSSD was known to be an estimate of short-term components of HRV
154
Yoon et al. 10 8
2
PSD (ms /Hz)
10
control saline
6
6
4
4
2
Rat1
2
0 1
100
2
3
4
5
0
6
40
4 Rat3
2
3
2
0
4
5
control saline
8
60
20
1
10
control saline
80 2
Rat2
0 0
PSD (ms /Hz)
control saline
8
Rat4
0 0
1
2 3 Frequence (Hz)
4
5
0
1
2 3 Frequence (Hz)
4
5
Figure 5. PSD for a 5-min time period of RR interval variability data for saline injections. The solid line is for the control time period (5–10 min) before the injection of 1.5 ml saline. The dotted line is for the time period (50–55 min) after the injection of saline. PSD was obtained using a parametric method on an autoregressive model with order 12.
and this was compatible with the slight increase in LF/HF from 0.50 to 0.54. In the case of epinephrine, the SDNN which was a typical index for the estimate of overall HRV increased from 4 to 9 ms. The LF/HF value decreased drastically from 0.81 to 0.26 following the drug injection. Discussion The assessment of HRV is used to evaluate the dynamic features of the cardiovascular control mechanism (Parati and Di Rienzo 2003). Through the comprehensive and functional analysis of HRV, one can explore the functioning of the living body reliably and non-invasively (Pumprla et al. 2002). Many experimental and clinical studies were carried out with animals (Japundizic et al. 1990; Nijsen et al. 1998; Aubert et al. 1999) and humans (Goldberger 1999; Nascente and Moreira 2002; Stauss 2003; Gussak et al. 2004). The relation between autonomic control of heart rate and EEG activity has been proposed for some clinical situations (Yli-Hankala et al. 1990) and combined analyses of ECG and EEG were made simultaneously in
Ultraweak Photon Emission and HRV of Epinephrine-Injected Rats 100
control Epinephrine
150
60 100 40 50
Rat5
20
0 1
100
2
3
4
5
0
1
300
control Epinephrine
80 2
Rat6
0 0
PSD (ms /Hz)
control Epinephrine
80
2
PSD (ms /Hz)
200
155
2
3
4
5
control Epinephrine
250 200
60
150 40
100
20
Rat7
50
0
Rat8
0 0
1
2 3 Frequence (Hz)
4
5
0
1
2 3 Frequence (Hz)
4
5
Figure 6. PSD for a 5-min time period of RR interval variability data for epinephrine injections. The solid line is for the control time period (5–10 min) before the injection of 1.5 ml epinephrine (0.5 mg/ml). The dotted line is for the time period (50–55 min) after the injection of epinephrine.
order to quantify HRV and the cortical EEG in response to light onset in awakening rats. The concurrent spectral analysis was suggested as a test of the integral reactivity of the nervous system. It is known that LF/HF of HRV data represents an index of the sympathovagal balance (Malliani et al. 1991; Muzi and Ebert 1993). Our experimental results showed that changes induced by epinephrine injection in the HRV parameters could be interpreted as a higher increase in the vagal than the sympathetic activity. This is contrary to the changes in the HRV parameters which were induced by light onset (Troncoso et al. 1995). LF oscillations are due to both vagal and sympathetic input to the heart. HF components are induced by fluctuations in cardiac-vagal input and they correspond to respiratory sinus arrhythmia controlled by medullary vagal centres, carotid-aortic baroreceptors and atrium stretch receptors (Akselrod et al. 1981). If a close connection exists between the autonomic control of HRV and the subcortical sources of EEG, different physiological stimuli that induce a change in one of them could also change the other. In Fig. 8, we present changes in emitted ultraweak photon intensity of epinephrine-injected rats subtracted by
156
Yoon et al.
Figure 7. Changes in the LF/HF of saline- and epinephrine-injected rats. Comparisons of the LF/HF between the saline and epinephrine were made by unpaired t-test. * p < 0.05, ** p < 0.01, *** p < 0.001.
Figure 8. Changes in ultraweak photon emission intensities induced by epinephrine injections and the corresponding changes in LF/HF for epinephrine-injected rats. The intensities of photon emission were obtained by subtracting the saline injection data from the epinephrine injection data. LF/HF for the saline-injected rats had uniform values 0.50 ± 0.04 and the change in LF/HF was produced by epinephrine injection. Significant correlation between the LF/HF and photon emission (epinephrine-saline) was shown in the case of epinephrine injection (Spearman r = –0.94, two-tailed p-value = 0.017).
Subject
Rat1 Rat2 Rat3 Rat4 Mean ± SD p-value Rat5 Rat6 Rat7 Rat8 Mean ± SD p-value
Treatment
Saline
Epinephrine
Before injection (5–10 min) SDNN RMSSD LF/HF (ms) (ms) 2 12 0.43 3 26 0.67 4 12 0.43 2 6 0.47 3±1 14 ± 7 0.50 ± 0.10 Paired t-test: before and after saline injections 168 4 20 0.72 143 4 19 1.23 134 2 15 0.87 136 5 18 0.40 145 ± 14 4±1 18 ± 2 0.81 ± 0.34 Paired t-test: before and after epinephrine injections RR (ms) 136 174 187 167 166 ± 19
170 177 144 128 155 ± 20 0.18
RR (ms) 150 185 210 163 177 ± 23 0.07 6 15 7 7 9±4 0.04
21 17 38 17 23 ± 9 0.22
0.08 0.53 0.40 0.03 0.26 ± 0.21 0.003
After injection (50–55 min) SDNN RMSSD LF/HF (ms) (ms) 4 21 0.39 2 29 0.66 5 21 0.34 3 17 0.76 4±1 22 ± 4 0.54 ± 0.18 0.16 0.01 0.35
Table 1. Various HRV measurements of the data before and after the treatment with saline and epinephrine injections into eight rats. Paired t-tests were used to compare the data from before and after the injection, and the corresponding one-tail p-values for each HRV measurement are presented in the columns for “After injection”
Ultraweak Photon Emission and HRV of Epinephrine-Injected Rats 157
158
Yoon et al.
those of saline-injected rats, and also plotted the corresponding changes in LF/HF of epinephrine-injected rats. LF/HF for the saline-injected rats had uniform values 0.50 ± 0.04 and the change of LF/HF was mainly produced by epinephrine injection. The graph showed a tendency of anti-correlation between the photon emission and LF/HF. In this study, we simultaneously measured the intensity of photon emission and HRV of rats which were injected with saline and epinephrine. If the ultraweak photon emission induced by the drug injection is involved in a change in the physiology of the central nervous system, it is most probable that the change in EEG goes with a change in HRV. A further investigation on spectrum distribution of the emitted light will be necessary for complete understanding about the source of photon emission at the molecular level. Acknowledgements. This work was supported in part by grants: R01-2001-000-00023-0 from the Korea Science and Engineering Foundation, ITEP (A19-02-03) from the Ministry of Commerce, Industry and Energy, NRL (M1-0302-00-0007) from the Ministry of Science & Technology, and the BK21 program of the Korea Research Foundation.
References Akselrod S., Gordon D., Ubel F. A., Shannon D. S., Barger A. C., Cohen R. J. (1981): Power spectrum analysis of heart rate fluctuations: A quantitative probe of beatto-beat cardiovascular control. Science 213, 220—222 Albrecht-Buehler G. (1992): Rudimentary form of cellular vision. Proc. Natl. Acad. Sci. U.S.A. 89, 8288—8292 Aubert A., Ramaekers D., Becker F., Breem R., Benef C., Van de Werf F., Ector H. (1999): The analysis of heart rate variability in unrestrained rats: Validation of method and results. Comput. Methods. Programs Biomed. 60, 197—213 Balocchi R., Di Garbo A., Michelassi C., Chillemi S., Varanini M., Barbi M., Legramante J. M., Raimondi G., Zbilut J. P. (2000): Heart rate and blood pressure response to short-term head-down bed rest: a nonlinear approach. Methods Inf. Med. 39, 157—159 Dampney R. A. L. (1994): Functional organization of central pathways regulating the cardiovascular system. Physiol. Rev. 74, 323—364 Goldberger J. J. (1999): Sympathovagal balance: how should we measure it? Am. J. Physiol., Heart Circ. Physiol. 276, H1273—1280 Grass F., Klima H., Kasper S. (2004): Biophotons, microtubules and CNS, is our brain a “Holographic computer”? Medical Hypotheses 62, 169—172 Gussak I., Litwin J., Kleiman R., Grisanti S., Morganroth J. (2004): Drug-induced cardiac toxicity: emphasizing the role of electrocardiography in clinical research and drug development. J. Electrocardiol. 37, 19—24 Japundzic N., Grichois M. L., Zitoun P., Laude D., Elghozi J. L. (1990): Spectral analysis of blood pressure and heart rate in conscious rats: effects of autonomic blockers. J. Auton. Nerv. Syst. 30, 91—100 Kim J., Lim J., Sung B., Soh K. (2003): Biophoton emission from rat liver. J. Korean Phys. Soc. 42, 427—430 Kobayashi M., Takeda M., Sato T., Yamazaki Y., Kaneko K., Ito K., Kato H., Inaba H. (1999): In vivo imaging of spontaneous ultraweak photon emission from a rat’s brain correlated with cerebral energy metabolism and oxidative stress. Neurosci. Res. 34, 103—113
Ultraweak Photon Emission and HRV of Epinephrine-Injected Rats
159
Malliani A., Pagani M., Lombardi F., Cerutti S. (1991) Cardiovascular neural regulation explored in the frequency domain. Circulation 84, 482—492 Muzi M., Ebert T. J. (1993): Quantification of heart rate variability with power spectral analysis. Curr. Opin. Anaesthesiol. 6, 3—17 Nagin V. A., Selishchev S. V. (2001): Implementation of algorithms for identification of QRS-complexes in real-time ECG systems. Biomed. Eng. 35, 304—309 Nascente C. M., Moreira H. G. (2002): Closed loop stimulation and evaluation of the effect of the autonomic nervous system using heart rate variability. Prog. Biomed. Res. 7, 248—252 Nijsen M., Croiset G., Diamant M., Stan R., Delsing D., De Wied D., Wiegant V. (1998): Conditioned fear-induced tachycardia in the rat; vagal involvement. Eur. J. Pharmacol. 350, 211—222 Pan J., Tompkins W. J. (1985): A real-time QRS detection algorithm. IEEE Trans. Biomed. Eng. 32, 230—236 Parati G., Di Rienzo M. (2003): Determinants of heart rate and heart rate variability. J. Hypertens. 21, 477—480 Popp F. A., Chang J. J., Gu Q., Ho M. W. (1994): Nonsubstantial biocommunication in terms of Dicke’s theory. In: Bioelectrodynamics and Biocommunication (Eds. M. W. Ho, F. A. Popp and U. Warnke), pp. 293—317, World Scientific Publishing Press W. H., Teukolsky S. A., Wetterling W. T., Flannery B. P. (1992): Numerical recipes in Fortran 77: The art of scientific computing (2nd ed.), pp. 565—568, Cambridge University Press Pumprla J., Howorka K., Groves D., Chester M., Nolan J. (2002): Functional assessment of heart rate variability: physiological basis and practical applications. Int. J. Cardiol. 84, 1—14 Shen X., Mei W., Xu X. (1994): Activation of neutrophils by a chemically separated but optically coupled neutrophil population undergoing respiratory burst. Experientia 50, 963—968 Spyer K. M. (1993): Central nervous control of the cardiovascular system. In: Autonomic Failure: A textbook of clinical disorders of the autonomic nervous system (Eds. R. Bannister and C. J. Mathias), pp. 54—77 (3rd ed.), Oxford University Press, New York Stauss H. M. (2003): Heart rate variability. Am. J. Physiol., Regul. Integr. Comp. Physiol. 285, R927—931 Task force of the European Society of Cardiology and the North American Society of Pacing Electrophysiology (1996): Heart rate variability: Standards of measurements, physiological interpretation, and clinical use. Circulation 93, 1043—1065 Troncoso E., Rodrguez M., Feria M. (1995): Light-induced arousal affects simultaneously EEG and heart rate variability in the rat. Neurosci. Lett. 188, 167—170 Yli-Hankala A., Heikkil H., Vrri A., Jntti V. (1990): Correlation between EEG and heart rate variation in deep enflurane anaesthesia, Acta Anaesthesiol. Scand. 34, 138— 143 Van Wijk R., Van Aken H. (1991): Light-induced photon emission by rat hepatocytes and hepatoma cells. Cell Biophys. 18, 15—29 Voeikov V. L., Novikov C. N., Vilenskaya N. D. (1999): Low-level chemiluminescent analysis of nondiluted human bloodreveals its dynamic system properties. J. Biomed. Opt. 4, 54—60 Final version accepted: January 28, 2005