Journal of Ecology and the Natural Environment Vol. 4(7), pp. 186-193, April 2012 Available online at http://www.academicjournals.org/JENE DOI: 10.5897/JENE11.142 ISSN 2006 - 9847©2012 Academic Journals
Full Length Research Paper
Population status of the African elephant in Zambia Chansa Chomba1*, Chuma Simukonda2, Vincent Nyirenda1 and Francesca Chisangano3 1
Zambia Wildlife Authority, Directorate of Research, Planning, Information and Veterinary service P/B1, Chilanga Zambia. 2 Zambia Wildlife Authority, Department of Research P/B 1 Chilanga, Zambia. 3 Zambia Wildlife Authority, CITES office, P/B 1 Chilanga, Zambia. Accepted 15 February, 2012
Prior to the 1960s Zambia had an estimated elephant population of over 250, 000, but by 1989 it had fallen to about 18 000 individuals. After about 10 years of improved law enforcement operations and the involvement of local communities, populations stabilized and even started to increase by 1996. In order to update and compare population estimates, aerial surveys using similar methods used in the past were conducted between October 17 and December 5, 2008. Methods used were aerial sample counts, total counts and block counts in seven ecosystems; Nsumbu-Mweru wa Ntipa – Lusenga, Bangweulu, Luangwa Valley, Lower Zambezi, Upper Zambezi, Kafue and Chete-Sikula Islands. The national population estimate was 27, 529 an increase of 18% over the 1996 estimate. Of this population estimate 20, 200 (73%) were in the Luangwa, 3348 (12%) in Kafue, 2464 (9%) in Upper Zambezi and 1299 (5%) in Lower Zambezi ecosystems. The Luangwa Valley was thus the most important elephant habitat in Zambia. The current survey omitted West Lunga ecosystem which should be surveyed in future. Ground census should be introduced in the Nsumbu ecosystem because the itigi thickets impede visibility from the air and thus aerial counts may yield under estimates. It is also being recommended that some populations be translocated from well populated areas to ecosystems where populations are still too low so as to speed up population recovery from poaching depression. Key words: Aerial surveys, estimate, trend, distribution, Luangwa, Kafue.
INTRODUCTION Zambia had one of the largest elephant (Loxodonta africana) populations south of the Sahara (Anon, 1961). Prior to the late 1960s it was estimated that the elephant population was over 250, 000 (Anon, 1961) and wide spread (Ansell, 1960). Survey results supported by anecdotal observations by field staff indicated a precipitous decline of the population between 1976 and 1986 mainly due to excessive poaching (Chansa and Kampamba, 2005). By 1989 for instance, the numbers had fallen from about 250,000 to 18, 000 individuals (Anon, 1989). The species was later upgraded to Appendix I of the Convention on International Trade in Endangered Species of Wild Fauna and Flora (CITES) in
*Corresponding author. E-mail:
[email protected] or
[email protected].
1989 to save it from local extermination. Under CITES transferring a species to Appendix I restricts international trade and it is assumed that since poaching of elephant is driven by international trade in ivory, placing elephant in Appendix I of CITES would minimise poaching pressure. From the 1990s, the government of Zambia with the help of international partners increased investments in law enforcement activities. In the Luangwa Valley for instance, the Norwegian Agency for International Development (NORAD) invested substantial amounts of financial resources from the mid 1980s to date. With this consistent financial support from NORAD, the elephant population stabilized and even showed trends of increase. National surveys conducted by NPWS staff in 1992, 1994 and 1996 (Anon, 2010) estimated 22,467 in 1992, 21,000 in 1994 and 22,518 individuals in 1996 (Anon, 2002). Field reports submitted to headquarters by NPWS
Chomba et al.
187
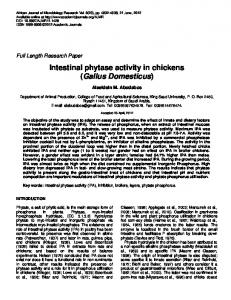
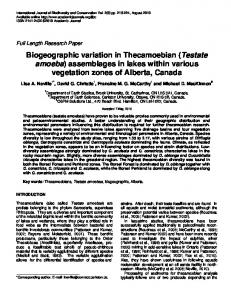
Figure 1. Location of the elephant survey areas in 2008, Zambia.
staff from Luangwa and Kafue ecosystems indicated a preponderance of juveniles and sub adults which was indicative of an increasing population. In 2008 government provided financial support to conduct a nation wide aerial survey to update the national elephant population estimates as a prerequisite to the preparation of a proposal presented at the Conference of the Parties (COP) 16 of CITES. At COP 16 Zambia presented a proposal for approval by parties a proposal to down list the elephant population from Appendix I which restricts international commercial trade to Appendix II which permits commercial trade since data from the surveys had shown that the population was increasing and was no longer endangered. The main objective of the survey conducted in 2008 therefore, was to establish the status of elephants in Zambia by determining population size, distribution and carcass ratio as a way of estimating the impact of poaching and documenting cross border elephant movements. This was because Zambia had planned to resubmit the proposal to down list the elephant population from Appendix 1 to Appendix II which was
rejected at COP 12 for reconsideration by the parties to CITES at COP 15. MATERIALS AND METHODS Study area The survey covered seven ecosystems; Luangwa, Kafue, Upper Zambezi, Lower Zambezi, Bangweulu, Nsumbu-Mweru wa NtipaLusenga Plains (Tanganyika) and Chete-Sikula Islands (Lake Kariba Islands) (Figure 1). The total area covered was 166,713 km2 (22%) of the country’s land surface area and comprised 17 National Parks, 25 Game Management Areas (GMAs) and 3 open areas which was 69% of the country’s protected area system. The aerial survey method used in each area was selected based on size and terrain of survey area. Aerial sample counts were used in large areas (≥ 100 km2) and this involved transect counts in more or less flat terrain and block counts in mountainous terrain. For small areas (< 100 km2) total counts were made.
Transect sample counts Streamers were marked using two nylon ropes with cones attached
188
J. Ecol. Nat. Environ.
at one end for stability in the air, were tied to each of the struts of a plane. The streamers were placed parallel to each other as the aircraft flew at about 91 m a.g.l. The distance between the streamers on each strut was arranged so that this distance represented a strip of about 150 m wide on the ground (Norton – Griffiths, 1978), so that a total strip width of 300 m is covered on the ground. The survey area was divided into strata based on density and distribution obtained from previous survey results. Transects were laid out at right angles to a road or river (principal physical features) and were parallel to each other. Sampling intensity ranged from 10 to 15% so that sampling effort could be allocated between strata based on animal density. Strata with high variance received more sampling effort than strata with low variance. Two fixed high wing six seater Cessna 206 and Cessna 207 aircrafts fitted with Garmin 296 GPS and Radar altimeter were used as described by Bell and Grimsdell (1973), Howard, Jeffery and Grimsdell (1984) and modified by Chansa and Kampamba (2009) by using GPS and applying it to plot spatial distribution of animals. Transects were flown at a nominal (theoretical) height of 91 m which gave a width of 300 m on the ground and cruising at an average speed of 160 km/hour which were also used in the previous surveys and made the data comparable. The flying height of 91 m above ground was directly proportional to the calculated width of 300 m on the ground. In defining the sampling strip width, a pair of parallel nylon ropes stabilized by plastic funnels at the end of each nylon rope was attached to the wing strut on each side of the aircraft. The strip width was determined by the distance between nylon ropes and the flying height. Wider parallel nylon ropes and higher flying height would give wider sampling strips and vice versa. Having decided on the flying height and strip width, the nylon ropes were placed in their correct spacing. The area observed at 91m was calculated based on the formula developed by Norton-Griffiths (1978) as follows:
W = W.h/H where; h - is the height of the observers’ eye from the ground, W - is the required strip width, and H - is the required flying height. The aircraft was propped into flying position. The observer then sat in a position that was comfortable for counting and an eye position was chosen. The position of the inner nylon rope was selected. The chosen position was marked in such a manner that the observer’s line of sight would be clear of the wheel of the aircraft but close to the aircraft’s body. The lower window marker code named ‘a’ was then fixed such that it was in line with the eye position and inner nylon rope. A mark code named ‘A’ was placed on the ground in line with marker ‘a’ and the inner nylon rope. The height of the observer’s eye code named ‘h’ was measured from the ground. A second marker code named ‘B’ was placed on the ground and the distance between ‘A’ and ‘B’ was denoted by ‘w’ and calculated based on the formular indicated above. In order to ensure that the strip width calculated above is correct, aerial calibration was carried out. Markers were laid out on flat ground or an airstrip at intervals of 20 m. The aircraft then flew at the required height passing at right angles to the markers. The observers then counted and photographed the number of markers between the nylon rope streamers. The strip width was then calculated as follows:
W= w.H/h where; h=average height of aircraft,
w=average strip width, H=selected census flying height, and W=nominal strip width at H. In this case, the selected flying height was 91 m. Flying higher than 91 m could have made transects wider than the calculated width of 300 m leading to an over estimate of numbers and vice versa. While flying along the transects, observers kept their heads in a constant position with reference to a masking tape marking on the window to avoid parallax error. The Front Seat Observer (FSO) recorded flight height from the Radar altimeter every 30 seconds. The right seat observer sat just behind the pilot and the left seat observer behind the recorder, and communicated through an intercom system. The FSO called out to the rear seat observers the start and end of each transect. Each rear seat observer recorded elephant observations within the strip width on each side of the plane. At each sighting, the observer called out to the recorder for the location way point, which the observer entered into the dictum recorder and sightings made were also recorded. The Recorder also entered the way-point into the hand-held GPS. Groups of animals greater than 20 oblique or near-vertical photographs were taken using a hand held camera with high resolution camera and the number of frames of pictures taken was recorded on the dictum as described by Grimsdell (1978). Recorded observations were transcribed by the observers onto data sheets immediately after each flight. On the ground, all GPS data from the front seat observer and photographs from the digital cameras were down loaded into an aerial survey database. Aerial block sample counts Aerial block sample counts conducted were based on the method described by Norton-Griffiths (1978) as aerial quadrat sampling. The survey area was mapped and divided into quadrat squares of approximately 3 km2 placed systematically to cover 10% sampling intensity of the survey area. A super cab aircraft which can manoeuvre at slower speed than a Cessna was used. The pilot searched each block sequentially while the observers counted animals observed within blocks. The average search time was three minutes per block. More time was spent when there were more than 20 animals in a group. Animals sighted close to the block boundary were also counted as being within the block. In block sample counts, streamers and radar altimeter were not necessary because total counts were conducted, but the observer sitting arrangements were maintained and the recorder only recorded GPS recordings of sightings. The pilot circled each block and ended with a diagonal line to head for the next block. Because of the small size of the blocks only one observer counted at a time, and so the pilot flew the other way to give chance to the other observer. Total counts were conducted in Inangu (13.2 km2); Chete (25.5 km2), Sekula (7107 km2) and Mosi-oa-Tunya (67.38 km2). Population estimates from the 1992, 1994 and 1996 surveys were also collected from Zambia Wildlife Authority archives. These surveys used similar survey methods as in the present study making data comparable with the 2008 estimates. Elephant carcasses Elephant carcasses were recorded and classified based on the criteria developed by Douglas-Hamilton and Hillman (1981) as shown in Table 1. Calculated elephant carcass ratios are good indicators of population increase. For instance, carcass ratios of < 8% indicate population increase. To distinguish elephant carcasses killed by poachers from other mortality factors was not easy. In this study however, it was generally assumed that poached elephants
Chomba et al.
189
Table 1. Classification of elephant carcasses based on the seven ecosystem surveyed in 2008, Zambia.
Class of elephant carcass
Description of carcass class
Carcass 1
Fresh; still has flesh giving the body a rounded appearance. Vultures still present and ground still moist from body fluids. Vegetation trampled. Carcass; probably less than 1 month old.
Carcass 2
Rot patch and skin still present. Skeleton not scattered. No Vulture droppings, no trampled vegetation. Less than 1 year old. Probably 3 to 8 months since death.
Carcass 3
Clean bones, skin usually absent, and vegetation re-grown in rot patch. More than 1 year old.
Carcass 4
Very old, bones scattered and turning grey. Very old; carcass could be up to 10 years old.
had tusks removed while those dying from natural mortality had tusks/ivory.
common elephant movement routes.
formula by Jolly (1969):
Data analysis
Ŷ = Population estimate = N. Ỹ
Trans boundary movements Transect sample counts Questionnaire surveys and personal interviews were conducted with Zambia Wildlife Authority in the field, community resource board members and tour operators in elephant areas bordering neighbouring countries. Hunters were among the most resourceful interviewees as they have historical data on elephant movements particularly in areas where elephants were some times killed on retribution after destroying crops or causing human fatalities. Key questions were formulated to know whether the interviewee knew the international boundary between Zambia and the neighbouring country. Those with knowledge of the international boundary were asked other questions relating to whether they had seen and how long ago they saw elephants cross the border into or out of Zambia. In areas where protected areas existed on both sides of the international boundary, consultation was made with staff of the wildlife agency of that country regarding records relating to elephant movements. In areas where Zambia has implemented Trans frontier Conservation Areas, data collection was easy. In areas such as the Kavango Zambezi (KAZA) Transfrontier Conservation Area, where elephants are fitted with GPS collars for monitoring purposes, information in form of maps made after down loading the data were collected and used to document
Transect sample counts data was analyzed using an Excel based application (Jolly, 1969) method 2 for unequal sized sample units. The estimate was calculated from the product of the overall density of animals counted per unit area and the census zone of stratum based on the formula:
Ŷ = Z. Ŕ where; Z= Area of the census zone, and Ŕ= is the ratio of all the animals counted to the whole area searched, thus an estimate of the overall density of animals per unit area.
where; N = the total ‘possible’ number of block units in the population Ỹ = the sample mean =∑Y ∕ n Y= population size of surveyed area n= sample
Elephant carcass ratio The elephant carcass ratios were calculated for each ecosystem based on the method described by DouglasHamilton and Hillman (1981), where the estimated carcasses were divided by the sum of all carcasses and estimated population.
RESULTS Block counts Block counts’ data was analyzed using Jolly’s method 1 for equal sized sampling units. This method was used because blocks were almost of the same size and shape except for those on the edges of strata. The population estimate was calculated from the average number of animals counted in each sampling unit based on the
2
The total area surveyed was 166,712.5 km which was 22% of Zambia’s land surface and 69% of the country’s protected area system. The 69% protected area surveyed contained 17 National Parks, 25 Game Management Areas and 3 were Open areas, (Lundazi, Sikongo and Kazungula).
190
J. Ecol. Nat. Environ.
Table 2. Elephant population estimates and carcass ratio for the seven ecosystem surveyed in 2008, Zambia.
Population estimate Ecosystem Nsumbu-Mweru wa NtipaLusenga (Tanganyika) Bangweulu Luangwa Valley Lower Zambezi Upper Zambezi Kafue Chete-Sikula (Kariba)
Carcass ratio details Carcass ratio Significance Level** (%)
95 % CL
Lower limit
Upper limit
27
47
0
74
0
NA
136 20,200 1299 2464 3348 55*
137 3,592 860 2239 933
0 17,129 439 225 2415
24, 313 2159 4703 4281
1.57 14.4 3.2 0.9 0
NA Low High Low Low NA
*Total count; ** Low if below recommended 8% and high if above it.
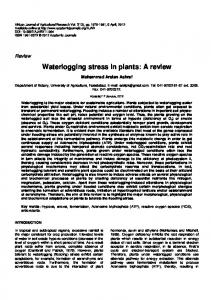
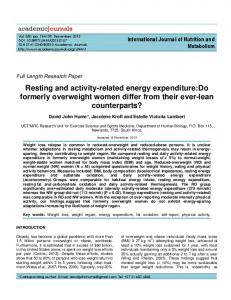
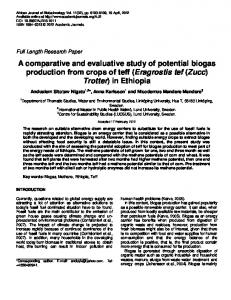
West Lunga ecosystem was not surveyed because of insufficient financial resources. The national population estimate was 27,529 ± 4405 elephants distributed in four major elephant ecosystems; Luangwa, Kafue, Upper (including Mosi oa TunyaKazungula-Sioma areas) and Lower Zambezi Out of the total estimate 20,200 (73%) were in the Luangwa ecosystem, 3348 (12%) in the Kafue ecosystem, 2464 (9%) in Upper Zambezi and 1299 (5%) in the Lower Zambezi area (Table 2). The Tanganyika ecosystem had 27 elephants and was the lowest. In the Bangweulu ecosystem, there were 136 elephants all sighted in Kansaka National Park and 54 were at Chete and Sikula islands on Lake Kariba. The largest number of elephants were in luangwa and Kafue which were also the largest ecosystem (Figure 2). In comparison with previous surveys, the 2008 estimate showed an increase of 18% over the previous estimate in 1996 Regression analysis showed a positive increase (y = 1670 4 x + 19203; R2 = 0. 5705) (Figure 4).
Carcasses The total number of carcasses estimated was 75 with 3% as mean carcass ratio at national level. Of the 75, only an estimated number of 20 (25%) were in category 1. North Luangwa National Park in the Luangwa Valley had the lowest carcass ratio of 0.1%, while the South Luangwa National Park had 0.6 % which indicated low elephant mortality in both National Parks. Musalangu GMA had 13.1% which was the highest carcass ratio of all PAs in the Luangwa Valley ecosystem. According to DouglasHamilton and Hillman (1981), the figure of 13.1% was higher than the recommended upper limit of 8%. Of all carcasses recorded in the Luangwa Valley, 76% were found in West Musalangu GMA suggesting that poaching was high in this area. The mean carcass ratio for the Luangwa Valley ecosystem however, was only 1.57and was so poaching was also assumed to be low. This
assumption is based on the principle that high level poaching is when the carcass ration is ≥ 8% (DouglasHamilton and Hillman, 1981). The highest incidences of elephant carcasses were in Lower Zambezi system which had 14.37% while upper Zambezi had 3.2%. West Petauke GMA which was considered to be part of the Lower Zambezi ecosystem had 7% while Kafue had a low carcass ration of 0.9%. Bangweulu, Chete and Sikula islands on Lake Kariba and the Tanganyika-Nsumbu-Lusenga Plains ecosystem recorded no carcass incidence (Table 2). Of all the carcasses recorded during the survey, 62% were in Lower Zambezi National Park, implying that this was the most affected ecosystem by poaching. Generally, poaching was low across all the ecosystems, except for the Lower Zambezi ecosystem where the carcass ratio was higher than 8%.
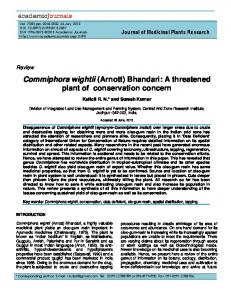
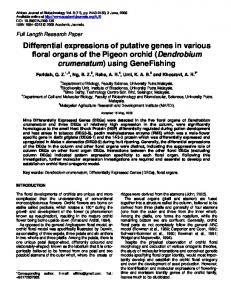
Tran boundary movements There were seven routes where elephants were recorded to cross international boundaries into neighbouring countries. These were; West Lunga – Congo DR route, Kasanka/Bangweulu – Congo DR route, Tanganyika – Congo DR route, Nyika (Zambia) – Nyika (Malawi) route, Lukusuzi (Zambia) – Vwaza (Malawi) route, Lower Zambezi (Zambia) – Mana Pools (Zimbabwe) route, and Sioma – Namibia/Botswana route (Figure 3).
DISCUSSION The elephant population in Zambia has recovered from the poaching pressure of the 1970s to late 1980s and is increasing (Figure 4). The elephant population estimate of 27,529 is perhaps lower than the true population as some areas such as the West Lunga ecosystem was not surveyed, and the Nsumbu area had an under estimate. The itigi thicket in Nsumbu-Mweru was Ntipa complex for
Chomba et al.
191
Figure 2. Major elephant ecosystems and elephant distribution in 2008, Zambia.
instance, makes aerial surveys inappropriate for the area due to impaired visibility. Ground counts and use of dung count would yield a higher estimate in this ecosystem (Jachmann, 2001). The Luangwa Valley was the most important elephant range in Zambia, a pattern which was also recorded in the 1960s (Chansa and Kampamba, 2005).A comparison of population estimates between National Parks and Game Management areas showed a highernumber in National Parks than Game Management Areas. This may be attributed to higher security and absence of human settlements in National Parks. In Game Management Areas, human encroachment heightened human – elephant conflicts and many communities did not tolerate elephants in their vicinity. Perhaps this is one of the reasons why Musalangu GMA recorded the highest elephant carcass ratio (13.1%) in the entire Luangwa Valley.
The low carcass ratio in the Upper Zambezi ecosystem could be a result of improved law enforcement surveillance after the establishment of the KavangoZambezi (KAZA) Transfrontier Conservation Area. Regarding elephant carcass ratios at national level, Douglas-Hamilton and Hillman, (1981) indicated that stable or expanding populations show elephant-carcass ratio ranging from 2 to 8% while decreasing populations have ratios greater than 8%. This implies that the elephant population in Zambia is generally on the increase except for the Lower Zambezi area where the carcass ratio was higher than 8%. The transfrontier movement routes recorded during this survey were attributed to the country’s central location where it shares borders with eight countries. Since most 2 ecosystems are large (>10 000 km ) in extent, it becomes inevitable for elephant range to coalesce and sprawl with those of the neighbouring countries. In fact the concept of
192
J. Ecol. Nat. Environ.
Figure 3. Trans-boundary elephant routes in 2008, Zambia.
Transfrontier Conservation Areas in the southern African sub region was based on this observation.
Conclusion The most elephant populated range in Zambia was the Luangwa Valley, currently holding more than 75 % of the national population. This population is largely restricted to Zambia except for the limited movements that may occur between Zambia and Kasungu National Park in Malawi. The National Parks were the most secure habitats for elephants in Zambia and the long term survival of elephants in Zambia will depend to a large extent on the protection of elephant populations inside National Parks and transfrontier areas. The establishment of a Transfrontier Conservation area between Lower Zambezi National Park in Zambia and Mana Pools National Park in Zimbabwe is recommended as this will enable the two countries to work together in curbing poaching incursions which are currently high as reflected in the high carcass
ratio of 14.1%. Regarding law enforcement, Zambia Wildlife Authority needs to upscale operations and where possible consider population supplementation in the Nsumbu-Mweru wa Ntipa – Lusenga Plains ecosystem. Such effort would speed up the recovery from the poaching depression of the 1970s-1980s of the remnant elephant. The Bangweulu ecosystem also requires similar conservation measures as the population is also still low at 136 individuals. In terms of population estimates, the Nsumbu-Mweru wa Ntipa ecosystem which has itigi thicket that impairs visibility from the air, ground counts and dung counts based on the methods described by (Kangwana, 1996) will be required to compare estimates obtained from aerial techniques.
ACKNOWLEDGEMENTS This survey could not have taken place without financial support of the Government of the Republic Zambia. We
Chomba et al.
193
Figure 4. Elephant population trends since 1992, Zambia.
are also indebted to Dr. Colin Craig for his technical guidance during the planning and data analysis phases. The survey costs for the upper Zambezi ecosystem were funded by the African Wildlife Foundation – Kazungula Heartland. The Flying Mission Zambia Ltd and ZAMFARI Zambia Ltd. provided aircrafts and committed staff at short notice. Several members of staff of Zambia Wildlife Authority provided input at various levels. These were; Twakundine Simpamba, Edward Chilufya, Chaka Kaumba, Lisa Mwiinga, Shantanda Shabwela, Jassiel Msoka, Jarton Shawa, Rhoda Kachali, Jeremy Sikazwe, Priscilla Mkanga Sichone, Daniel Mwizabi, Benson Kabungo, Bryson Thole and Davison Mumba. REFERENCES Anon (2010). Proposal to down list the African Elephant population of Zambia from Appendix I to Appendix II of CITES. Zambia Wildlife Authority, Chilanga. Anon (1961). A Wildlife Policy for Northern Rhodesia. Ministry of Native Affairs, Lusaka. Anon (1989). Operations of the Save the Rhino Trust. Lusaka. Ansell WFH (1960). Mammals of Northern Rhodesia, Lusaka.
Bell RHV, Grimsdell JJR (1973). The persecuted black lechwe of Zambia. Orxy., 12: 77-92. Chansa W, Kampamba G (2005). The National elephant conservation plan. Delux Printers, Lusaka. pp. 1-6. Chansa W, Kampamba G (2009). The population status of the Kafue lechwe in the Kafue Flats, Zambia. Afr. J. of Ecol., 48: 837-840 Douglas-Hamilton I, Hillman A (1981). Using Elephant Carcasses and Skeletons as indicators of Population Trends in Low-Level Aerial Survey techniques. ILCA Monograph. Howard GW, Jeffery RHV, Grimsdell JR (1984). Census and population trends of balck lechwe in Zambia. Afr. J. Ecol., 22: 175-179. Jackmann H (2001). Estimating abundance of African Wildlife. Kluwer Academic Publishers, London. Jolly GM (1969). Sampling Methods for Census of Wildlife Populations. E. Afr. Agric. For. J., 34: 46-49. Kangwana K (1996). Studying elephants. African Wildlife Foundation Technical Hand Book Series 7. Nairobi. pp. 20-37. Norton-Griffiths M (1978). Counting Animals. African Wildlife Leadership Foundation, Nairobi.