May 29, 2003 - OECD - Organisation for Economic Co-Operation and Development ..... For instance, Vega and Urrutia (2001) observe that the vitality of the new ...... water use, plumbing and irrigation systems and education programs. A.
Full reference:
Ioris, A.A.R. 2018. Assessing Freshwater Sustainability at the River Basin Scale. Scholars’ Press: Riga: Latvia.
Assessing Freshwater Sustainability at the River Basin Scale
Antônio Augusto Rossotto Ioris 2018
ii
Table of Contents Acronyms and Abbreviations................................................................................... iv Units and Symbols ...................................................................................................... v Chapter 1 - Introduction .......................................................................... 1 Chapter 2 - Sustainable Development, Water Sustainability and Sustainability Indicators ....................................................................... 9 Chapter 3 - Research Methods and Techniques ............................. 49 Chapter 4 - Framework of Sustainability Indicators ...................... 85 Chapter 5 - National Water Policies and the Selected Catchments ........................................................................................... 117 Chapter 6 - Applying the Water Sustainability Framework to the Selected Catchments .......................................................................... 147 Chapter 7 - Discussion of Framework Appropriateness and Research Approach ............................................................................ 228 Chapter 8 - Conclusions ...................................................................... 250 Bibliography ........................................................................................... 255
iii
Acronyms and Abbreviations ABES-RS - Brazilian Association of Sanitation and Environmental Engineering, Rio
Grande do Sul Section ABRH - Brazilian Water Resources Association ASCE - American Society of Civil Engineers ANA - National Water Agency, Brazil AWRA – American Water Resources Association Comitê Pardo – Pardo River Basin Committee Comitesinos – Sinos River Basin Committee CORSAN - State Water Authority, Rio Grande do Sul CPDS – Commission of Policies for Sustainable Development and the National Agenda 21, Brazil CRPB - Clyde River Purification Board DEFRA - Department of Environment, Food and Rural Affairs DETR - Department of Environment, Transport and the Regions DMAE – Municipal Department of Water and Sewerage, Porto Alegre EEA - European Environment Agency FEE – Economic and Statistics Foundation, Rio Grande do Sul FEPAM – State Environment Protection Foundation, Rio Grande do Sul GDP - Gross Domestic Product GIS - Geographical Information System GVA - Gross Value Added (i.e. GDP as factor cost in current prices) GRO - General Register Office, Scotland HDI - Human Development Index HMSO – Her Majesty’s Stationary Office IAHS - International Association of Hydrological Sciences IBAMA - Brazilian Institute of Environment and Renewable Natural Resources IBGE – Brazilian Institute of Geography and Statistics IMD - Index of Multiple Deprivation IPH - Institute of Hydrological Research of the Federal University of the Rio Grande do Sul (UFRGS) IRBM - Integrated river basin management ISMA - Expanded Social Municipal Index IUCN - International Union for Conservation of Nature IWA - International Water Association IWRM - Integrated water resources management M-HDI - Municipal Human Development Index MI - Macaulay Land Use Research Institute MMA – Ministry of the Environment, Brazil NERPB - North East River Purification Board OECD - Organisation for Economic Co-Operation and Development iv
Pró-Guaíba - Guaíba Watershed Environmental Management Programme
RS State - State of Rio Grande do Sul, Brazil SE – Scottish Executive SEMA - State Secretariat of the Environment, Rio Grande do Sul SEPA - Scottish Environment Protection Agency SLIM - Social Learning for the Integrated Management and Sustainable use of Water at Catchment Scale SNH - Scottish Natural Heritage UKTAG - United Kingdom Technical Advisory Group on the European Water Framework Directive UNCSD - United Nations Commission on Sustainable Development UNDP – United Nations Development Programme UNECLAC - United Nations Economic Commission for Latin America and the Caribbean UNEP - United Nations Environment Programme UNISC - University of Santa Cruz do Sul UNISINOS - Sinos Valley University UNGA - United Nations General Assembly UNWWAP - United Nations World Water Assessment Programme. UPAN – Natural Environment Protection Union WECD - World Commission on Environment and Development WEWS - Water Environment and Water Services Act (Scotland) WFD - Water Framework Directive (European Directive) WWF - World Wildlife Fund for Nature Units and Symbols BOD - Biological Oxygen Demand
cumecs – cubic meters (m3) per second MAM7 - mean annual minimum 7-day average flow (the lowest sustained flow, in average for a 7-day period) Ml/d – megalitres (1 million litres) per day mm – millimetres Q95 - discharge equalled or exceeded 95 percent of the time, as determined from the data collected over the period of record Q7,10 - the lowest 7-consecutive-day average flow with a probability of occurring no more than once in 10 years
v
Chapter 1 - Introduction 1.1 Chapter Overview This Chapter introduces the context, objectives and structure of the book. The Chapter points out the relevance of indicators of water sustainability for the broader debate on sustainable development. It also describes the relevance of sustainability indicators for water policy and management. The Chapter then identifies the purpose of this book: understand the process of developing water sustainability indicators and their application to concrete river basin experiences. At the end of this first Chapter, there is an outline of the connections between book chapters, illustrated by a schematic diagram. 1.2 Research Context and Background The importance of considering the negative impacts of human action on the environment is being increasingly recognised by society and by government. The minimisation of those negative environmental impacts, while properly satisfying human demands, is the essential element of the sustainable development paradigm. Sustainable development seeks balance between the conservation of the ecosystem and the satisfaction of social and economic demands: replacing processes with negative impacts on the environment and society with new approaches that allow stable socio-natural systems to continue indefinitely. Sustainable development links the environmental, social and economic dimensions of the management of natural resources and the need for balancing them when conflicts arise (OECD, 2001). A concept such as sustainable development has currency in the modern world because traditionally development has been mainly equated to growth in the use of physical resources (Dower, 1998). In most circumstances, mainstream development has promoted an unlimited use of natural resources for the accumulation of private benefits. This unrestrained, unsustainable use of the environment creates conflicts between the conservation of natural systems and the satisfaction of human demands – a conflict which sustainable development seeks to address. In fact, sustainable development could be viewed as an attempt to answer the elemental moral question on the way of life human beings ought to pursue (Engel, 1990). As explained by Ingold (2000), there should be no ‘radical break’ between social and ecological relations, as long as the former constitute a subset of the latter. Human life should be engagement with the environment and
1
“it is only because we live in an environment that we can think at all” (Ingold, 2000: 60). Because that environmental disruption created by mainstream development has generally privileged certain social groups, sustainable development is directly related with the emerging concept of ‘environmental justice’. Ayeman and Evans (2004) point out that environmental justice is both a vocabulary for political opportunity, mobilization and action, and a policy principle to guide public decision-making. It emerged initially as a new notion underpinning action by community organizations campaigning against environmental injustices. As the environmental justice discourse has matured, it has become increasingly evident that it should play a role in the wider agendas for sustainable development and social inclusion. The notion of ‘just sustainability’ provides a discourse for policymakers and activists, which brings together the key dimensions of both environmental justice and sustainable development. The overarching objectives of reconciling human demands and environmental conservation can be incorporated into the management of specific territories or into the conservation of particular natural resources. It means that there is a close correlation between responses at both global and local scales for the achievement of sustainable development (De Haan, 2000). One area of environmental management that can directly benefit from the paradigm of sustainability is the management of water resources. Water is essential not only for ecosystem functions, but it is also employed in most social and economic activities. (Note that Water and freshwater are used interchangeably in this text.) Traditional approaches to water management have, however, resulted in hydrological, environmental and financial pressures that create a ‘syndrome’ of unsustainable allocation of water (Winpenny, 1994). The consequence of such unsustainable pressures is the disruption of the water environment, with negative effects on populations of living organisms and on human well-being. The sustainable management of water aims to maintain and improve the aquatic environment, while adequately satisfying human needs. Water sustainability is related to the needs of the present and future generations, the carrying capacity of supporting systems and the maintenance of water system integrity (Rijsberman and van de Vem, 2000). The preserved integrity of the water system is one of the basic conditions if development is meant to sustain the level of current opportunities for future generations: one of the basic tenets of sustainable development. “Water is the perfect example of a sustainable development challenge – encompassing environmental, economic and social dimensions” (OECD, 2003: 19). In practice, the operationalization of sustainable 2
water management is not simple and regularly involves disputes between interested parties. Most conflicts arise from the fact that water sustainability is an elusive notion: it is difficult to define precisely what the boundaries are, and to what extent it requires changes in human practices. In most cases, it is not simple to reach an agreement about sustainable strategies of allocation, use and conservation of water. Carter et al. (1999) observe that water sustainability depends on numerous attitudinal, institutional and economic factors. Questions related to sustainable water management inevitably address technical, social and ethical controversies. For instance, the environmental aspect of water sustainability requires the continuation of regulatory functions responsible for the stability of natural processes within the river basin. The economic aspect is based on the fact that water is not simply an economic good, but a natural good with economic functions. The social aspect involves the promotion of human well-being and opportunities for public engagement. According to Beck (2002), the discussion on sustainability in the water sector can be summarised as aiming towards participatory, democratic, holistic and integrated decision-making. Amid conceptual and practical controversies mentioned above, there have been growing attempts to interpret and translate the goals of sustainable development into water legislation and management approaches (as demonstrated, for example, in the World Water Forum, 2003). The starting point of this search for the sustainable management of water is exactly the assessment of the environmental and socio-economic problems related to use and conservation of the aquatic environment. The assessment of water sustainability problems needs to address the proper spatial scale of consideration, since the water cycle naturally describes its own unit of analysis: the catchment space. The catchment integrates a variety of environmental and social processes that constitute the appropriate scale for the consideration of water problems and management solutions. Nevertheless, depending on the nature of the problem or on the sensitivity of the catchment, other spatial scales can also be considered for water management, i.e. sub-catchment or regional scales. It will be demonstrated throughout this book that the assessment of water sustainability is a positioned interpretation of the meaning of sustainable development in relation to specific water management questions. The assessment is subjective because it expresses the preferences in terms of the balance between nature conservation and socio-economic development. At the same time, it reveals judgements about the present use of natural resources and the conservation for future generations. In other words, because sustainability is a 3
socially constructed concept, its assessment is dependent upon the worldview and background of those involved in the examination, from the interpretation of sustainable development to the selection of issues to be studied. The very method of doing research is not neutral, but intrinsically expresses preferences and values about the objectives of sustainable development. In practice, the assessment of sustainability is an important product of the interference of the researcher with the object of study. Data for the assessment of water sustainability are not acquired in an attempt to falsify hypotheses but rather to describe situations beyond the limits of a test (Ackermann, 1976). The assessment of water sustainability is an attempt to articulate together different forms of data about the water systems in a way to provide an explanation of problems and obstacles for the achievement of the sustainability goals. Sustainability assessment, thus, constitutes a form of ‘epistemic reflexivity’ (i.e. critical interpretation of the goals and foundations of sustainable development), which can directly serve to create a ‘reflexive turn’ in environmental regulation (i.e. judicious balance of environmental, economic and social dimensions of the processes that constitute the water environment). Grundwald (2004) points out that the scientific contributions to sustainable development do not follow the classical routes to cognition or the traditional concepts of science. On the contrary, strategic knowledge for sustainable development extends far beyond explanatory and observational cognisance, but rather consists of ‘problem-oriented combinations’ of explanatory, orienting and action-guiding knowledge. For the last author, “above all, reflexivity and making societal learning possible are important requirements. This has consequences, not only for the self-concept of the sciences, but also for the relationship between science, politics and other societal areas”. The explanatory knowledge of sustainability assessment has an inseparable connection with deep-rooted societal structures and values, the long-term nature of many forms of development, as well as often necessary inclusion of societal grounds and actors in specific demands on scientific problem-solving contributions. Sustainability assessment should, therefore, be understood as a learning (shared) process rather than as a thing to be measured. The assessment of water sustainability problems consequently requires adequate tools to identify critical processes and foster critical thinking. The most appropriate tools for this assessment are frameworks of water sustainability indicators (Walmsley, 2002). Sustainability indicators articulate worldviews and interconnecting environmental and social variables (Levett, 1998). The adoption of indicators of water sustainability can help to quantify change, identify processes and offer a 4
framework for setting targets and monitoring performance. However, indicators are not absolute measures of sustainability: the assessment depends upon the values given by society to their inputs and outputs (Edward-Jones and Howells, 2001). The reduction of complex water systems to a limited number of variables involves judgements and preferences, which should be made explicit during the assessment (Peet and Bossel, 2000). The ultimate intention of the assessment of sustainability through the use of indicators is to critically evaluate the patterns of water management. The focus of sustainability indicators is on processes that affect the reconciliation of the environmental and socio-economic dimensions of sustainable development. Their main contribution is to inform water policy and regulation by the explanation of past processes and simulation of future trends. Indicators can also play an important role in communicating information to different categories of stakeholders in a straightforward and unambiguous way. Through the facilitation of better communication, indicators can also support participatory decisionmaking and foster consensus building. Astleithner and Hamedinger (2003) recommend that research on sustainability indicators should focus on understanding the production of social meaning and processes of social interaction within political-administrative systems. Most current approaches to water sustainability indicators have common, but important, weaknesses in the treatment of water questions and this will be discussed in greater detail in the next Chapter. This current book specifically aimed to propose some alternatives to those inadequacies. The first common weakness is the selection of the scale of analysis: the focus of many research approaches is not the catchment scale, but localised ecological processes. Other equivalent approaches include indicators for the national scale only. A second common weakness is the singular emphasis on the environmental dimension, ignoring the also relevant economic and social aspects of water management. A third problem is the omission of a timescale, by only considering indicator results for a specific point in time and not for a representative sequence of years. Fourthly, many studies, instead of providing information about the sustainability of the water system, only deal with isolated parameters of the water processes (it will be pointed out that appropriate indicators of sustainability incorporate individual parameters into aggregate expressions). Conversely, a fifth weakness of many approaches is excessive complexity or data aggregation, which reduces the communication of results to wider groups of stakeholders. A more fundamental weakness in most approaches to sustainability assessment is the disregard for the socially constructed circumstances involved in the production 5
of knowledge. Contrarily to this supposed neutrality of sustainability assessment, the very production of knowledge about sustainability conditions cannot be ascertained from empirical observation alone, but depends upon criteria of analysis that have ethical, social and political bases. Last but not least, it must be emphasised that this book is affiliated with a broader and fecund investigation on water sustainability, which takes place both in the realm of academic work and in different levels of public involvement and governmental decision-making. As pointed out by O’Riordan (2004), there is nowadays a growing need for a ‘science of sustainability’, which should create not only the scientific and technological basis for achieving sustainable development, but also understand the political aspects of environmental management. “The consequence of all this is that environmental science has become highly political, and geographers need to recognize and work within an expanding political process” (O’Riordan, 2004: 234). Fundamentally, this book deals with the demands of sustainability for water management at the catchment level and is, ultimately, a contribution for the debate on the local agenda of sustainability. 1.3 Research Aims and Objectives This book was intended to discuss the development of water sustainability indicators and contribute to the expanding knowledge on the subject. The basis of the research was the debate concerning the application of the principle of sustainable development in the management of the water environment. The overall aim of this research was to understand the process of developing sustainability indicators and their use in terms of assessing water sustainability conditions. A framework of water sustainability indicators was thus proposed, tested and evaluated making use of an inductive and interactive approach. The research had two central objectives:
Develop a framework of indicators for the assessment of the sustainability condition of water systems, and Apply the proposed assessment framework of indicators to selected river basins with contrasting water problems.
These objectives were achieved through the detailed examination of the origins of the critical processes affecting water sustainability. This examination focused on the three dimensions of sustainable development in relation to the management of water systems, namely environmental, economic and social 6
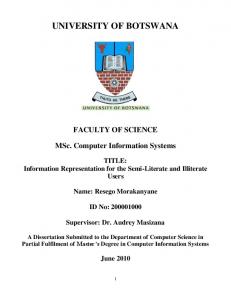
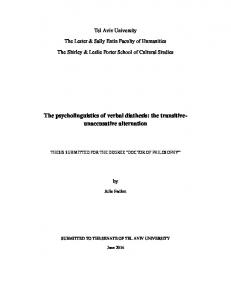
dimensions. This separation is mainly for analytical purposes, because, in practice, those three dimensions are indissoluble from water use and conservation problems. At the same time, to stimulate discussion and facilitate the critical analysis of indicator development, catchments in different countries were selected according to established criteria. The comparison of catchment results from different countries was designed to facilitate the reflection about the process of indicator development. 1.4 Book Structure This book involved a theoretical elaboration, an empirical investigation and a final discussion of results. These three main parts are reflected in the organisation of chapters. Chapter One has introduced the key issues related to sustainable development and water management: the context of the book. Chapter Two deals with the global debate on sustainable development and the fundamental conflicts and dilemmas involved in translating sustainable development into water policy and management. Chapter Two also discusses the controversies involved in the use of indicators for sustainability assessment, with examples from different parts of the world. Chapter Three sets out the theoretical and methodological basis of the research on the development of indicators of water sustainability and explains the combination of research methods for developing and calculating the proposed indicators. Also described in Chapter Three is the participatory approach used in the research and the gradual refinement of indicator expressions. Chapter Four presents the details of the group of indicators proposed in this research for the assessment of water sustainability. The group of indicators is not intended to be aggregated into a final index of sustainability, but each indicator is examined individually and related with other indicators. Chapter Five characterises the legal and institutional context of water management in Scotland and in Brazil, which are the two selected countries for this research, and describes the four catchments where the proposed framework was applied. The empirical results from the indicators are presented in Chapter Six, which describes the details of the calculation, as well as explanations about gathering and manipulation of data. The results of follow-up interviews with stakeholders are also included in Chapter Six. The discussion of indicator results, the role of the researcher and lessons learned are presented in Chapter Seven. The conclusions about the weaknesses and achievements of the research approach are presented in the final Chapter. Figure 1.1 graphically illustrates the structure of the book and the connections between chapters. 7
Chapter 1 – Introduction Context Objectives Book overview
Chapter 4 – Framework of Water Sustainability Indicators Water quality Water quantity System resiliency Water use efficiency User sector productivity Institutional preparedness Equitable water services Water-related well-being Public participation
Chapter 2 – Literature Review Sustainable development Water management questions Water sustainability River basin complexity Sustainability assessment Water sustainability indicators
Chapter 3 – Methodology Indicator development Combined research methods Strategy of gathering data Data manipulation
Chapter 5 – National Policies and Catchment description Clyde Sinos Dee Pardo
Chapter 6 – Application of the proposed framework Results and interviews Diagrams and tables
Chapter 7 – Discussion Catchment results Role of the researcher Lessons learned
Chapter 8 – Conclusions
Figure 1.1: Book Structure and Interactions between Chapters
8
Chapter 2 - Sustainable Development, Water Sustainability and Sustainability Indicators 2.1 Chapter Overview This Chapter summarises the debate on sustainable development and compares representative approaches developed for the analysis of sustainability. It starts with a discussion of some paradigmatic interpretations of sustainable development. The following section reviews the repercussions of sustainable development for water management and deals with the concept of water sustainability. This section also justifies the importance of the catchment approach for water sustainability due to the complexity of social and natural processes that take place in the catchment space. The next chapter section reviews conceptual and methodological difficulties related to the assessment of sustainability. Key themes related with the assessment of water sustainability are then presented. Subsequently, selected methodologies to assess the sustainability of water systems are critically evaluated. Based on the deficiencies identified in those approaches, the final section suggests the fundamental requirements for a study of water sustainability at the catchment scale. 2.2 Sustainable Development: The Ongoing Debate In the last few decades, there has been increasing concern about the disruption of the global and local environment. This recognition of mounting environmental problems was the starting point for a contentious worldwide debate on sustainable development. Elliot (1994) describes the roots of sustainable development extending back into theories of ‘development’ (in the post-colonial 1950s) and ‘environmentalism’ (during the ideological clashes in the 1960s). The specific expression ‘sustainable development’ was first used in the 1970s and, since the 1980s, the debate has flourished. However, intensive investigation into the meaning of sustainable development has not reduced its contentiousness, but, on the contrary, has rather increased its controversy. According to Jacobs (1999), similarly to notions like democracy, liberty or social justice, sustainable development is a ‘contested concept’. The root of the controversy rests on the fact that the notion of sustainable development is socially and discursively constructed, creating a great ambiguity between divergent concepts (Rydin, 1999). There are authors who claim that it is first necessary to clarify the real meaning of sustainable development in order to overcome the influence of institutional and group interests. Other authors maintain that the 9
imprecision of the term allows an easy appropriation by anyone and makes it vulnerable to be distorted. By contrast, others argue that such ambiguity creates some ‘common ground’ that allow public policies to be collectively constructed and, far from effecting reconciliation, precisely defining what is sustainable will expose unnecessary conflicts (Owens, 1994). Among the innumerable publications on sustainable development, there are three landmark documents with widely quoted definitions: The first is the Report of the Brundtland Commission (WCED, 1987: 43), famously known as Our Common Future, which defines sustainable development as “development that meets the needs of the present without compromising the ability of the future generations to meet their own needs”. The second landmark publication is the World Conservation Strategy, presented by the International Union for the Conservation of Nature and Natural Resources (IUCN, 1980: section 1), in co-operation with WWF and UNEP, with claims that “for development to be sustainable it must take account of social and ecological factors, as well as economic ones; of the living and non-living resource base; and of the long term as well as the short term advantages and disadvantages of alternative actions”. The third definition was also put forward jointly by IUCN, UNEP and WWF in a document called Caring for the Earth (IUCN, 1991: 10), which affirms that sustainable development means: “improving the quality of human life while living within the carrying capacity of supporting ecosystems”. The above definitions are only three among numerous statements about sustainable development. For most authors, sustainability and sustainable development are taken as equivalent words. However, according to Dobson (1998), sustainable development is a rather anthropocentric form of sustainability, in the sense that sustainable development represents aims to fulfil a particular framework of development, which provides conditions within which sustainability can be guaranteed. The concept has proved to be highly dynamic and, for Eden (2000), sustainability continually changes its meaning as it is analysed, reinvented and operationalized for a host of policy documents and institutional purposes. Others have difficulties with the concept itself, for example Clarke (2002) considers that ‘conservation’ and ‘development’ are paradigms of the 19th Century, which create a barrier to understanding the contemporary perspectives of sustainable development. Lumley and Armstrong (2004) also identify significant connections between sustainability and the 19th Century 10
philosophical positions. Jackson (2000) argues that our failure to conceive sustainable development within the prevailing worldview suggests a kind of ontological incompleteness in human understanding. This is similar to the ideas of Hamilton (2002), who affirms that the dilemma of sustainability is due to the conflicting integration between rational knowledge (scientific) and intuitive knowledge (traditional and empirical). There are those who identify a more radical message on the agenda of sustainable development. For instance, Vega and Urrutia (2001) observe that the vitality of the new paradigm of sustainability hinges on the refutation of economic growth as the key to development, without including social and environmental requisites at the same level of importance. O’Riordan (1993) points out that the causes of non-sustainability lie in profoundly powerful systems of exploitation and degradation that are fostered by ignorance, greed, injustice and oppression. Maiteny (2000) affirms that a sustainable future is dependent on changes in human behaviour and sustainable behaviour depends on structural changes in society. Those critical interpretations of sustainable development maintain that environmental problems cannot be understood in isolation from the political and economic contexts within which they are created. Following this critical point of view, Guimarães (2001) affirms that it is meaningless to dissociate the environmental problems from development questions, as the former are nothing other than an expression of the failures of certain development models. That coincides with the position of Gallopín (2001), who argues that the current crisis humankind faces is not physical, but sociopolitical, because it results from highly complex interactions between space and time scales, and between human actions and natural processes. Furthermore, Yanarella and Bartilow (2000) emphasise that for development to be truly sustainable there must be a fundamental change in the very pattern of global wealth and power. The critical interpretations of sustainable development serve to emphasise the interdependence between environmental conservation and socio-economic pressures. To a great extent, the controversy about sustainable development is focused on acceptable levels of trade-off between the ecological, economical and social dimensions of development (Goodland and Daly, 1996). The three dimensions of sustainable development can be represented by their equivalent forms of environmental, economical and social ‘capital’ (Munasinghe, 1993). These can receive different classifications, such as with the inclusion of ‘natural resources’ as a fourth category (DETR, 1999a) or with the distinction between ‘social’ (skills and institutions) and ‘human’ (health and education) forms of capital 11
(World Bank, 2003). The balance between conserving and exploiting those different forms of capital gives rise to, on the one hand, ‘weak sustainability’ positions, for which the key requirement for sustainable development is that total capital stock should not decrease over time, without the need for a constant reserve of natural capital. Conversely, there are ‘strong sustainability’ positions, which claim that parts of the natural capital are critical and need to be indefinitely preserved, so that essential environmental functions must be necessarily maintained. Williams and Millington (2004) affirm that ‘weaker sustainability’ is fundamentally based on the notion that nature is a resource to be exploited and, on the contrary, ‘stronger sustainability’ is based on changing human demands on natural resources because nature has its intrinsic rights to be ‘unmolested’. The disagreement between weak and strong sustainability rests on the extent to which environmental and man-made assets can be substituted. Weak sustainability requires constancy of the aggregate of all forms of capital, while strong sustainability requires that both the aggregate and the natural capital to be non-declining (Pearce et al., 1990). Nevertheless, for other authors the dichotomy between weak and strong sustainability does not resolve this debate. For instance, Holland (1999) argues that the simple maintenance of capital is not practicable and not desirable, inasmuch as society presently exhibits manifest inequalities of welfare and, consequently, it is simply a way of translating present injustices into the future. Hediger (2000) proposes an approach that goes beyond traditional conceptions of weak and strong sustainability by integrating principles of basic human needs and Norton (1999) affirms that the core idea of sustainability is best captured as an obligation to maintain options and opportunities for well-being into the future. A similar idea is proposed by Anand and Sen (2000) in the notion of ‘usufruct rights’, which means that each generation has the right to enjoy the fruits of accumulated capital without depleting it. There are also attempts to define rules for the substitutability between natural and man-made capital. For Holdren et al. (1995), a sustainable process or condition is one that can be maintained indefinitely without progressive diminution of valued qualities inside or outside the system in which the process operates or the condition prevails. Daly (1991) affirms that, to be sustainable, the throughput should be limited to a level which is at least within carrying capacity; technological progress should be efficiency-increasing rather than throughputincreasing; renewable resources should be exploited on a profit-maximising sustained yield basis and in general not driven to extinction; and non-renewable resources should be exploited, but at a rate equal to the creation of renewable substitutes. The last principle is similar to the original proposal of Hartwick 12
(1977), who argues that non-renewable stocks can be exploited as other sources are made available and the rent of this use is invested in reproducible capital, so the total return could be sustained over time. To summarise this point about substitution of capital, Baker et al. (1997) consider weak and strong sustainability as intermediate positions, because identify a range of four approaches for the conservation of the environment (called ‘ladder of sustainable development’), as follows: 1) Treadmill view: tenuous emphasis on environmental conservation; 2) Weak sustainable development: economic development as a pre-condition of environmental protection; 3) Strong sustainable development: environmental protection as a precondition of economic development; 4) The ideal model: radical change in the attitude of humankind towards the conservation of nature. As can be seen from the example of the ‘ladder’ above, the convertibility of natural capital into human advantages is subject to a range of interpretations. The elasticity of the definition of sustainable development means that there is also considerable debate over whether it can be effectively translated into practice (Glasby, 2002). Lélé (1991) asserts that the concept has too ambiguous a theoretical basis and its focus on achieving consensus among fractious social groups disable effective implementation. Furthermore, Lélé suggests that perhaps it is better to abandon it altogether by reason of its ‘vacuity and malleability’. Boehmer-Christiansen (2002) points out that sustainable development denies fundamental conflicts and it is very attractive for bureaucrats because invites state intervention in almost all spheres of life. Haughton and Hunter (1994) observe that the obstacles to sustainable development revolve around institutional blockages created and maintained by the major international power players, the rich nations and their support institutions. For Briassoulis (1999), the role of sustainable development planners is excessively influenced by the political and decision-making system and the prevailing planning approaches. Other authors affirm that the problem rests with the origin of the concept. For example, Adams (1990) argues that sustainable development is essentially reformist, because it does not address the political economy and the distribution of power. In the same way, Drummond and Marsden (1995) state that the prospect of operationalizing sustainable development appears increasingly remote, because it is almost impossible for any theory to incorporate social, 13
environmental, economic and moral dimensions. It corresponds with the observation of Hinterberger et al. (2000) who argue that, from the viewpoint of natural science, it is impossible to measure if, or to what extent, the rules of sustainability are observed and, from a social science perspective, it is impossible to implement, accomplish and control the observance of those rules. Haque (2000) affirms that sustainable development tends to overlook certain crucial factors related to environment, such as the structure of international inequality, the acceleration of economic growth based on industrial expansion and the values of development embedded in different cultures and traditions. For Norgaard (1994) the real challenge of sustainability is to ‘reframe the challenge’, because the present goals of sustainable development cannot be met, as long as the world is too complex for us to perceive and establish the conditions for sustainability. Despite the controversies about the concept of sustainable development, one of its main tangible contributions is the potential to bridge the divide between developers and environmentalists (Murdoch, 1993). Normally, the main point of conflict between those two groups is the fact that more sustainable practices can lead to higher financial costs in the short term, although the majority accepts that in the long run these practices would be certainly more efficient. Therefore, most of the disputes surround the costs associated with the transitional phase of implementing more sustainable practices. Likewise, the distribution of such burdens normally incurs unevenly in space and time, and unevenly by different social groups. This implies a focus upon the politics of distribution of gains and costs associated with decisions related to sustainable development (Owens and Owens, 1990). To bridge those two seemingly irreconcilable fields of interests, the search for sustainable development should address not only the management of environmental resources, but also the economic and social structures that affect the use and conservation of the environment. Overall, because of the difficulties to translate the notion into practice, the transition to sustainability, according to O’Riordan and Voisey (1998), requires dynamic, flexible and influential strategic vision and accompanying participatory procedures. For these authors, at the heart of sustainability lies the self-generation of economy, polity and society, but the politics of the sustainability transition demand thoughtful analysis of both equity and justice considerations. The plan for sustainable development has to deal with complex issues that pose additional challenge, such as the asymmetry of power, the fragmentation of the political groups, the inherent uncertainty involved in environmental questions, and the appropriation of the sustainability concept for other political purposes. The additional observation of O’Riordan (2002) is useful: that it is best to regard 14
sustainable development as a constant process of transformation of society and economy towards acting as trustees that maintain and nurture life and habitability for future generations. 2.3 Summarising the Sustainability Concept In an attempt to summarise the vast debate on sustainable development, which was only touched upon above, it can be pointed out that the need for a concept like sustainable development derives from the understanding that most of the prevailing patterns of use and allocation of natural resources are no longer ethically, socially, scientifically or economically acceptable. The origin of the unsustainable condition is not simply a sum of negative impacts impinged upon nature, but it is a problem rooted in the patterns of development, democracy and production. Therefore, the project of translating sustainable development into practice depends upon the transformation in the use and conservation of natural resources, as well as redistribution of burdens and benefits from the appropriation of the environment. Sustainable development is a contemporary search for alternatives that redefine the human requisition, use and conservation of natural resources. That makes sustainability not only a scientific but also a normative concept, which can be expressed by two fundamental principles: First, the search for sustainability is a continuous process towards responses that appropriately satisfy natural and social demands. The sustainability responses should seek to remove contradictions in the relationship between nature and society. It involves dispute resolution between conflicting interests, and should follow transparent and democratic approaches, and Second, a sustainable process or condition is one that can be maintained indefinitely without progressive diminution of valued system qualities. It does not imply that the entire system needs to be maintained in order to be sustainable, but that a certain level of change or adjustment is acceptable, as long as the regulatory functions of the system are not interrupted. 2.4 Water Management and Sustainability Planning, regulation and management of water resources are examples of human activities that can directly benefit from the paradigm of sustainable development. Agenda 21, which is one of the milestones of the global negotiation 15
on environmental conservation, affirms in its Chapter 18 that water is integral part of the ecosystem, a natural resource and a social and economic good whose quantity and quality determine the nature of its use (UNCED, 1993). In the same way, the United Nations Millennium Declaration called upon all member states “to stop the unsustainable exploitation of water resources by developing water management strategies at the regional, national and local levels, which promote both equitable access and adequate supplies” (UNGA, 2000). The new ethic of sustainable development reinforces and extends the main principles of water resources management, such as the equitable distribution of costs and benefits, economic efficiency and achievement of non-economic objectives, and environmental integrity and elimination of irreversible effects (Simonovic, 1996). The importance of sustainable development for water management is demonstrated by the escalating negative impacts created by most of the current forms of exploitation of the water environment (Falkenmark, 2001). The destruction of ecosystems, loss of fish species, dislocation of human populations, inundation of cultural sites, disruption of sedimentation processes, and contamination of water sources have been among the hidden costs of those unsustainable paths of development. Gleick (2000) calculates that the enormous expansion of water resources infrastructure has led to a nearly seven-fold increase in freshwater withdrawals. Worldwide, 1.2 billion people in developing countries lack access to safe drinking water: 2.9 billion do not have adequate sanitation and water-related diseases kill four million children a year (Cosgrove and Rijsberman, 1998). According to Sophocleous (2004), humankind is projected to appropriate from 70% to 90% of all accessible freshwater by 2025. Agriculture is the dominant component of human water use, accounting for almost 70% of all water withdrawals, but many other factors significantly impact the increasing water demand, including population growth, economic growth, technological development, land use and urbanisation, rate of environmental degradation, government programs and climate change. The problem of the exhaustion of renewable resources, such as freshwater, remains critical, because these resources are vulnerable to human overuse and pollution. As pointed out by Sophocleous (2004), water problems ‘at the global scale do not exist’, but all problems manifest themselves at smaller, local scales. The local adoption of adaptive management in water resources based on monitoring and revaluation are essential steps in making water use sustainable. The sustainable, long-term management of water is what Postel (1997) defines as the ‘last oasis’ available for human society. In other words, the 16
management of water should move away from merely expanding supply and towards adopting a responsible control of demand. According to Tyson (1995), the sustainable management of water depends on responses in critical areas. These critical areas are, for example, land-use planning, water use minimisation and recovery techniques, pollution prevention, treatment options, use-related receiving water standards, economic evaluation tools, and capacity building for professionals and general public. However, these are only examples of numerous possible responses, as there remain manifold ways in which society can interfere in the water environment. There is a vast range of critical processes that affect the condition of the water system and, in consequence, the achievement of sustainability. Furthermore, the search for water sustainability does not address only environmental questions, but also institutional, financial, distributive and participatory responses. Sustainability has repercussions for both the environmental dimension of water management and for the socio-economic processes related to water availability and allocation (Schreier and Brown, 2001). The long-term resolution of local water problems needs to be based within wider strategies, as it could be possible that the adoption of local short-term remedies may reduce the benefits of the long-term solutions (Gardiner, 1995). Water management requires integrated and long-term measures, because, up to a certain point, the outcomes of changes in natural resource management practices are not often immediately apparent (Johnson et al., 2001). Svendsen and Meinzen-Dick (1997) add that to cope with contemporary water problems, fundamental changes are necessary in policies and institutions. That is because the controversy involving sustainable water management is, first and foremost, a political challenge and requires the formulation of new basis of management (Hufschmidt and Tejwany, 1993). Due to the complex interaction between human and hydrological processes, it is not easy to put forward a complete definition that summarises the relation between sustainable development and the management of water. As affirmed by Cocklin and Blunden (1998), there are innumerable competing water sustainability interpretations seeking legitimisation. This is because more and more authors have attempted to incorporate aspects of sustainability into the formulation of decision support systems for water management. For Jonker (2002: 719) a suitable definition for the management of water would be “managing people’s activities in a manner that promotes sustainable development”. On the one hand, it is possible to identify interpretations of water sustainability that focus on the balance of resources and the mitigation of 17
environmental impacts, without considering political and participatory requirements in the same level of importance. In an example of a definition centred on the environmental dimension of sustainability, Rennings and Wiggering (1997) affirm that, in order to be sustainable, the harvest rates of renewable resources should not exceed regeneration rates, waste emissions should not exceed relevant assimilative capacities of ecosystems, and non-renewable resources should be exploited in a quasi-sustainable manner by limiting their rate of depletion to the rate of creation of renewable substitutes. Another example is provided by Lundin (1999) who claims that a sustainable water system should not have negative environmental effects even over a long time period, while providing required services, protecting human health and the environment with a minimum of scarce resources use. For ASCE (1998), sustainable freshwater resource systems are adaptive, robust, resilient to uncertain changes, fulfilling positive rates of improvement: implying that the frequency and severity of threats to society are decreasing over time, leaving people more prepared to cope with water stresses when they occur. On the other hand, more holistic interpretations of water sustainability place equivalent emphasis on public participation and on the relation between water management and the overarching aspects of sustainable development. Legge (2000) points out that water sustainability is tied up with good regulation, through access to information, consultation and participation in decision-making. According to this holistic view, the agenda of water sustainability must include social and environmental issues that are not regularly considered in the traditional management process (as pointed out by Dourojeanni, 2000; Rauch, 1998; and Tortajada, 2001). For Bernhardi et al. (2000), sustainable water management should be addressed from a broader perspective than focusing only on the resource, in a way that managers also become acquainted with a broader set of analytical concepts for problem management. Any interpretation of sustainable water management entails the consideration of long-term consequences of present action, as well as the consideration of external pressures, risks and uncertainties (Varis, 1999; Varis and Somlyódy, 1997). It is relevant to note that, although some level of uncertainty in the understanding of the management water systems is inescapable, it must not hinder the pursuit of water sustainability (Clark and Gardiner, 1994). To cope with complexity and uncertainty, Kay (2000) affirms that it is necessary to choose a dynamic, rather than a static view of the sustainability concept, that is, sustainability as a process rather than as an end-point. Likewise, Newson et al. (2000) suggest that it is not necessary to maintain the entire water system in order 18
to be sustainable, but certain level of change or adjustment is acceptable, as long as the ‘spontaneous regulation functions’ are not interrupted. An important aspect of environmental management, which is not always properly understood, is that the search for sustainable development needs to take into account issues of spatial scale for the formulation of management responses. For instance, Rydin et al. (2003) affirm that the new agenda of research on sustainability assessment and response must emphasise the sub-national level and the understanding of the local context. Backhaus et al. (2002) reinforce the need for long-term monitoring of landscape dynamics that supports the understanding of water processes and the examination of responses. In the same way, Ferrier and Edwards (2002) point out that the sustainability of water requires an appreciation of the temporal and spatial assessment of the resource. In this regard, water sustainability is a privileged case in terms of environmental management, inasmuch as the water processes take place fundamentally in the river basin, a space naturally created by the hydrological cycle. It should be noted that the river basin comprises the area naturally drained by the main river and its tributaries. Conventionally, the river basin is the same as a large catchment or watershed. The word watershed is also used to refer to the ridgeline or elevation that defines the catchment. River basins are functional geographical areas that integrate a variety of environmental processes and human impacts on landscapes (Aspinall and Pearson, 2000) and are, therefore, the appropriate units for the sustainable management of water. Gardiner (1997) adds that sustainability principles need to be extended to our use of rivers and the quality of river landscapes provides an identifiable measure of sustainability. According to Jones (1997), the problems of quantity and quality in water supply are now seen as a single entity and, at least since the 1970s, it has been recognised the principle that the ‘natural river basin’ should be the basic unit for water administration and development. Therefore, “by recognizing the essential unit of the cycle of water use within the administrative structure, it may be possible to select alternative solutions more easily, or to reduce reprocessing costs” (Jones, 1997: 03). Ioris (2001: 24) defines the sustainable water management at the river basin level as a “continuous process of managing river basin natural and artificial resources, considering the human dependency on the cyclical flow of water as implication for integrated efforts and environmental stewardship”. According to Lee (1992), sustainable watershed management requires knowledge about ecologically effective forms of social organisation and a major reason for the failure of human societies to develop sustainable resource management activities 19
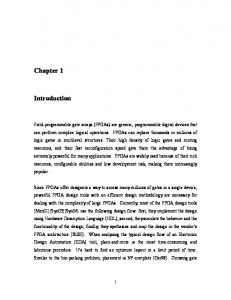
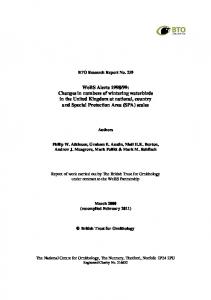
has been the limitations on their ability to acquire and process ecological information. Ecological and socio-political processes that affect collective action and property rights related to water should, thus, be understood at the socialspatial scale of the river basin (Swaloow et al., 2001). The physical territory, together with a constant movement of society and nature, gives to the river basin the characteristics of ‘absolute’ and ‘relative’ spaces. It means that the river basin is both a physically determined space as well as a socially constructed space. According to Soja (1989: 5), “spatiality is simultaneously a social product (or outcome) and a shaping force (or medium) in social life”. Space is dynamic and social relations are simultaneously and conflictually space-forming and space-contingent, there is a growing awareness of the possibility of spatial praxis, an increasingly recognised need to rethink social theory as to incorporate more centrally the fundamental spatiality of social life (Soja, 1989). The river basin is an ‘absolute space’ affected and transformed by the constant reconstruction of ‘relative spaces’ within or beyond its boundaries. There is, thus, a physical construction of a river basin by anthropogenic changes in land use, water abstraction and diversion, inter-basin transfers, sedimentation and release of substances on water, dredging and channelisation, etc. At the same time, there is also a construction of meanings about the river basin is consequence of socio-economic activities, transportation alternatives, material production, and cultural and linguistical representations. Swyngedouw (1999) observes that traditional approaches tend to separate the various aspects of the hydrological cycle into discrete and independent objects of study. This neglects the fact that nature and society are deeply intertwined, what is demonstrated by the ‘hybrid character’ of water landscape (called ‘waterscape’), made evident by the intense human intervention in the water cycle. The phenomenon of hybridisation between society and nature in a river basin is defined as the production of ‘socionature’. According to this concept, society and nature are in permanent metabolism, one affecting and being affected by the other. Nature is not the mere substratum for the unfolding of social relations, but is an integral part of the process of production. The use and conservation of water is not unidirectional, but it is always a relation condition shaped by economic and social determinants. Sustainability implies a non-contradictory condition of the ‘socionature’ relation. In this sense, sustainability means that nature and society are not external to each other, but dialectically transformed. In other words, a sustainable situation for the use and conservation of water depends on society recognising itself as intimately related to the existence of the water system. The sustainability of water resources 20
is fundamentally constructed through the removal of barriers that prevent the achievement of this unified condition between the demands of human groups and the requirements of the water environment. Figure 2.1 summarises the complexity of processes taking place in the catchment space, as well as the connections of the catchment with regional and sub-catchment scales that affect the sustainability of the water environment.
Figure 2.1: Catchment Processes and Interactions It is important to observe that because of specific local demands, the sustainability condition may not necessarily be uniform throughout the river basin, but in some sub-units a higher level of environmental impact may be acceptable. Within certain limits, the decision to allow negative impacts in certain parts of the catchment is still in accordance with the goals of sustainable development (as defined in the last Chapter section). For instance, a water supply dam can be built in one section of the river basin, therefore producing local negative impacts, to benefit the rest of the catchment. That is what Brown and Harper (1999) define as the outcome being bigger than the sum of the parts and the construction of sustainable development incorporating a dialogue between local, sectoral demands and the progress of the whole. To be able to make decisions on this balance between conservation and use of the catchment 21
environment, it is essential that stakeholders are democratically involved in the decision-making process. Water management must involve the river basin community in an effective way to promote the sustainable use of water. Democratic approaches to water sustainability are often termed community-based catchment management, which involves an adaptive planning framework that first seeks consensus on environmental planning, its implementation and its operation, maintenance and monitoring (van Horen, 2001). Naiman (1992) affirms that watershed management requires strong co-ordination of human and natural issues, as technology cannot resolve problems when it is isolated from a fundamental understanding of the properties of natural, social, and ecological systems. Furthermore, Gonzales-Anton and Arias (2001) argue that river communitybased management implies reallocation of power among administrative bodies and the definition of the role of the competent authorities. The catchment scale is the fundamental scale of intervention to establish sustainable trade-offs between use and conservation of resources, as well as for determining compensation measures. In many cases decisions on the use and conservation of water will involve consideration being given to the interdependence between the catchment and national or global scales of intervention. Buller (1996) affirms that the British and French experiences in water management along the 20th Century were precursors of river basin management and sustainability, although facing successive stages of conflicts between local and regional water management approaches. To cope with such interdependence, Therivel et al. (1992) propose a sectoral or regional sustainability-led assessment of plans and programmes affecting the environment. The management of water is a good example of a sectoral demand that may require the connection between catchment, regional and national scales of assessment. Furthermore, Elhance (1999) emphasises that hydrological cycles are primary examples of phenomena that transcend national borders. In the case of cross-border catchments, international co-operation is fundamental for the sustainability of water management. 2.5 Summarising Water Sustainability Form the various concepts described above, it can be inferred that the sustainability of water systems is related to good water quality and satisfactory resource availability, equitable allocation of resources, rational and judicious use, public engagement and adequate institutional framework. The sustainable 22
management of water is a social construction, a gradual, iterative and dialectical revision of dominant trends and disruptive driving-forces. There are social, economic and environmental dimensions that need to be considered together. The sustainability of water resources is constructed through the removal of barriers that prevent the achievement of common conditions that serve both the demands of human groups and the requirements of the water environment. The core requirements of water sustainability can be expressed by the following three principles: First, the search for water sustainability is the application of sustainable development principles to resource allocation and management in order that nature conservation and social demands are concurrently and appropriately satisfied. Second, the sustainable use and conservation of the water environment presupposes the indefinite continuation of resilient catchment systems and the maintenance of critical ecological functions. Third, water sustainability requires a fair and equitable distribution of opportunities across groups and generations allowing all to benefit from the shared water environment, what must be achieved through participatory approaches, adaptive management and robust institutional framework. These three principles of water sustainability will be relevant for the development of the framework of indicators and also for the analysis of indicator results in the following chapters. 2.6 Sustainability Assessment and Indicators The relevance of sustainable development for environmental policy and management means that there are increasing attempts to assess and compare sustainability trends. The assessment of water sustainability is fundamentally a critical evaluation of trends and tendencies in the use and conservation of the catchment environment. It is a positioned analysis of the geography of water development in a specific catchment and can make use of a range of complimentary research tools (including quantitative and qualitative methods). Bosshard (2000) describes sustainability assessment as a heuristic procedure, involving socio-cultural discourses in relation to practical experiences. Sustainability assessment is, therefore, an opportunity to critically reflect upon current practices and search for alternatives. Starkl and Bruneer (2004) affirm that 23
an integrative assessment of sustainability should force decision makers to make their chosen premise more visible and adaptable to the circumstances of a specific project in a way that is accepted by the stakeholders. Such an assessment is normally carried out using appropriate frameworks of sustainability indicators (Malkina-Pykh, 2002). Indicators must be useful for research purposes, as a source of information for the general public and specifically to strengthen environmental policy (Brugmann, 1997). Agenda 21 (Chapter 40) stated that “indicators of sustainable development need to be developed to provide solid bases for decision-making at all levels and to contribute to the self-regulating sustainability of integrated environmental and development systems” (UNCED, 1993). According to the EEA (2003), sustainability indicators are variable, and act as a pointer, or an index of a complex phenomenon. Maclaren (1996) affirms that sustainability indicators can be distinguished from simple environmental, economic and social indicators by the fact that they are integrating (linkages between economic, environmental and social dimensions), forward-looking (measuring progress towards achieving intergenerational equity), distributional (measure not only intergenerational equity, but also intragenerational equity), and developed with input from multiple stakeholders. For Shields et al. (2002) sustainability indicators can help package complex information into a usable form for public policy. Bossel (1999) argues that indicators should provide essential information on the viability of a system and its rate of change, and on how that contributes to sustainable development of the overall system. There is, currently, abundant number of approaches aiming to assess and communicate sustainability. Most key sustainability indicators are quotient (ratios) and measurements are normally independent of scale (Gillbert, 1996; Nilsson and Bergstrom, 1995). In some cases, individual environmental processes have separate treatments, while in others the processes are considered together to produce aggregate indices. For OECD (1998), the decision to choose appropriate indicators for sustainability assessment involves a balance between complexity (number of indicators to explain the system) and compromise (sustainability framework must allow the analysis of trade-offs between indicators). Briassoulis (2001) divides the evolution of sustainable development indicators into three phases:
24
1) Mid 1980s: environmental indicators as quantitative, descriptive measures of either human pressures on the environment or of environmental conditions (mono-disciplinary approaches); 2) Early 1990s: focus on green accounting; differentiation between indicators related to strong or weak sustainability; inclusion of social indicators; assessment as a continuous process (multi-disciplinary); and 3) Most recently: environment, economic and other dimensions of sustainable development considered together; more integrated and combined indicators; interest from global to local or urban, and even micro-level. It is fundamental to note that there are theoretical and operational difficulties in objectively demonstrating progress towards sustainable development. Friend (1996) affirms that the ontology of sustainable development indicators demonstrates that they represent more than just an ad hoc set of presumptive data points, but are still a great simplification of the reality. The assessment of sustainability must consider the fact that we do not really know exactly how the systems under analysis perform (Hardi and Zedan, 1997). Levett (1998) observes that sustainability indicators bring the challenge to articulate worldviews, interconnecting environmental and social variables. Stevenson and Ball (1998) affirm that the assessment should include subjective process of cultural traditions and the objective analysis of resource use. Crabtree and Bayfield (1998) state that sustainability indicators should be developed to link human activity to environmental change and policy response, although indicators have limitations as foundation for informing policy. Riley (2001a) points out that sustainability indicators are related to patterns of change and are only measurable if sufficient periods of time are monitored. These analyses coincide with the observation of Pinfield (1996, 1997), who sees little evidence that sustainability indicators lead to substantial shifts in policy at national or local level, because a greater integration of environmental, social and economic policies is necessary. Riley (2001b) identifies some critical problems with sustainability indicators, such as the numerous frameworks which have been proposed, and most of which have no direct correspondence. Furthermore, indicators are often numerous but inconsistent across studies, often based upon different definitions; sometimes presented merely as data values or variables with no regard for their specific role in measuring change and thresholds and reference 25
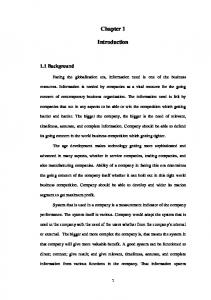
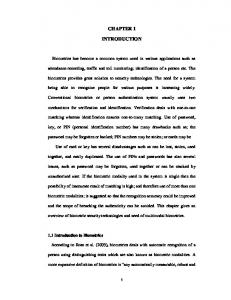
points have not been identified. At the same time, indicators are frequently proposed without rigorous testing on a range of data sets; compound indicators involve combination of indicators for different system components, often with weights that are meaningless; and components interact to each other, but their patter of interaction are unclear. Bell and Morse (1999) argue that indicators have played a limited role in management and the setting of policy and, in the last two decades, efforts were placed on developing indicators for measurement rather than on using them. In an attempt to classify the vast array of proposed indicators, Hanley et al. (1999) recognize three main groups, namely economic indicators (e.g. water consumption per capita), socio-political indicators (e.g. number of deaths associated with deficient sanitation) and environmental (e.g. oxygen depletion). Taking a different approach, both Atkinson et al. (1997) and Pearce and Barbier (2000) classify the methods into weak sustainability indicators (e.g. green national account and genuine savings) and methods of strong sustainability (e.g. species richness, ecosystem resilience and ecological carrying capacity). For Niemeijer (2002), indicators can be divided into data-driven approaches (whereby data availability is the central criterion for indicator development and data is provided for all selected indicators) and theory-driven approaches (focused on selecting the best possible indicators from a theoretical point of view, while data availability is only considered one of many aspects to take into account). According to Bell and Morse (2001), sustainability indicators can be either quantitative and explicit (i.e. clearly stated and with a defined methodology) or more qualitative and implicit (i.e. ‘understood’ to apply in vaguer terms, with no defined methodology). The first group is represented by the ‘reductionist paradigm’ of sustainability assessment, which means a reduction of information conveyed and presentation of information according to the assumptions and mindset of the researcher. The second group belongs to the ‘conversational paradigm’, which comprises those attempts of sustainability assessment adopted in discussions over political power and participatory learning or action. There are innumerable intermediate possibilities between those two types of sustainability indicators. Table 2.1 summarises those different methodologies behind the development of sustainability indicators. A more recent publication of the same authors (Bell and Morse, 2003) claim that the future of sustainability indicators is in the hybridisation of both groups, in a continuum of possible indicator expressions and associated research methodologies. This is called the ‘multiple perspective’ of sustainability indicators. 26
Table 2.1: Implicit and Explicit Dimensions of Sustainability Indicators Type of methodology behind Example indicators Highly defined techniques for measuring car density based on observation at key junctions or car sales per year Explicit SIs based on a defined and replicable methodology Allows replication of measurements so as to follow time-series measurements or for data checking Less well defined or published techniques (relative to 1) for SIs based on a methodology that measuring car density is stated but not well defined, and therefore open to being assessed Time-series data or validation in different ways with different may not be possible as results methodologies could be different Implicit SIs not based on a defined and published No explicit methodology. methodology as such, but one’s Equates more to an impression perception (based on experience, of ‘gut feeling’ as to what is media coverage, pressure group happening with car density statements, etc.) suggests that a particular trend is occurring Source: Bell and Morse (2001) Among the many informational levers indicators could participate to, the following usages have for instance been identified by Aal et al. (2002: 32): indicators for the clarification of development trends (trend analysis); indicators comparing performance (benchmarking); indicators for reporting upwards in a decision-making hierarchy (reporting); indicators for clarifying the impacts of planed initiatives and actions (impact assessment); indicators for registering and evaluating the effects of executed initiatives (evaluation); indicators for registering and monitoring the development of a condition (environmental control). There are listed in Table 2.2 examples of sustainability assessment approaches.
27
Table 2.2: Examples of Sustainability Assessment Methodologies Barometer of Sustainability Prescott-Allen, 1995 Material Intensity of Products and Services (MIPS)
Hinterberger and Schmidt-Bleek, 1999; Lewan, 1999
Index of Sustainable Economic Welfare (ISEW)
Daly and Cobb, 1989
Ecological Footprints
Wackernagel and Rees, 1996
Sustainability Gap
Ekins and Simon, 1999, 2000
Indicators of Sustainable Development (national) Environmental Sustainability Index (national) Promoting Action for Sustainability Through Indicators at the Local Level in Europe Sustainability Indicators Research Project Indicators of Sustainable Development for Scotland Series of Alternative Indicators for Scotland
UNCSD, 2001 YCELP, 2001 Pastille, 2002 LGMB, 1995 Scottish Executive, 2003a Hanley et al., 1999
Aberdeenshire Sustainability Research Trust
Copus and Crabtree, 1998 ASRT, 2002
National Brazilian Sustainability Indicators Indicators to Assess Urban Sustainability, Brazil
IBGE, 2002 Fehr et al., 2004
Áridas Project in the Semi-Arid Brazilian Northeast
Vieira, 1998
Sustainability of Remote Rural Scotland
López-Ridaura et al., 2002 ; Masera et al., 1999 Barrera-Roldán and Sandívar-Valdés, 2002
MESMIS Project, Mexico Sustainable Development Index, Coatzacoalcos, Mexico
On the desirable characteristics of adequate sustainability indicators, Harger and Meyer (1996) suggest that these should include simplicity, scope (cover environmental, economic and social issues), quantification (measurability), 28
assessment (should allow trend analysis), sensitivity (sensitive to change) and timeliness (should allow timely identification of the trends). Moreover, there are other criteria recommended for selecting indicators. For instance, Walmsley (2002) maintains that indicators should be simple, quantifiable and communicable. Bossel (1999) argues that the number of indicators should be as small as possible, but not smaller than necessary. According to Bell and Morse (2003), an indicator should be specific (must clearly relate to outcomes), measurable (must be quantifiable), usable (practical), sensitive (must readily change as circumstances change), available (relatively straightforward to collect the necessary data) and cost-effective (should not be a very expensive task to access the necessary data). Interestingly, the Local Government Management Board (mentioned in the above table) was a pioneer project carried out by 10 local authorities in the United Kingdom. The average number of indicators was 23 per site and the total number of indicators used was 160, divided into 13 themes. Among the 160 indicators, there are 17 directly related to water resources use and conservation, including the most curious water sustainability indicator ever formulated: the number of domestic ponds with frogs… Based on such requirements and on the examples mentioned above, the critical qualities of sound indicators of sustainability can be summarised as:
Grounded on robust scientific and technical basis Include manageable number of variables Require data that are readily available or easily made available Flexible to utilise local data and local thresholds Relate the present environmental condition with past processes Are forward-looking and capable of informing policy-making
This list of critical requirements for sustainability indicators will underpin the development of indicators in the next chapters of this study. 2.7 Key Themes for Water Sustainability Assessment The search for water sustainability deals with multiple problems involved in the management of the river basin. In most cases, there is a complex interconnection between the various causes of the sustainability problems. This interconnection creates difficulties for the analysis of the pressures and 29
formulation of solutions. Therefore, to facilitate the understanding of the sustainability demands, the water management problems can be organised by groups of themes. This identification of themes constitutes a schematic representation of critical processes affecting sustainability (although many interrelations exist between processes). Following such approach, an interpretation of the crucial water management problems that prevent the achievement of water sustainability is detailed below. This summary is based on the available publications and reported experiences of water management at the catchment scale. It constitutes a generic compilation of themes, which regularly occur in most catchment management experiences. The summary includes themes that are equally distributed between the three dimensions of water sustainability (environmental, economic and social). Despite the fact that this is a subjectively developed, it provides a framework of the key management demands and will facilitate the discussion on indicators of water sustainability later in this book: 2.7.1 Degraded water quality Human activities interfere in water quality at either a concentrated scale (point sources) or at a relative smaller and scattered scale (non-point/diffuse sources). The extension of the human impact is directly dependent upon the natural characteristics of the river system and the intensity of the intervention. However, due to the importance of water for life maintenance, ecosystem functions, standards of human existence and economic activities, the conservation of good water quality is a fundamental pillar of the construction of sustainable development. According to Perry and Vanderklein (1996), the ways in which a society manages water quality is a telling reflection of political, cultural, and economic processes within that society. It means that the water condition is ultimately the outcome of social behaviour, preferences and attitudes. The quality of water is characterised by a range of concentrations and reactions of organic and inorganic substances. The dynamic nature of the water environment, means each reaction is specific to space and time. Therefore, the characteristics of water can demonstrate significant variation when comparing different seasons or years, as well as by comparing upstream and downstream locations. Every river system has particular hydrological characteristics and physico-chemical patterns, which essentially depend on climate, geology and geomorphology. Likewise, the water environment is a complex system with nonlinear relations between biotic and abiotic components. Despite such natural 30
complexity, a sustainable condition of water quality requires the long-term maintenance of levels of chemical and biological components in order to meet environmental and societal water objectives. 2.7.2 Excessive abstraction of water resources A sustainable level of water abstraction presupposes limits to prevent negative impacts on the spontaneous regulatory functions of the aquatic environment. Water must be allocated and used in a way that does not compromise human health or the aquatic ecosystem (Lallana et al., 2001). To be sustainable, the volumes allocated for human use should not disrupt river flows, stocks accumulated in lakes, reservoirs and wetlands, as well as water stored in aquifers and glaciers. It means that water abstraction must respect the hydrologic features of the river basin, not creating barriers to the recovering capacity of natural processes. The specific amount of water that can be used or removed from the water bodies to satisfy those human activities depends on the ecological sensitivity of the river basin or the stocks of groundwater. The management of abstraction for the achievement of sustainability specifically requires the preservation of minimum flows and natural patterns of the hydrological regime. To achieve this sustainable level of water abstraction, a range of integrated actions related to the management of demand can be used. The management of water abstraction according to the environmental limits is not only a technical issue, but it is rather part of social negotiation, often associated with political disputes (Metha, 2003). Demand management includes reduction in water consumption, reuse of water, and reduction in distribution losses. Syme et al. (1999) affirm that a fair decision-making processes is of paramount importance to community acceptance of decisions about quantities of water allocated for individual uses. 2.7.3 Induced variability in the water regime Human activities can modify the water regime through either local or global forms of environmental change. The former include a number of localised human interventions in the river basin (such as land use change, land sealing, engineering constructions, river channelling, water diversions, soil erosion and channel siltation, afforestation or wetland reclamation) and the latter include broader anthropogenic impacts on the climatic regime. Nevertheless, the management of water should not produce pressures that result in the modification of regulatory functions. It means that human action should not modify the regular pattern of 31
critical water processes. In particular, the natural system variability between seasons and periods of years should be maintained. This natural succession of high and low flow processes is critical for the preservation of ecosystem functions, and consequently for the achievement of sustainability. A sustainable water system is resilient enough to return to normal, longterm regime after exceptional periods of excess or scarcity. The human interference can reduced system resilience and, thus, magnify the impacts of extreme events, such as floods and droughts. The human interference in hydrological processes can cause adverse periods not only to become recurrent, but can also aggravate their negative consequences. Newson (1994: 64) argues that the human intervention can alter both the ‘vulnerability’ and the ‘hazard’ of critical events. Aggravated extreme events are the result of a combination of meteorological, physical and human factors. For example, changes in the landscape can lead to more intense floods and over abstraction of water can lead to more severe droughts. 2.7.4 Inefficient allocation and use of water Sustainability requires efficient use of water that satisfies both environmental and socio-economic requirements. The challenge for achieving an efficient use resides on the fact that water resources exhibit the characteristics of both public and private goods (Savenije, 2002). The characteristic of public goods means that the benefits that one person derives from water do not reduce the possibility of someone else benefiting. On the contrary, private goods are only available for individual consumption, which means that when one person consumes a unit of water, that unit is not available for another person to consume. According to Savenije (2002), this duality makes water a unique commercial good: it is scarce and fugitive; it is a system; it is bulky; it cannot be substituted or freely traded; and it is complex. Wichelns (1999) emphasises that water-use efficiency is achieved when limited resources are allocated and used in a manner that generates the greatest net value (i.e. to guarantee that resources are used to generate the largest possible net benefit). Cai et al. (2001) affirm that enhanced efficiency can be achieved through both physical and managerial measures. Examples of approaches that contribute to an efficient use of water are the metering and charging of water (Dalhuisen et al., 2003). However, Savenije (2002) points out that the simple application of regular economic theories to water resources management is not always efficient. Similarly, Pearce (1998) observes that there are many economic 32
actions that can be taken which will benefit the environment and for which there is no particular need for philosophising or quantification, economic or otherwise. 2.7.5 Wastage of water The wasteful use of water resources is a clear contradiction of the sustainable management of water systems, because it involves the removal of resources from the environment without the production of correspondent socioeconomic benefits. In this regard, Merrett (1997) points out that the supply of water for the domestic, agricultural and industrial sectors are all part of planning for a sustainable society, but must also include water husbandry through the reduction of supply losses and demand management. Each sector requires amounts and quality of water according to the nature of the use. Moreover, regardless of the specific nature of the demand, there are best management practices that can be adopted by each user. Those best practices contribute to save water and, therefore, reduce the human impact on the environment. The management of water demand through the reduction of waste and improvement of water productivity are important factors for the protection of the environment due to reduction in abstraction. A number of potential measures that can reduce the level of water abstraction, such as reduction of leakage in distribution systems and improvements in production processes are normally available. To improve the productivity of water use, the search for technological improvements by each user sector, such as the substitution of input materials, process redesign, and final product reformulation is particularly important. Exchange of experiences between stakeholders can provide a framework for technical innovation, although in practice there are substantial difficulties to achieve collective responses from the groups of water users (Margerum and Whitall, 2004). 2.7.6 Inadequate institutional framework An inadequate set of institutions creates contradictions that obstruct the realisation of the sustainable management of water. Dodds (1997) argues that sustainable development must have primary focus on the cultivation of appropriate institutions. Sustainable development requires institutions that facilitate co-operation and co-ordination between stakeholder sectors (Wood et al., 1999). In terms of water management, the institutional framework is the combination of legislation and regulation, policies and guidelines, administrative structures, economic and financial arrangements, political structures and 33
processes, historical and traditional customs and values, and key participants or actors (Mitchell and Pigram, 1989). This institutional framework defines the patterns of intervention and conservation of water in the river basin (Jong et al., 1995). Institutions also refer to the manner in which stakeholders interact with organisations, the processes by which decisions are made, and the way in which activities are undertaken to implement their goals (Challen, 2000). Lord and Israel (1996) consider institutions those rules that serve to liberate involved actors for the improvement of water management. The role of institutions for sustainable development is pivotal in achieving growth and improved distribution of income and wealth, in understanding environmental degradation and in seeking improved policy (Veeman and Politylo, 2003). Livingston (1995) argues that the institutional arrangement should set the ground rules for resource use and facilitates the achievement of economic and social goals. An adequate institutional framework must also foster local capacity building and reduction of external human resources (Lamoree and Harlin, 2002). One fundamental aspect of the institutional framework is the legislation related to water management in response to sustainability demands (Wouters, 2001). Also the improvement of local human capacity is a strategic element in the sustainable development of the water sector (Hamdy et al., 1998). 2.7.7 Inequitable water services The inequitable access to good quality water resources is also an indication of a lack of sustainability. The social dimension of water sustainability requires universal and reliable water supply and sanitation services to all groups of stakeholders in urban and rural areas (Komives, 2001). Equitable water services constitute an important element of social justice, which is a fundamental element of sustainable development (Agyeman and Evans, 2004). Harvey (2001) argues that deficient public services are not exclusively a problem of physical shortage of resource, but normally the result of unequal allocation and distribution of opportunities. It means that scarcity presupposes certain social ends, in the sense that, in most cases, scarcities do not arise out of nature but are created by human activity and managed by social organisations. To be equitable, any charging scheme must treat different groups differently, as long as lower income households are comparatively more vulnerable to water shortage and service cuts due to difficulties to cope with charges (Herbert and Kempson, 1995). Following the approach proposed by Rawls (1999), social justice does not mean equal, but fair distribution of responsibilities for environmental impacts. 34
According to this interpretation of justice, responsibilities should be allocated in the direct proportion to the damage caused and in the indirect proportion to the economic and social status of the person causing the damage (i.e. richer and stronger social groups should bear a larger proportion of burden). Bakker (2001) also points out the difference between ‘economic equity’ (the principle that users of a utility should pay, as near as possible, the costs they individually impose on the system) and ‘social equity’ (the principle that users should be charged according to their ability to pay). The three dimensions of sustainability mean the sustainable management of water needs to reconcile both the economic and the social forms of equity. Furthermore, Kansiime (2002) affirms water equity is directly related to public participation, bottom-up decision-making and conservation attitudes that reduce water use. 2.7.8 Limited well-being related to water Poor quality of the water environment affects many aspects related to human well-being, such as health, economic prosperity and personal contentment. Despite the fact that some elements of well-being are mainly subjective, such as personal satisfaction, most features of well-being can be objectively described, such as the fulfilment of healthy living conditions. Lundqvist (2000) states that lack of access to safe water is a significant drawback for human well-being. One of the main reasons is the fact that many infectious diseases, health problems and disabilities are directly related to insufficiency of water quantity and quality. High levels of well-being are also associated with precautionary measures to cope with adverse periods of floods and droughts. In addition, there is a direct correlation between equity and well-being, because degraded water quality and quantity are normally associated with poverty in urban and rural areas (Hillman, 2002). It means that the improved condition of the water environment is normally not fairly distributed through social groups, but the most degraded environmental condition is concentrated in deprived settlements. There is not a fixed, universal figure for the appropriate volume of water per capita for the promotion of well-being, because different countries and cultures have dissimilar factors to determine the demand of water. For Beukman (2002), the well-being created by water can be taken as the degree to which the needs and wants of the population are being met. Moreover, human preferences can greatly vary across cultures or regions, with a relationship between social sustainability and the more subjective and cultural aspects of local distinctiveness (Hargreaves and Webster, 2000). The understanding of the relationship between the physical extent of water availability and the level of household and community 35
well-being induce more rational and equitable decisions about water allocation (Sullivan, 2001). On the other hand, after the satisfaction of basic needs and requirements for economic activity, additional water use does not lead to additional well-being, but becomes luxurious and unjustifiable. 2.7.9 Undemocratic decision-making Gomez and Nakat (2002) point out that the traditional approaches to community participation in water and sanitation projects have been distinctly topdown and undemocratic. There exist several factors that can obstruct the participation of water stakeholders, such as the paternalistic posture of authorities, enduring and unresolved conflicts between groups, excessive pressure for immediate results and disinterest within the beneficiary community. However, if rivers are to be managed sustainably and the potential to resolve conflicts of use realised, the general public must be more involved in their management (House, 1999). The justification of public participation for water sustainability is due to both the right to participate and the responsibility to collaborate in the management of water systems. Public participation requires the active and coordinated involvement of water uses and civil society in the various scales of water regulation, planning and management. Participatory decision-making is expected to improve system performance by incorporating users into the process as a way to encourage changes among beneficiaries themselves. It ultimately facilitates the implementation of policies and projects, reinforces changes in established practices and offers alternatives to deal with complexity and uncertainty (Mosley, 1996). At the same time, the interaction enables exchange of information which can lead to a better understanding of the ins and outs of the specific situation and in this way contribute to public support (van Ast and Boot, 2003). Smith (1994) observes that public involvement is a way of promoting greater environmental awareness and understanding by local communities. It is ultimately an attempt to build ‘environmental citizenship’ (i.e. the right to benefit from the environment and the duty to enhance environmental protection). 2.8 Examples of Approaches to Water Sustainability Assessment The list of themes set out in the last section serves as a basic framework for the assessment of water sustainability. After the identification of crucial themes, the next step for the assessment of sustainability is the formulation of methodologies that appropriately combine water related indicators (Kerr and 36
Chung, 2001). The United Nations, through the UNWWAP (2003), stated that “indicators must present the complex phenomena of the water sector in a meaningful and understandable way, to decision-makers as well as to the public. (…) New indicators have to be tested and modified in the light of experience”. In the same way that the assessment of sustainable development is subject to controversy, there are conflicting approaches proposed for the assessment of water sustainability. Each method is based on a number of assumptions and is designed to fulfil specific objectives: this will be discussed in more detail below. One of the most common problems is the restricted focus on hydrological and environmental aspects of water management, neglecting the equally important economic and social dimensions. Loucks and Gladwell (1999) propose a methodology to consider hydrological and environmental aspects of the water management systems (also available in Loucks, 1994, 1997 and 2000; Loucks et al., 2000). This landmark approach is based on previous works of Hashimoto et al. (1982) and Pezzey (1992), and has since than been adopted, for example, by Kay (2000) and Kjeldsen and Rosbjerg (2001). The methodology expresses the level of sustainability as separate combinations of reliability (the probability that any particular value will be within the range of values considered satisfactory), resilience (the speed of recovery from an unsatisfactory condition or the probability that a satisfactory value will follow an unsatisfactory value) and vulnerability (a statistical measure of the extent or duration of failure, should a failure occur). This approach deals with only three indicators, and because of this it has the advantage of being simple and easily replicable. However, the method has the disadvantage of reducing the sustainability question to three fixed principles (resilience, reliability and vulnerability) without addressing the core debate about equity, social responsibility and trade-offs between the constituting dimensions of sustainability. A comparable approach that focuses exclusively on physical parameters of water management is the Physical Unsustainability Index (PhUI), which was developed by Aguirre-Muñoz et al. (2001) to measure the utilisation of the most limiting environmental resources. The PhUI considers mass balance and rate of water use by sector. Likewise, Xu et al. (2002) proposed a model that assesses the balance between demand and supply of water. Kondratyev et al. (2002) put forward a method related to the use of water and the ecological condition of the water body. This approach can be useful for planning and decision-making regarding allocation of permissions to use water resources. However, 37
sustainability is narrowly understood in those three approaches as merely the satisfaction of future water balance demands. There are also studies that address water sustainability at the national level, such as the Eurowater Project described by Correia (2000) and applied to France, the United Kingdom, Germany, Portugal and the Netherlands. Water sustainability is taken as a multi-dimensional concept identified with three key dimensions: environment, economics and ethics. However, there are no specific indicators in this approach, only generic themes of sustainability criteria. A similar national assessment of water policy was proposed by Kheireldin and Fahmy (2001) for evaluating long-term national strategies in Egypt, including indicators of five main categories: food, economy, water, socio-economy and environment. The disadvantage of this method is that only a small number of indicators are directly related to water questions, while for the majority of indicators the connection with water is indirect (e.g. employment per economic sector or use of pesticide by farmers). In another example, Bell and Morse (2003) considered water resources management as one of the five themes of the sustainability analysis of the island of Malta (see Table 2.3). These authors applied the SPSA approach for the production and development of sustainability indicators in Malta (SPSA stands for ‘systemic and prospective sustainability analysis’, which is an organised methodology with ‘12-point processes’ divided into the phases of ‘reflection’, ‘connection’, ‘modelling’ and ‘doing’). SPSA is an improvement of the previous approach SSA (‘systemic sustainability analysis’, Bell and Morse, 1999), “with ‘prospective’ stressing extrapolation in order to consider multiple scenarios” (Bell and Morse, 2003: 80). Water quantity was one of the five themes of the sustainability analysis under the influence of the Mediterranean Action Plan in Malta. This study addressed water management at the national scale, which was the appropriate scale for the unique characteristics of the country of Malta (i.e. a small territory of only 316 km2, river runoff mainly during the rainy season, and water supply basically depending on groundwater, desalination plants and water recycling). Another problem related with the catchment approach in this particular country is lack of data, since there are only five gauging stations in the 107 Malta and Gozo semi-arid catchments (Malta, 2002).
38
Table 2.3: Example of Sustainability Indicators Applied at the National Level Indicator Parameters and Units Chloride level (mg/l) Quality of drinking water Nitrate level (mg/l) Use Index % of total users Water consumption Litres per capita per day Pollution in groundwater Nitrate levels (mg/l) Water affordability Currency units per m3 Recycled water % of water consumed Quantity of produced water Million m3/year Piezometric levels Metres Leaked water m3/year Source: Bell and Morse (2003) Likewise, the British government has produced annual reports with core indicators of sustainable development (called ‘Quality of Life Counts’), which have been brought together again with updated data and assessments of progress. This report provides a baseline assessment, providing a benchmark against which future progress can be measured. Where specific targets do not exist, the aim is for the headline indicators to move in the right direction over time. Within Quality of Life Counts the indicators are grouped into six ‘themes’ (including ‘managing the environment and resources’) and 18 ‘families’ (including ‘freshwater’). The results for the 2003 update are presented in Figure 2.2 (symbols represent the outputs of each indicator and are explained in the legend below). Those results indicate improvements, since 1990, in both chemical and biological river quality, reduction in abstractions for public water supply and reduction in leakage (DEFRA, 2002a, 2002b; DETR, 1999a).
39
Figure 2.2: Freshwater Indicators for the United Kingdom (Source: DEFRA, 2004)
A common problem with national approaches to water sustainability is the focus on spaces other than the river basin, which is the fundamental unit of management for water resources. Most proposed indicators are merely physical or chemical parameters of the water cycle, rather than indicators of sustainability (i.e. it means that they do not address the long-term continuation of the water system, but only isolated aspects of the current condition). Taking a different approach, there are attempts to assess sustainability that consider the water as a form of economic capital, as the Critical Natural Capital Framework (Ekins and Simon, 2003). The framework classifies the characteristics of critical natural capital and the environmental functions to which it gives rise. After the identification of environmental functions in four themes (resource depletion, pollution, ecosystem performance, and human heath and welfare), the standards of sustainability are defined. The main problem with the method is the 40
requirement of extensive amounts of data, because it covers several areas and deals with many aspects of sustainability. Other approaches deal with the performance of water companies. Foxon et al. (2002) (also in Water UK, 2000), developed an approach to facilitate the decision-making process of the water industry. It initially used focus groups to understand current decision-making processes and then developed seven phases to facilitate the inclusion of the selected criteria. The final stage is the validation of indicators in a series of local workshops (see Table 2.4). A similar effort was undertaken by the West of Scotland Water Authority (WoSWA, 2000) and the North of Scotland Water Authority (NoWA, 2001) with headline indicators covering four environmentally related issues: the provisions of water services to standards acceptable to society; good environmental management; energy and material flow through the organisation; and the local environment and biodiversity. However, the underpinning interpretation of sustainability is closely associated with business efficiency, lacking other social and economic aspects of water services. A comparable approach is that used in Australia by Lenzen et al. (2003) for the assessment of the Sydney Water Corporation. Table 2.4: Example of Sustainability Indicators Adopted by the Water Industry Issue Indicator Water services Population with sufficient water Water demand and UK population growth possible with availability current resources Household water demand Per capita water consumption Non-household water use Water efficiency Leakage Total leakage from the network Foul flooding Properties flooded Combined sewer overflows Overflows in satisfactory condition Population serves by works meeting Wastewater treatment works numerical standards Good environmental management Environmental engagement Sectoral ranking Convictions for public health Number of ‘category 1’ convictions and environmental offences Biodiversity and the environment Species Priority species with action plans Habitats Priority habitats with action plans 41
River water quality
Rivers in classes A-D Designated waters achieving: Bathing water quality mandatory standards guideline values Energy and materials Energy use per Ml water supplied Energy use at fixes sites Energy use per Ml wastewater treated Renewable energy at fixed Renewable energy as a percentage of sites total energy used CO2 emissions at fixed sites Emissions per head population CO2 emissions from road Emissions per head population transport Sludge management Sludge recycled/reused Source: Foxon et al. (2002) There are also sustainability assessment approaches restricted to urban water systems, as proposed by Hellström et al. (2000), Icke et al. (1999), Krebs and Larsen (1997), Lundin et al. (1999), and Lundin and Morrison (2002). Such methodologies place emphasis only on the performance of urban supply and sanitation systems, ignoring the impacts on catchment processes or the interconnection with other urban systems. An example of urban sustainability indicators is provided in Table 2.5. Similarly to urban methods, Raju et al. (2000) analyse the sustainability of irrigation water systems in Spain. The main weakness of this study is the focus on the efficient use of resources, neglecting the river basin scale and other environmental processes. Table 2.5: Example of Water Sustainability Indicators of Urban Systems Criterion Indicator Health and hygiene criteria Acceptable drinking water Availability to clean water quality Non-access to drinking water Number of waterborne Risk of infection outbreaks Number of affected persons Exposure to toxic compounds Drinking water quality Working compounds Number of accidents Social and cultural criteria Easy to understand (not described) 42
Work demand
(not described) Violation Acceptance Omission Ignorance Availability (not described) Environmental criteria Groundwater preservation Groundwater level N to water Eutrophication P to water Oxygen Consumption Potential Contribution to acidification Hydrogen-equivalent Contribution to global warming CO2-equivalent Spreading of toxic compounds to water Cd, Hg, Cu, Pb Spreading of toxic compounds to arable soil Utilisation of available land Use of electricity and fossil fuels Total energy consumption Use of freshwater Use of natural resources Use of chemicals: Fe, Al Use of materials for construction of infrastructure Potential recycling of phosphorus Economical criteria Capital cost Total cost Operational and maintenance Functional and technical criteria Overflow Non-access to clean water Robustness Sewer stoppage Flooding of basements Out-leakage Performance In-leakage Flexibility (not described) Source: Hellström et al. (2000) Finally, it should be mentioned those assessments that focus specifically on the river basin scale. For example Wagner et al. (2002) compared case studies in 43
Brazil, USA, Japan and Switzerland, relying on compilation of data on water withdrawal, water demand, pollution and ecological integrity of each area. Cash et al. (1996) studied the Northern River Basin in Canada through ecosystem indicators. Here the focus was on aquatic and water environment monitoring, modelling and management, and indicators were proposed to underpin a programme of ecosystem monitoring. Aspinall and Pearson (2000) proposed a suite of indicators with Geographic Information System (GIS) tools to represent the state (condition) and trend (change across space and time) of ecological properties of water catchments. The main weakness of those catchment methodologies is the focus exclusively on physical and biological indicators. To overcome such deficiency, Walmsley (2002) proposes a framework for developing indicators of water sustainability for catchment management. This approach is based on the division of issues between Driving-forces, Pressures, State, Impacts and Response categories (i.e. the so-called ‘DPSIR framework’). The main limitation of such an approach is the excessive complexity that results from the attempt to comprehensively include those five categories. In practice, the method developed by Walmsley (2002) is extremely demanding in terms of data and is difficult to operationalize. Another example of an applied river basin approach, the Environment Agency (2002a and 2002b) has used the ‘Sustainability Appraisal’ in the development of Catchment Abstraction Management Strategies (CAMS) in England and Wales: serving to inform the water abstraction regime and to set abstraction licences. CAMS involve the assessment of resource availability and demands present in the catchment. The attainment of ecological objectives is considered alongside environmental, social, economic and natural resource use. CAMS consider the resource availability status for each water resource management unit (operational sub-divisions of the catchment that can be managed in the same way). Options are screened and refined to identify those that achieve the greatest environmental benefits with the lowest social and economic impacts. However, the crucial problem with this approach it the fact that it is largely based on qualitative assessments, instead of following straightforward indicators. The methodology is complex and time-consuming and, only in some cases, it can involve a quantification of the costs to abstractors of the options under consideration. 2.9 The Appropriate Approach to Water Sustainability Assessment As can be inferred from the examples of assessment in the previous section, it is a major challenge to deal with the three dimensions of water 44
sustainability in a simple, balanced and straightforward manner. The main weaknesses of most indicator methodologies are the restricted focus on ecological processes, the consideration of other scales than the river basin (national or project specific scales), and the formulation of indicators that require extensive databases and complex mathematical models. A more fundamental problem with mainstream approaches to assess sustainability is the ‘unreflexive situatedness’ of such top-down, conventional interpretations of sustainability. This problem is described by Breuer et al. (2002), who affirm that traditional scientific practice usually tries to create the impression that the results of their research have an objective character (i.e. scientific results are independent from the person who produced the knowledge). According to Harrison and Davis (1998), much existing research has defined sustainability as a set of issues identified through modern scientific enquiry, with an approach that privileges the knowledge and authority of experts. Trying to overcome such limitations, this present book was intended to formulate indicators that make an analysis of past tendencies and future scenarios much easier, allowing the discussion of water questions at the catchment scale. The proposed framework of assessment was, by definition, subjectively constructed and value-laden (trying to incorporate the values of the researcher and a number of contacted stakeholders). The development of indicators constantly questioned how the processes of research and analysis have an effect on research outcomes. It was made clear, since the initial stages of interaction with catchment stakeholders, that subjectivity is a determinant of the qualitative research process and epistemological reflexivity as an important tool to access and to develop scientific knowledge. The adoption of indicators for the assessment of sustainability was justified as tools for critical thinking about water problems. The proposed research approach includes some innovative aspects and methodological adjustments that are necessary to fulfil its aims and objectives. It will be demonstrated later that the focus of analysis is centred on a small, manageable group of sustainability criteria, covering environmental, social and economic dimensions. For each criterion, an equivalent indicator that summarises critical processes affecting sustainability was developed. This number of criteria and indicators is deliberately small to facilitate the analysis and places the same emphasis on each dimension of water sustainability. This proposed approach is situated in an intermediate level, between analysis of local ecological and hydrological processes (excessively detailed to consider the sustainability tendency of the catchment as a whole) and regional or national indicators of water management (excessively aggregated to allow conclusions at the catchment level). 45
The analysis of the proposed indicators can be done by either taking into account local thresholds or by associating tendencies and trends in the same river basin and between comparable river basins. The conclusions about the sustainability of freshwater systems are drawn from the examination of qualitative and quantitative sources of information. At the same time, it is important to acknowledge that the framework of indicators has conceptual and practical limitations. The method is a simplification of complex real processes and includes a limited set of parameters related to water sustainability. Each sustainability indicator has its own rationale and the results have different units and scales. In addition, the inputs considered in the analysis are secondary data and, as such, the method incorporates the uncertainties and systemic errors of the original data collection. 2.10 Chapter Conclusions A vast debate on sustainable development is taking place currently in different spheres of government and society. Most of the controversy surrounds the acceptable levels of trade-offs between the use of the environment and the conservation of natural resources. The conservation requirement associated with sustainable development is justified on the rights of future generations and presently excluded groups to make use of common resources. To deal with those controversies, sustainable development has not only an environmental dimension, but also economic and social dimensions that must be considered together. Consequently, the focus of sustainable development is not only on the rate of conservation of natural resources, but also on the economic and political foundations of the environmental problems. After the consideration of the relevant literature, sustainable development was summarised in two central statements. On the one hand, that the search for sustainability is a continuous process towards common responses that appropriately satisfy natural and social demands. This involves the resolution of disputes between conflicting interests, which should follow transparent and democratic approaches. On the other hand, a sustainable process or condition is one that can be maintained indefinitely without progressive diminution of valued system qualities. This does not necessarily imply that the entire system should be maintained, but that sustainability requires the continuation of critical regulatory functions of the environment. Sustainable water management can be considered as a sectoral approach of the overall goals of sustainable development. There are two crucial justifications for the connection between water resources and sustainability. On the one hand, 46
water is a natural resource, which is indispensable for the structure, activity and constancy of natural ecosystems. On the other hand, water performs basic economic and social services. Water is concomitantly an element of nature and an element of society, which makes the use and conservation of water an essentially component of the agenda of sustainable development. The sustainability of water systems must be preferentially considered in the river basin, where, due to interconnections between upstream and downstream processes and demands, there is a shared responsibility for wisely using and conserving water. Three core principles of water sustainability were identified to be relevant for the purposes of this study and will support the development of the framework of indicators. The first principle is that the search for water sustainability can be summarised by the application of sustainable development principles to resource allocation and management, conflict resolution and public participation in order that the demands of nature and society are concurrently satisfied. The second principle maintains that the sustainable use and conservation of the water environment presupposes the indefinite continuation of resilient water systems and the maintenance of critical ecological functions. Finally, the third principle is that water sustainability requires a fair and equitable distribution of opportunities across groups and generations allowing all to benefit from the shared water environment, what must be achieved through participatory approaches, adaptive management and robust institutional framework. This chapter also reviewed the strengths and weaknesses related to the assessment of progress towards sustainable development, as proposed by different authors to deal with different geographical scales and environmental media. The main tool for this assessment is normally the use of a framework of indicators that integrate the three dimensions of sustainability and relate internal parameters of the system. Appropriate sustainability should satisfy a number of requirements, such as to be adequately founded on scientific and technical basis, include a manageable number of variables, require data that is readily available, be flexible to adapt to local monitoring or classification methods, be able to describe past tendencies and future perspectives. Sustainability indicators can play an important role in a discussion about the environmental system and should be relevant for policy making. Many deficiencies were identified in the examples of sustainability indicators applied to water systems. The most common weaknesses are the restricted focus on ecological processes, lack of focus on the river basin and the formulation of indicators that require extensive amount of data. A more fundamental problem has been the lack of reflexive discussion about the limits 47
and capabilities of sustainability assessment. To deal with such deficiencies, this study proposes a framework of sustainability that includes some innovative aspects and methodological adjustments. This proposed approach is situated in an intermediate level between local and national indicators of water management. The conclusions about the sustainability of freshwater systems derive from the examination of qualitative and quantitative sources of information. However, the inputs considered are secondary data and, in being so, the method incorporates the uncertainties and systemic errors of the original data collection. The next two chapters will describe the research methodology and the framework of water sustainability indicators proposed in this study.
48
Chapter 3 - Research Methods and Techniques 3.1 Chapter Overview This Chapter describes the sequence of research methods and techniques employed in the study to satisfy its aims and objectives. The central focus of the research was on understanding the development of a framework of water sustainability indicators for the assessment and discussion of catchment sustainability. The research involved an organised strategy of interactions with local stakeholders, data gathering and interpretation of results, which is graphically represented in the first Chapter section. The second Chapter section expounds the epistemological references of the research approach. The next section explains how the catchments involved in the development of the framework of indicators were selected and how the sustainability indicators were proposed and refined. The fourth section describes the analytical and participatory research techniques and the justification for the adoption of combined qualitative and quantitative research methods. The fifth and final Chapter section gives the details of follow-up interviews with catchment stakeholders, when the framework of indicators was discussed and evaluated. 3.2 Overall Research Approach: Graphical Representation This research was designed to understand the process of developing sustainability indicators and had two fundamental objectives, as explained in the first Chapter: the development of a framework of water sustainability indicators and the application of the proposed framework in selected river basins. In order to fulfil those objectives, a sequence of conceptual and empirical activities was organised, which includes: 1) 2) 3) 4) 5) 6) 7)
Description of the context of the areas under analysis Selection of key water sustainability criteria Development of indicators through an inductive approach Gathering of data for the calculation of indicator results Interpretation of indicator results Follow-up interviews with water stakeholders Overall assessment of the development of indicators
The activities included in the research are represented in Figure 3.1 and were carried out in the different countries and catchments. The first stage 49
comprised the review of the extensive literature on sustainable development, sustainability indicators and water sustainability. A tentative list of water sustainability criteria and possible assessment issues was then prepared based on the specific context of the selected catchments. After a process of testing and evaluation, which involved local water stakeholders, the preliminary criteria and indicators were refined. The catchments included in the analysis are situated in countries with different institutional systems and, therefore, it was necessary to have carefully co-ordination of local contacts and sources of information. It was also necessary to rigorously co-ordinate fieldtrips to optimise time and material resources. The indicators were then applied to the four selected river basins, what required persistent research efforts to obtain data for the environmental, economic and social indicators of water sustainability. The combination of methods adopted in this research was proved particularly useful for new, contemporary phenomena, like water sustainability, with a complex range of variables involved (cf. Yin, 1989). The final stage was the discussion of the indicator results and the overall framework of sustainability indicators in interviews with catchment stakeholders. The next sections of this Chapter will describe the theoretical framework, the details of indicator development and will expand on the research approaches and techniques briefly mentioned so far.
50
Literature Review: Water sustainability Sustainability indicators
OBJECTIVE 1 – DEVELOP A FRAMEWORK OF INDICATORS
Selection of Catchments for the Development of the Sustainability Framework
First Version of Water Sustainability Indicators
OBJECTIVE 2 – APPLY AND EVALUATE THE FRAMEWORK
Second Version of Water Sustainability Indicators
Site visits
Pilot Study
Final Version of the Framework of Water Sustainability Indicators
Data Manipulation for the calculation of indicator results
Analysis of Sustainability Trends and Tendencies
Follow-up Interviews with Stakeholders to Discuss the Framework of Indicators
Conclusions about the Proposed Framework of Indicators and about the Sustainability Condition of the Catchments
Figure 3.1: Research Sequence and Fulfilment of Research Objectives 51
3.3 Epistemological Bases of the Research Approach The assessment of the water sustainability condition, as proposed in this research, is situated in the field of ‘political ecology’, which is an area of science that focuses on the relationship between environmental change, socio-economic demands and political processes. According to Bryant and Bailey (1997), political ecology studies claim that environmental problems are not simply a reflection of policy or market failures, but are rather a manifestation of broader political and economic forces. The solution to those problems will not occur without considerable struggle, since they necessitate the transformation of a series of highly unequal power relationships upon which the present (unsustainable) system is based. Swyngedouw (1999) maintains that political ecology is the appropriate treatment of water development problems, because knowledge and practice are always situated in the web of social power relations that defines and produces the water landscape. Consequently, the unsustainability of water management needs to be examined by considering the socio-economic origins of the environmental problems. It was important to grapple with the philosophical issues and underlying assumptions that forge and give purpose to the research methods adopted for the analysis of the political ecology of water sustainability. As discussed in the previous Chapter, the problems of water use and conservation are socially constructed and, as a result, their analysis is subjectively described. It means that the assessment of sustainability is necessarily ‘positioned’, in the sense that there are no objective parameters that can be gauged to demonstrate the sustainability condition. Because of this subjective nature of water sustainability, its assessment depends, to a great extent, upon the perspective of the researcher, who is not separated from the environmental and social objects of study (Smith and Deemer, 2000). The researcher is not a neutral observer, but has an integral relationship with the system and the questions being studied. Scientific explanation is shaped by the background and personal preferences of those involved in the scientific practice and the scientific activities are always embedded in the cultural matrix that gives purpose to the enterprise (O’Connor, 1999). The assessment of water sustainability is, thus, a combined and coherent approach to build a positioned argument about the use and conservation of the water environment. The assessment requires a judicious research approach that is consistent with the theory of water sustainability and capable of explaining the origins of catchment water problems. As proposed by O’Riordan (2002), the assessment of sustainability is fundamentally a process of connecting and 52
revealing the multiple causes of environmental questions. Sustainability assessment must describe trends and trade-offs between the internal components of the water system. It is related to the understanding of how natural and social systems interact over long time periods and along spatial scales. The assessment needs to be substantiated in mechanisms that can deal with continuous change, uncertainty and multiple public perspectives (Stagl, 2004). The assessment of the sustainability of water systems is therefore highly dynamic, requiring the analysis to be flexible and adaptive in nature (cf. De Marchi et al., 2000). Because of the value judgement intrinsically present in the research, the assessment of water sustainability involves manifold controversies about the scientific production on the relation between environment and society. Specifically about the ‘sociology of science’, Bourdieu (2004) emphasises the inseparable scientific and social character of any research strategy. According to Bourdieu, the scientific fact is made not only by the person who produces and proposes it, but also by the persons who receive it. In the particularly case of water sustainability assessment, it means that the reality of the river catchment can be perceived and interpreted in different ways by the researcher or by those directly involved in the use and conservation of the water environment. In his last book, Bourdieu (2004: 04) gives a paradigmatic account of the subjectivity involved in the scientific praxis: “One cannot talk about such an object without exposing oneself to a permanent mirror effect: every word that can be uttered about scientific practice can be turned back on the person who utters it. This echo, this reflexivity, it no reducible to the reflexion on itself of a ‘I think’ (cogito) thinking an object (cogitatum) that is nothing other than itself. It is the image sent back to a knowing subject. Far from fearing this mirror – or boomerang – effect, in taking science as the object of my analysis I am deliberately aiming to expose myself, and all those who write about the social world, to a generalised reflexivity.” Nevertheless, numerous approaches to sustainability assessment, probably the majority, have neglected this social construction of science, as exemplified in the previous Chapter (Sections 2.8 and 2.9), preponderantly adopting instead a positivistic research strategy. Positivism, according to Robinson (1998), is a process that begins with an externally developed research design, proceeds with the extraction of data from the examined reality and their transportation to distant research institutes for lengthy processing by the researcher. Positivistic (or ‘deductive’) positions claim that the world can be objectively measured and the 53
social reality can be studied in a similar approach to the way in which we study the natural world. The knowledge thus produced is seen as valid because it has been generated rigorously by the specialist researcher and, thus, can be useful to other experts and decision-makers (Oppenheim, 1992; Smith, 1998). Because this positivistic approach centralises control in the hands of the researcher, it tends (regardless of which particular techniques are used) to distance other stakeholders from the process of knowledge production, and minimises the benefit the researcher can gain from local understanding and insights. Avoiding a positivistic research strategy, this study tried to take an inductive approach in which, as originally suggested by Sauer (1925), the geographer continually exercises freedom of choice as to the materials which he includes in his observations, but is also continually drawing inferences as to their relation. In this present research, the inductive approach started with the inventory of catchment features and then those features were grouped and aggregated in such a way that allowed the analysis of sustainability. Throughout the study, the inductive approach permanently related the social and natural elements of the water landscape with the open-ended questions of sustainable development. More specifically, the assessment of sustainability was not intended to draw a boundary line between truth and non-truth. On the contrary, the outcomes of the sustainability research are not right or wrong in itself, but, because the reality is socially and personally constructed, within any situation multiple realities can exist. One of the key features of this inductive approach was the inclusion of a participatory strategy as the main feature for the development of the framework of sustainability indicators. Following a participatory strategy, the researcher invited people to get involved in the explanation of processes and construction of conclusions. The central purpose of adopting an inductive, participatory approach for sustainability assessment was to promote the kind of outcomes that other conventional methodologies regard as fortuitous side effects, such as communication among participants, sharing of experiences and collective learning (cf. May, 1997). This inductive (dialogical) form of integration of different opinions sought reconciliation of perspectives and understanding as coexisting in society in their (irreducible) plurality (cf. Funtowicz and Ravetz, 1993). Overall, the pursuit of knowledge about the water sustainability condition was framed in relation to the challenge of reconciling different points of view. To summarise this section, the epistemological bases of the study were the recognition of the political ecology nature of water problems, the positioned construction of 54
scientific arguments and the requirement of an inductive, interactive approach to explain water sustainability questions. 3.4 Development of the Framework of Sustainability Indicators The research involved the development and evaluation of appropriate sustainability indicators. Such indicators were intended to be consistent with the sustainability theory, as well as capable of easily communicating the results and stimulating critical thinking. The background to each indicator was the available international literature on water management questions, supported by some practical experience of the researcher of water policy and management and interaction with stakeholders in the areas under analysis. 3.4.1 Selection of Catchments to Develop the Framework Following the inductive approach mentioned above, the proposed framework of water sustainability indicators was developed taking into account the context of catchments selected in different countries and with contrasting water management experiences. The starting point to select those catchments was the identification of different countries and with contrasting water development issues, as well as with dissimilar water sustainability questions. Due to logistical and operational convenience the countries selected were Brazil, Italy and Scotland, justified as follows: Scotland – location of the University of Aberdeen (where the author used to be based, at the School of Geosciences) and, in particular, because of the ongoing transformation of water management due to the implementation of new legislation (2003) and the recent political devolution to the Scottish Parliament (1999) Brazil – previous professional experience of the researcher in the private and governmental water sectors; contrasting natural and institutional context in comparison with Scotland; also under transformation of the water management sector due to new legislation (1997) Italy – previous contacts of the researcher; second European country with contrasting experience in relation to Scotland, but also due to implement European directives on water management
55
After the collection of information from prospective contacts (see below) and additional supporting literature, a preliminary list with 3-4 potential catchments in each country was prepared. The fundamental aim was to select catchments with contrasting water problems, but with comparable size and equivalent water management experiences. The selection of catchments followed a set of requirements, which took into account the ultimate purpose of developing and testing the proposed framework of indicators in different situations and in sites that could be realistically examined within the timeframe available. The requirements to select catchments were:
Medium-size catchments (between 2,000 and 5,000 km2), which are the most suitable scale for the application of the proposed indicators, because are catchment that include a range of socio-economic and environmental questions without excessive complexity. In other words, it is likely that smaller catchments have lower probability of having enough information about the three dimensions of sustainability and larger catchments have higher probability of excessive complexity, as discussed by Ioris (1999) for the analysis of water problems in large catchments; Contrasting water development experiences (to test the indicators with different water management questions); Likelihood of data available from governmental organisations, nongovernmental organisations and/or academic institutions (based on the available literature and prospective contacts with local organisations); and Existence of some form of water management organisations and/or some coordination of response to the local water problems (to facilitate the final discussion of results with catchment stakeholders).
In total, the preliminary list included ten potential catchments that satisfied the above requirements in the three countries under consideration (Brazil, Italy and Scotland). After careful assessment of resources available and the effective number of catchments needed to develop the sustainability indicators, it was decided that this preliminary list should be reduced. An additional problem was fact that, since the beginning of the prospective contacts for this study, it became evident that socio-economic data at the catchment scale would represent a particular challenge. Owing to the constraints of time and resource, it was, then, decided to reduce the number of catchments and intensify the analysis in the 56
remaining catchments. The research, therefore, continued in the two most contrasting national experiences, Scotland and Brazil, and the gathering of data about catchments in the second European country (Italy) was stopped. Four final catchments were then chosen in Scotland and in Brazil during the first stage of interaction with local water stakeholders. This decision to have four catchments in two countries was based on the fact that this would be a manageable number of study areas, but would still provide the opportunity to crosscheck catchments under the same national institutional framework. The two selected catchments in Scotland were the Clyde (urbanised, industrialised, heavily modified by human action) and the Dee (mostly rural and relatively pristine). As Brazil is a federation of relatively autonomous states, it was decided to include the State of Rio Grande do Sul, in the most Southern region. The catchments selected in Brazil were the Sinos River (urbanised and industrialised) and the Pardo River (export agriculture and subsistence rural production). Chapter 5 describes the institutional situation in the two countries and the general characteristics of each selected catchment. It can be argued that the Scottish devolved autonomy is, to a great extent, comparable to the administrative autonomy of the Brazilian states. 3.4.2 Interactive Research Approach The proposed framework of sustainability indicators was developed in successive stages of formulating, testing, evaluation and redesign. The selection and refinement of indicators was done in close interaction with water stakeholders in the chosen catchments. These very catchments that were studied were also selected through discussions about the local context of water problems. It means that the research was designed to allow successive opportunities for incorporating inputs from stakeholders into the development of sustainability indicators. Initial contacts with local organisations and field trips were conducted in Brazil (2001), Scotland (2002) and Italy (2002). Prospective contacts were made by phone, letter or email. International phone calls were organised previously by email and were normally carried out in the evenings (i.e. due to four hours of time difference between Brazil and Scotland). As graphically represented in Figure 3.1 above, the three main stages of the research local water professionals were approached to contribute to the development and evaluation of indicators were: 1st Interactive Phase – At the selection of catchments and discussion about water sustainability criteria and related sustainability issues (to formulate the first version of indicators)
57
The initial list of water sustainability criteria and key management issues was discussed with water stakeholders during the selection of catchments. These discussions covered an initial list proposed by the researcher, which included around 50 issues related to water sustainability and quoted in most water sustainability assessments publicly available. To make this list manageable, the issues were organised and classified in ten criteria of water sustainability distributed in the three dimensions of sustainable development. Subsequently, following the discussions, the initial list was reduced and adjusted to nine criteria (Table 3.1), because it was realised that the list incorporated some repetition and omission of critical aspects of the sustainability of water systems. From this initial interaction with stakeholders, the first version of water sustainability indicators was proposed. Table 3.1: Water Sustainability Issues Initially Discussed with Water Stakeholders WATER SUSTAINABILITY ISSUES TO BE CRITERION INCLUDED IN THE FORMULATION OF SUSTAINABILITY INDICATORS Impact on biochemical water properties (extension of the river course with good or bad environmental conditions Water related to catchment economic activity, etc.) Quality Alteration in organisms and in life patterns (bioindicator organisms, reduction of fish population, biological indicators, etc.) Use of renewable water resources (annual water abstraction per sector, total water available, etc.) Use of non-renewable water resources (annual nonWater renewable groundwater abstraction, total non-renewable Quantity water available, etc.) Changes in hydrologic patterns (alteration in water flows [maximum, minimum, & mean flow], alteration in river channel, alteration in hydrogram characteristics, etc.) Changes in the catchment environment (land use changes, land cover changes, impacts on wetlands, urbanisation, Environmental etc.) Quality Impacts on ecosystem health (reduction in biodiversity, endangered species, erosion, etc.)
58
Well-Being
Efficiency
Public Participation
Equity
Institutional Preparedness
Risks
Well-being promoted by water management (public health, water costs, improvements in real state figures, flood control, etc.) Well-being reduced by defensive expenditures (‘water capital accountability’ [net water revenues = water revenues – defensive water expenditures – depreciation of natural water capital]) Efficiency of water uses (economic valuation of water capital in comparison to water revenues, etc.) Efficiency of the water business (reduction in unitary or marginal costs of the water services, etc.) Opportunities available to participation (institutional and legal spaces to legitimate participation) Participation of the public (meetings, audiences, polls, referendum, etc.) Index of equity (people served by supply, sanitation, sewer treatment, etc.) Equity of the water development (revenues created by water business compared to the catchment GDP, etc.) Institutional framework (organisation, charges, decisionmaking, management instruments, legislation, role of private entrepreneurs, communication technology, demonstration of advances towards the sustainable water management mode, etc.) Conflict solving and negotiation processes (form of implementation of water development projects, changes in water management, etc.) Level of risk involved in the water decisions (drought risk, flood risk, supply reliability, etc.) Perception of risk (form of risk mitigation, risk management, etc.)
2nd Interactive Phase – At the selection of water sustainability indicators to be used in the pilot-study (to formulate the second version of indicators) The first version of indicators was formulated by the researcher after the preliminary contacts to discuss sustainability issues and select catchments. The initial indicator expressions were subsequently discussed with water stakeholders (mainly the same included in the first interactive phase) to permit its refinement e use in the pilot-study. In total, seven organisations in Brazil, seven in Scotland and three in Italy (Table 3.2) were contacted in the initial two interactive stages (i.e. first for the selection of catchments and identification of key sustainability 59
issues and, second, for the improvement of the preliminary water sustainability indicators). Water stakeholders were identified according to previous knowledge about the main organisations in each country, and also according to publications available and, in many cases, following suggestions of those already contacted (i.e. ‘snow-ball approach’). In some of those organisations, more than one person was approached at this stage of the research, because it was not always immediately evident who was the best interlocutor. Face to face discussions took a conversational style, which means that the discussion was flexible enough to choose the wording and sequence of questions according to the specific circumstances. Notes were taken after each contact and some respondents were contacted more than once (some respondents approached in this prospective stage also contributed with data and agreed to be interviewed in the end of the research, as it will be explained later). Table 3.2: Organisations Involved in the Selection of Catchments, Identification of Sustainability Issues and Preliminary Version of Indicators Brazil Scotland Italy State Water Council Macaulay Institute Direzione Comitesinos SEPA, Aberdeen Pianificazione delle Risorse Idriche Proguaíba SEPA, Glasgow (Regione Piemonte) Programme Private consultancy Private consultancy Istituto di Ricerca (working in the (working in the per la Protezione Guaíba River Basin) Cairngorms) Idrogeologica (Sezione di Torino) CORSAN Glasgow University IBAMA Scottish Executive University of Turin FEPAM Scottish Water 3rd Interactive Phase – At follow-up interviews to discuss the appropriateness of the proposed framework of indicators The third opportunity of involving water stakeholders in the assessment of the proposed framework of indicators was at follow-up interviews to present and discuss the results of each studied catchment (this will be explained in detail in Section 3.6 below). In addition to these three interactive stages of the research, additional contacts were made with governmental, academic and nongovernmental organisations for data gathering and bibliographical search. 60
3.4.3 Evaluation and Refinement of Indicators The selection and refinement of water sustainability indicators involved the consideration of the local catchment context and interaction with water stakeholders. This was an intensive process of analysis and reflection, which fundamentally aimed to construct a framework of indicators that could assist the explanation of water sustainability problems. The initial list of indicators reflects the evolution from the broader list of water sustainability issues (identified from the international literature) to the specific context of the selected countries and catchments (analysed in the discussions with stakeholders). A key contribution of stakeholders for the initial set of indicators was the suggestion that the framework could have one indicator per sustainability criterion, in order to make it simpler and facilitate comparison between catchments and countries. The preliminary broad list of issues was, thus, reduced to nine fundamental indicators (Table 3.3) to allow a manageable number of expressions, but still maintaining the explanatory capacity about the sustainability condition. At this point, it was realised that the indicator of ‘risk’ would not be easily calculated or would not offer the same level of explanation as the other indicators. The risk criterion was, thus, excluded from the framework. The list of parameters to be incorporated in the indicators was also reduced to those issues most commonly addressed in the literature and with more directly related to the key water management problems (described in Section 2.7).
61
Table 3.3: First Version of Sustainability Indicators (selected by the researcher based on the international literature and the context of the catchments) (y/x) Water Quality
Water Quantity
Soil Use Change
Economic Efficiency
Water Reliability
y = total extension of river segments with satisfactory water conditions for human consumption x = total stream system of the river basin [( x – y ) / x ] * [( Imp + z + r ) / ( Exp + z )] x = annual available volume of freshwater (discounting the ecological reserve) y = annual water withdrawal from ground and surface water Imp = annual water flow imported to the basin z = mean annual discharge at the river mouth r = annual flow of recycled (reused) water Exp = total water flow exported from the basin -1 { 3 * [(a – a’) / a + (p – p’) / p + (w1 – w2) / w1] } + cons / basin a = total arable land a’ = total arable land without conservation practices (unsustainable agriculture use) p = total pasture land p’ = total pasture land without conservation practices (unsustainable pasture use) w1 = original wetland area w2 = area of wetlands lost by human impact and reclamation cons = total surface confined in conservation units basin = total river basin area [ (GDP2 – GDP1) / GDP2 ] – [ (use2 – use 1 )/ use2 ] GDP2 = gross domestic product of the current year GDP1 = gross domestic product of the previous year use 2 = annual water withdrawal from ground and surface water for the current year use 1 = annual water withdrawal from ground and surface water for the previous year 1 – [( ROPx – ROPm)2]0.5 ROPx = ratio between annual runoff and annul rainfall ROPm = ratio between mean runoff and mean rainfall
62
10
Σ Xi / 10 i =1
Institutional Preparedness
Equitable Water Services
Water Well-being
X1 = river basin plans X2 = river basin committee X3 = river basin agency X4 = public awareness and education X5 = norms and regulation X6 = monitoring and enforcement X7 = water permits and/or charges X8 = regulation of services X9 = soil and water interaction X10 = risk management [100-1 * (x + y ) / 2 ] * Indcon x = percentage of population with access to reliable and safe water supply y = percentage of population with access to reliable water sanitation Indcon = index of sector concentration of water uses Indcon = 1 + [( 1 / var2 ) – ( 1 / var1 )] var2 = variance of water uses for the current year var1 = variance of water uses for the previous year ( y / x ) * HDI y = total daily domestic consumption of freshwater x = river basin population HDI = Human Development Index (or proxy) 10
Σ Xi / 10 i =1
Public Participation
X1 = mechanisms for public participation X2 = opportunities to participate X3 = regular activities X4 = convocation attendance X5 = stakeholder preparedness X6 = participatory planning and set of priorities X7 = decentralised decision-making X8 = conflict solving X9 = independent auditing X10 = indicators for collective monitoring
63
The second version of indicators (Table 3.4) was chosen in further discussions with local water stakeholders. Because the interviews were conducted in sequence, in many occasions it was necessary to consult the same person more than once to discuss suggestions provided by others. It is relevant to report that it was not always easy to have in depth discussions with some respondents, due to time constraints or, more probably, conflicts between personal opinions and the position of the respective organisations (to minimise this problem, anonymity was offer in all interviews). In some cases, the respondent asked for additional time to provide answers to some questions, because wanted to clarify some points with colleagues or managers. Stakeholders provided extremely helpful insights and suggestions, for instance that the indicators should be closely related with new regulatory regimes and should address historic water management problems in the catchments (such as water quality fluctuation or lack of public participation). A crucial attribute recommended for the selection of indicators was a clear explanatory capacity (i.e. the capacity to relate the sustainability problems to the human interventions in the water systems). Another critical requirements were expression simplicity and likelihood of data availability for the calculation of data. There was a strong opinion in favour of reducing the complexity of indicators and keeping a disaggregate treatment of each indicator (i.e. instead of aggregate indices). In comparison with Tables 3.1 and 3.3, it can be seen in Table 3.4 that it was suggested by many stakeholders that the framework of indicators should have a more balanced approach to the three dimensions of sustainable development (environmental, economic and social). That is because stakeholders pointed out that the initial list of criteria comprised more environmental and social issues than respective economic ones. In consequence, the criterion of ‘water reliability’ was transformed into ‘sector use productivity’. To avoid over-emphasising the environmental dimension and keep the focus on water management issues, ‘soil use change’ was transformed into ‘system resilience’ (i.e. rainfall-runoff model). The second version of indicators (Table 3.4) also simplified the indicator of ‘water quantity’ (instead of mixing water balance and flow, only flow equivalent was included). ‘Institutional preparedness’ was expanded from 10 to 12 items in the respective checklist. The indicator ‘equitable water services’ removed the ‘factor of concentration of water use’ by dominant sectors and adopted an average between water supply and sanitation (because this specific ‘factor’ was considered controversial by some stakeholders). Finally, the indicator ‘water well-being’ was transformed from water demand per person multiplied by an indicator of wellbeing to a quotient between an indicator of well-being and water demand. 64
The second version of indicators was tested in a pilot study in the Don catchment, Northeast of Scotland. This pilot exercise was meant to be as realistic as possible and involved efforts to obtain real data from governmental and scientific organisations (e.g. Scottish Executive, Aberdeenshire Council, Scottish Water, SEPA and Macaulay Institute). The pilot study was carried out in the end of 2002 and anticipated the future difficulties in terms of data gathering, in particular the significant time needed to obtain and validate data for analysis (mainly due to incompatible units or format of data, as well as incomplete data series and inconsistent data sets). Table 3.4: Second Version of Sustainability Indicators (selected in discussions with catchment stakeholders) (y/x) Water Quality
Water Quantity
System Resilience
Water Use Efficiency
y = total extension of river segments with drinkable or almost drinkable conditions (excellent or good quality standard) x = total stream system of the river basin [( x – y ) / x ] * [( Imp + x + r ) / ( Exp + x )] x = annual water flow of 95% frequency (m3/s) y = annual water withdrawal (m3/s) Imp = annual water flow imported to the basin (m3/s) r = annual flow of recycled (reused) water (m3/s) Exp = annual water flow exported from the basin (m3/s) 1 – [( ROPx – ROPm)2]0.5 ROPx = ratio between annual runoff and annual rainfall ROPm = ratio between mean runoff and mean rainfall [ (GDP2 – GDP1) / GDP2 ] – [ (use2 – use 1 )/ use2 ] GDP2 = gross domestic product of the current year GDP1 = gross domestic product of the previous year use 2 = annual water withdrawal from ground and surface water for the current year use 1 = annual water withdrawal from ground and surface water for the previous year
65
User Sector Productivity
(y/x) y = Annual Gross Domestic Product (or proxy) x = total annual demand of freshwater by manufacturing 12
Σ Xi / 12 i =1
Institutional Preparedness
X1 = water allocation observes priority uses X2 = norms and directives of water use efficiency X3 = systematic revision of norms and regulation X4 = regulation of services of water supply and sanitation X5 = water permits system X6 = water permits and/or water charges follow volumetric variations X7 = river basin master plans X8 = regular revision of river basin master plans X9 = integration of water management with land use management X10 = river basin committee X11 = river basin agency X12 = programme of information for stakeholders which focuses the river basin [100-1 * (x + y ) / 2 ]
Equitable Water Services
x = percentage of population with access to reliable and safe water supply y = percentage of population with access to reliable water sanitation HDI / x
Water Well-being
HDI = Human Development Index x = annual average of daily water withdrawal from ground and surface water
66
10
Σ Xi / 10 i =1
Public Participation
X1 = stakeholder representation in the river basin committee X2 = democratic nomination of stakeholder representation X3 = local public consultation preceded river basin legislation X4 = local public consultation preceded changes in river basin legislation X5 = local public consultation preceded water supply and sanitation legislation X6 = river basin master plans included the participation of stakeholders X7 = participatory budgeting X8 = participatory mechanisms for conflict solving X9 = independent auditing and monitoring X10 = collective monitoring of water management
Continuing to follow the same reflexive approach for the development of indicators, the results of the pilot-study prompted further adjustments in the indicator expressions and were useful for the development of the third (final) version of indicators (Table 3.5). It can be seen that the indicator ‘water quality’ was modified to facilitate the communication and comparability of results. ‘System resilience’ was transformed from a rainfall-runoff model to an expression that considers deviations in mean river flows. ‘Water use efficiency’ shifted from water use to an emphasis on water demand. ‘User sector productivity’ was adjusted to an expression similar to ‘water use efficiency’ to allow an easier demonstration of inter-annual changes in economic productivity. The indicator ‘equitable water services’ was simplified and, instead of the calculation of the average between the coverage of water supply and sanitation, these were calculated individually. ‘Water-related well-being’ was renamed and adjusted to allow an easier demonstration of inter-annual changes in well-being indicators and water demand. Finally, the indicators ‘institutional preparedness’ and ‘public participation’ were rationalised into eight items each, because some of the previous items were considered to be redundant or less relevant. The result presentation of these two indicators also changed to the total items with positive answers (instead of the previous positive answers divided by the total possible answers). 67
Table 3.5: Third (final) (based on the pilot-study)
Version
of
Sustainability
Indicators
(y/x) Water Quality
Water Quantity
y = extension of river stretches into water quality categories according to the official classification methodology adopted locally x = total extension of river stretches [( y ) / x ] * { 100 / [ 100 - (Exp - Imp - Rec) ] } y = seasonal water abstraction (m3/s) x = seasonal flow exceeded 95% of the time (m3/s) Exp = percentage of abstracted water that is exported from the river basin (%) Imp = percentage of abstracted water that is imported to the river basin (%) Rec = percentage of abstracted water that is recycled in river basin (%) 12
[ Σ (Qi – Qimean ) / si ] / 12 i =1
System Resilience Q
Qi = moth river flow (month ‘i’) = long-term month mean flow for month ‘i’ si = standard deviation for month ‘i’ [ 100 * (GDP2 – GDP1) / GDP2 ] [ 100* (demand2 – demand1 )/ demand2 ]
mean i
Water Use Efficiency
GDP2 = catchment Gross Domestic Product of the current period GDP1 = catchment Gross Domestic Product of the previous period demand 2 = water demand from ground and surface water for the current period demand 1 = water demand from ground and surface water for the previous period
68
[ 100 * (turnover2 – turnover1) / turnover2 ] [ 100 * (sector demand2 – sector demand1 ) / sector demand2]
User Sector Productivity
turnover2 = economic result of the productive sector during the current period turnover1 = economic result of the productive sector during the previous period sector demand2 = water demand by the sector in the catchment for the current period sector demand 1 = water demand by the sector in the catchment for the previous period 08
Σ Xi i=1
Institutional Preparedness
Equitable Water Services
X1 = legislation addresses water management at the river basin level X2 = river basin management is formally connected with the regional / national system of water management X3 = river basin management is organised / regulated by specific plans and programmes X4 = water allocation mechanism is based on local hydrologic Assessments and appropriate criteria X5 = allocation of water takes into account social and environmental priorities of use X6 = existence of a river basin organisation with specific water management duties X7 = hydrologic and water quality monitoring with satisfactory space and time coverage X8 = capacity building activities at the catchment level ( x * 100-1 ) x = percentage of population served by potable water supply (or by adequate sanitation services)
69
[100 * (well-being2 – well-being 1) / well-being 2] [100 * (demand2 – demand1 )/ demand2] Water-related Well-being
well-being2 = indicator of well-being related to water of the current period well-being1 = indicator of well-being related to water of the previous period demand 2 = per capita demand of the current period demand 1 = per capita demand of previous period 08
Σ Xi i =1
Public Participation
X1 = legislation delegate water management decisionmaking to water users and civil society X2 = practice / mechanism of water management includes stakeholder participation X3 = opportunities for public participation at the regional / national system of water management X4 = river basin planning is conducted via participatory approaches X5 = the majority / totality of stakeholder sectors are Properly involved in the river basin management X6 = policy making is influenced by river basin public participation X7 = conflicts among water users are considered and dealt at the river basin level X8 = campaigns / activities that aim to involve the river basin population at large
3.4.4 Final Indicator Expressions At the end of the process of indicator development (evaluation of the pilotstudy results) the framework of water sustainability comprised nine criteria and corresponding indicators (these will be described in detail in Chapter 4). The proposed indicators are the result of a balance between the sustainability theory, stakeholder inputs and the practicalities of an empirical assessment. Although it was agreed not to calculate a final aggregate index, it was also decided that the three dimensions of sustainability (environmental, economic and social) should have the same number of indicators. From this point onwards in the research, there was an operational coincidence between criteria and indicators. It means that, although each proposed indicator was not intended to give a full account of 70
the equivalent criterion, the final list of indicators expressed quantifiable measurements of the nine selected criteria. Those proposed indicators are capable of incorporating central parameters of the water sustainability condition and, at the same time, avoid excessively demanding expressions in terms of data and time coverage. The development of appropriate indicators required sensible judgement over expressions that had robust scientific justification and expressions that were operational (for time and resources available). As emphasised by Stein et al. (2001), indicators are dependent upon data availability and also upon the scale for which statements are required. It is important to emphasise that the research was intended to compare situations in different catchments and address historical trends of water processes and, for this reason, the indicators were developed to produce results specifically from the manipulation of secondary data. It should be mentioned that each indicator aims to describe critical processes related to the specific criterion, but this did not preclude the need for additional sources of evidence for the interpretation of indicator results. 3.5 Data Gathering and Manipulation After developing the research framework, it was necessary to collect and manipulate empirical data to calculate the proposed indicators of sustainability. To provide a context for the indicator calculation, it was necessary to first describe the catchment geography, the history of water development, the main uses of water and the main conflicts between stakeholders. Old books and maps were consulted in the different libraries visited throughout the research period. In the case of the Clyde River Basin, special permission was obtained to use publications of the 18th and 19th Century stored in the Mitchell Library, Glasgow. For all four river basins, the use of GIS techniques added the spatial dimension to environmental and socio-economic variables. GIS images were obtained from the environmental regulators (SEPA in Scotland, ANA and FEPAM in Brazil) and were analysed using the programmes ArcExplorer and MapExplorer. The calculation of sustainability indicators involved secondary data sets, covering environmental, economic and social aspects of the catchments under analysis. The use of secondary data analysis was justified on the basis that the sustainability indicators required a straightforward manipulation of data and aimed for an easy communication of results. As pointed out by Hakim (1982), the use of secondary data allows both, efficiency in data collection and comparison across time and space that otherwise would be impossible. Bryman (2001) 71
summarises the advantages of secondary data as follows: the creation of conditions for reduced costs and economy of time; the production of high quality data; opportunities for longitudinal analyses; opportunities for subgroup analysis; opportunities for cross-cultural analyses; more time for data analysis; reanalysis of the same data to offer new interpretations; and the use of the same data by more than one researcher. There were, thus, significant advantages in the use of secondary analysis in this research, notably the comparison between catchments and analysis of historic trends. In the case of this research, secondary data was obtained from hydrology monitoring, environmental databases, demographic and economic statistics, water service companies, governmental publications, among others. However, it is important to observe that a number of problems were identified with those sources of data. First, because of the various sources, there are limitations in terms of comparability of data. This was a particular problem for indicators that combine a group of variables, requiring that data for each one of the variables should cover the same period of time and should not present missing values. The second limitation is the fact that secondary data were initially collected for purposes other than sustainability indicators, and their usefulness to the problem at hand may be limited. Thirdly, secondary data incorporates the uncertainties and systemic errors of the primary sources (i.e. data quality depends much upon the rigour with which they are generated). The next sub-sections describe the details of the combined techniques adopted for data gathering, as well as the list of data sources and the specific forms of manipulation required for the calculation of the indicator results. 3.5.1 Combination of qualitative and quantitative research techniques The assessment of water sustainability is research situated on the boundary between human and physical geography and proposes to integrate techniques from both disciplines. According to Kitchin and Tate (2000), this field of investigation can be considered as ‘resources geography’, which is an example of mixed human and physical geography. It integrates quantitative and qualitative approaches, to produce complementary perspectives of the sustainability condition. Quantitative and qualitative methods can be combined or used separately in doing critical research. While quantitative techniques are aimed to provide measurement and quantification of parameters, mainly done through statistical methods and mathematical modelling, qualitative techniques are used to assess how the world is viewed, perceived and constructed by social actors 72
(Devine and Heath, 1999). Quantitative and qualitative approaches have, thus, complementary properties that were explored to allow the understanding of the socio-environmental processes of the water management system. For this specific research, the combination of research techniques was the following:
Qualitative techniques (employed in the characterisation of the catchments, in the calculation of two ‘check-list’ indicators and in the participatory research approach): policy documents, archival research and semi-structured interviews;
Quantitative techniques (employed in the calculation of the other seven indicators): manipulation of secondary data sets of environmental, hydrological and socio-economic statistics.
The combination of qualitative and quantitative techniques in geography is not exclusive to water research and there is a growing tendency towards combining aspects of qualitative and quantitative approaches, overcoming the dichotomy that, in the past, used to distinctively separate those two groups of research methodologies (Ragin, 1987). Nonetheless, the combination of methods can be particularly complicated, since qualitative and quantitative research methods have different theoretical foundations. Oppenheim (1992) observes that while we can make good use of all existing research methods, we must not forget that human lives and human causality are not composed of layers of regression coefficients. There are also limitations such as insufficient information to determine potential sources of bias, errors or problems with internal and external validity (Frankfort-Nachmias and Nachmias, 1992). It is beyond the possibilities of science to eliminate all risks and uncertainties, which can be only minimised and should be adequately treated (Funtowicz and Ravetz, 1993). Those methodological limitations are due to synergies and feedback between the many constituent elements of the water system, which pose barriers for the assessment of the sustainability condition. 3.5.2 Qualitative techniques 3.5.2.1 Analysis of policy documents Documents related to management, use and conservation of water resources were collected in the four areas under analysis. In addition, relevant 73
technical studies, plans, and projects were also consulted. The most relevant policy documents included in this research were legislation and bye-laws, official documents commenting or assisting the implementation of legislation, institutional documents about the statutory role of the regulatory agencies, public consultation documents, discussion papers, as well as folders, leaflets, websites and annual reports. It is important to observe that both in Scotland and in Brazil there are two levels of government (i.e. Scotland is part of the United Kingdom, as much as the Rio Grande do Sul State is part of the Brazilian federation of states) that do not necessarily have coherent policies for all issues or during the implementation period for new legislation. This possible source of contradiction required constant comparison between central and local policy documents. The analysis of policy documents had to consider not only the text, but also the format and additional details associated with the production of the document (Blaxter et al., 1996). This is also specifically noted by Jupp (1996), who affirmed that there are three separate component parts of a single policy document. One is the physical appearance of the document, the medium on which the message is stored. The second is the message that is conveyed through the symbols, which constitute writing. The third is the discourse, encompassing ideas, statements or knowledge that are dominant at a particular time among particular sets of people and which are held in relation to other sets of individuals. At the same time, much of the significance and interest in documents is revealed when they are considered in relation to each other. There are questions related to the authenticity (whether it is original and genuine), credibility (whether it is accurate), representativeness (whether it is representative of the totality of documents of its class) and meaning (what it is intended to say) of policy documents (Scott, 1990). 3.5.2.2 Archival research This research technique involved the consultation and interpretation of a diversity of texts, including not only conventional documents and publications, but also literature writing, historic maps, old pictures, commercial publications, Internet material, commemorative documents, museum exhibitions, political speeches, newspaper interviews, proceedings of conferences about the catchment problems, and paintings of the rivers in Scotland and in Brazil. The reason is that archives have a dynamic role in representing views and opinions about the river basins considered. Kurtz (2001) observes that archives are broadly related to issues of representation and power in society. In consequence, the consultation 74
of archival data necessarily requires interpretation, because archival texts are nothing more than a representation of the social reality. It means that not only the message of the text is important, but also the style, the context and the purposes must be considered. There are advantages to the use of archival documents for the analysis of water sustainability, for example that it can be accessed at a time convenient to researcher, it represents data that informants have given attention to compiling and it enables the researcher to obtain the language and the words of informants. However, there are also limitations, such as documents may be protected and/or information is unavailable to public or private access. It may also require the researcher to seek out information in hard-to-find places. The material may be incomplete or the document may not be authentic or accurate (Creswell, 1994). It must be assessed where the data comes from and what the reasons for collecting it were, as well as what users of the archival data exist. 3.5.2.3 Development of a database to support qualitative techniques A database was specifically developed to organise the varied forms of texts obtained during the data gathering process, alongside the scientific literature about water sustainability and about the four catchments. This database was developed in Access at the initial stages of the research process. Including papers, books, publications, brochures, leaflets, and Internet documents, this database accumulated more than 800 entries between 2001 and 2004. Each document was registered in the database and then stored in a correspondence file. Depending on the format of the document, it was stored either in electronic files or in hard copy files. Such files were indexed according to a) sustainability criteria, b) country or catchment, or c) approach to sustainability assessment. Following such methodology, it was relatively easy to retrieve documents obtained in different stages of the research and this facilitated the easy identification of topics that were lacking information. As a whole, this organisation of documents according to the database index aided the comparison between catchments and the discussion of results. 3.5.3 Quantitative techniques 3.5.3.1 Gathering of quantitative data Most of the proposed sustainability indicators (i.e. seven indicators) needed quantitative environmental and socio-economic data. In order to calculate those seven indicators it was necessary to carry out a collection of quantitative data 75
about the four selected river basins. The research mainly included data that were either in the public domain, such as published reports and on-line databases, or data that were available at request from the responsible agencies. Some sensitive material was also used, such as information collected by consultants about the likely business impacts of new regulation. In those circumstances, both anonymity and confidentiality on the use of data were assured, as well as the guarantee that data would be used exclusively for academic purposes and only for this research. The organisations that provided quantitative data are related in Boxes 3.1 and 3.2. Box 3.1: Organisations that Provided Environmental Data: In Scotland: Scottish Environment Protection Agency (SEPA), Scottish Executive, Scottish Water Plc., Clyde River Foundation, Macaulay Land Use Research Institute (MI) In Brazil: State Environment Protection Foundation (FEPAM), State Secretariat of the Environment (SEMA), Ecoplan Engineering Ltd., Pardo River Basin Committee, Sinos River Basin Committee (Comitesinos), Institute of Hydrological Research of the Federal University of the Rio Grande do Sul (IPH/UFRGS), National Water Authority (ANA) In the effort to acquire data many difficulties were encountered and, in some circumstances, it was impossible to obtain enough or satisfactory data. The most common problem was the fragmentation, throughout different organisations, of data necessary for the same indicator. In many cases, socioeconomic data was not available at the catchment scale or did not cover the same time periods for all parameters included in the indicator. Some parameters have only small periods of monitoring, while others suffered from interruptions or changes in methodology from time to time. Specific problems with the manipulation of data are discussed in Chapter 6 where the detailed calculation of each indicator will be presented.
76
Box 3.2: Organisations that Provided Socio-economic Data: In Scotland: Scottish Executive, Scottish Office, Aberdeen City Council, Aberdeenshire Council, Glasgow and Clyde Valley Joint Structure Plan Committee, Her Majesty's Stationery Office In Brazil: United Nations Development Programme (UNDP), Economic and Statistics Foundation (FEE), Brazilian Institute of Geography and Statistics (IBGE), Guaíba Watershed Environmental Management Programme (Pró-Guaíba Programme) 3.5.3.2 Manipulation of quantitative data for the calculation of sustainability indicators After an initial checking of format and time coverage, gathered data were normally stored as Excel document (data retrieved from Access and Oracle databases were converted into Excel). Before storing the data, it thus was necessary to convert different formats and units into common basis of comparison. After being stored in a comparable format, data was crosschecked to ensure consistency. When enough data were available, these data were validated against other sources. However, due to lack of data, in many cases it was not possible to validate the dataset. In those circumstances, when validation was not possible, one alternative was to relate the available data with comparable sites in neighbouring catchments. Another alternative was to compare the catchment information with regional or national trends. For the cases where data was not available for indicator calculation or where there were restrictions with existing data (i.e. missing periods, data compatibility or lack of confidence on data validity), ‘proxy indicators’ were used to provide an indirect assessment of the main indicator. Proxy indicators are alternative expressions that have direct relation with the issues included in the sustainability indicators initially proposed for this research. The same proxy indicators were not necessarily used in all catchments, as it depended on the local availability of data. For the cases where data were particularly scarce or poor for the calculation of the indicator (or even for the calculation of proxy indicators), this situation was compensated with other indirect sources of information related to the scope of the indicator (such as scientific publications, academic book or technical reports). 77
Specific data manipulation tools were employed to calculate the indicators, such as water quality monitoring and classification methodologies, hydrological models, manipulation of economic and socio-economic statistics, manipulation of water services statistics (supply and sanitation), and manipulation of demographic statistics. For most indicators, data had to be adjusted to the catchment scale. In Scotland, it required the adjustment of national data or local authority data. In Brazil, it required the adjustment of state or municipal data to the catchment scale (each state in the Brazilian Federation comprises municipalities, which have political and administrative autonomy). The specific data sets that were used in the calculation of indicators are summarised in Table 3.6 and cover the three dimensions of water sustainability. Table 3.6: Quantitative Data Necessary for the Calculation of Indicators Sustainability Quantitative Data Dimension water quality samples daily river flow Environmental daily water demand interbasin transfer flows volumes of recycled water total water demand catchment economic output Economic economic output per water user sector water demand per water user sector water supply services Social water sanitation services quality of life indicators Generally, data sets were already in a digital format and were easily entered into the computer packages (although in many cases it was necessary to first convert units and formats). Errors and missing data were checked before the indicators were calculated. For the cases where enough registers were available and covered a sufficient time period, it was possible to describe the pattern of dynamics over time (as proposed by Hamilton, 1994). Apart from the Excel programme already mentioned, the statistical package Minitab was also employed for the manipulation of data (used to calculate moving average and carry out time series analysis). For the specific manipulation of water quality data, the computer programme Aardvark was used (for the estimation of quality percentiles through 78
parametric methods, assuming normal or log-normal distribution for different chemical parameters). These three computer packages (i.e. Excel, Minitab and Aardvark) were useful in providing graphical representations of results (as it will be seen in Chapter 6). 3.5.3.3 Analysis of indicators derived from quantitative data The sustainability indicators were primarily analysed by taking into account historical trends and tendencies of the results. The indicator expressions were proposed to produce results giving a clear indication of whether contributes to sustainability were being made or not. For instance, some indicators produce results with positive or negative signals. Other indicators have a possible range between zero and one, which means that the results can be interpreted according to that scale of results. Another alternative was to consider local thresholds, which are available for those sustainability indicators that are adjustments of existing local indicators. A third alternative for the interpretation of results was to compare the four catchments against each other or relate the results with existing data about comparable indicators. It is important to emphasise that the analysis of each indicator needed to provide knowledge on the water sustainability criterion and also information about the catchment management. 3.5.4 Interpretation of Indicator Results The results obtained from the indicators provided an explanation about water problems and achievements in the studied areas. This explanation did not claim objectivity or correctness, but, on the contrary, was directly related with the process of indicator development and data available for indicator calculation. The indicators were fundamentally tools for highlighting trends and tendencies in key areas of water management. The indicators were tailored expressions developed for the local reality and that required additional data about the local context for their interpretation. To interpret the indicator results it was necessary to consider the local context of each catchment, in particular the political ecology affecting water development and environmental conservation (for example, present and past economic activities that may have affected the use of the water environment). It means that the indicators were not considered as the only source of information about the local water sustainability problems. Historic and geographic material, including old books and documents, was considered for the interpretation of indicator results. At the same time, field trips to the studied areas facilitated the access to non-published materials and, in some cases, confidential 79
consultancy reports. Fortuitous interaction with local catchment residents, pictures taken during the field trips and, in some occasions, attendance at local events (public meetings, conferences and campaigns) also contributed for the interpretation of the sustainability condition by the researcher. Ultimately, the interpretation of results, as well as the development of indicators, was a subjective, value-laden procedure that was based on the indicators and supported by those other source of information. 3.6 Follow-up Interviews with Catchment Stakeholders After data gathering and the calculation of indicators, a round of interviews was conducted with selected local stakeholders to help to evaluate sustainability trends in the specific catchment and the appropriateness of the proposed framework. For each study area, an average of ten people was contacted (i.e. 14 in the Dee, 10 in the Clyde, 6 in the Sinos and 8 in the Pardo catchments) and some of these respondents already contributed for the development of the framework of indicators in the beginning of the research. Interviewees were asked a semi-structured and standardised sequence of questions about water problems and management alternatives. Responses were not constrained to categories provided by the researcher, but, according to this interview approach, the questions were standardised, with the conversation mostly controlled by the interviewer. This strategy was used in an attempt to increase the comparability of responses. Following this approach, the organisation of interview responses for analysis was relatively straightforward (based on Kitchin and Tate, 2000). The respondents of the interview included stakeholders with direct involvement in the catchment management or specific interest in water issues. Respondents were selected according the importance of the organisation regarding water management, taking into account the previous contacts in the catchments. Interviews were arranged at the convenience of the respondent. However, not all people and organisations were available for the follow-up interviews during the suggested period of time (particularly in the case of the Brazilian fieldtrip, which took a relatively short period of time in December 2003/January 2004). In certain cases, additional contacts were entailed by phone or email if specific topics required further explanation. Table 3.7 has the list of people contacted in the approximate chronological order (in order to preserve anonymity, only job titles will be indicated here).
80
Table 3.7: List of Interviews (in chronological order) Dee River Basin Senior hydrologist SEPA, Aberdeen and Perth Water quality manager Offices Water quality planner Water quality manger (Perth) Senior environmental researcher Macaulay Institute Environmental economist researcher Information and research manager Aberdeenshire Council Information and research assistant Aberdeen City Council Agenda 21 manager Water planner Scottish Water, Aberdeen Water planning assistant and Headquarter Offices Water quality scientist River Fishery Board Senior scientist National Farmers Union Regional manager Scotland Clyde River Basin Drinking water quality officer Scottish Executive, Analytical services officer Clyde River Foundation Catchment manger SEPA, East Kilbride Office Environmental Quality Planner Scottish Water, Headquarter Water resources coordinator and Glasgow Offices Southwest area coordinator Scottish Natural Heritage Freshwater officer Glasgow University Senior lecturer (fish researcher) EnviroCentre, Glasgow Scientific advisor Mott McDonald Plc, Senior consultant (water supply) Glasgow Sinos River Basin Sinos River Basin Committee Water Resources Council FEPAM ABES Pro-Guaíba ANA
Executive secretary Executive secretary Water quality scientist Director (water quality expert) Communication officer Senior consultant
81
Pardo River Basin Pardo River Basin Director (agricultural engineer) Committee Executive secretary Ecoplan Engenharia Ltd. Senior consultant Professor (geography) UNISC (University of Santa Senior lecturer (geography) Cruz do Sul) Lecturer (geography) Research assistant (water resources) UFSM (Federal University Senior lecturer (hydrology) of Santa Maria) For the interviews with stakeholders, a standard questionnaire was adopted, which is summarised in Box 3.3. This questionnaire was developed to organise and stimulate discussion about both the catchment sustainability and the proposed framework. During the interviews, two tables with the considered criteria and the related indicators were presented to the interviewees (i.e. the same tables were shown to every respondent to guarantee interview consistency). The sequence of questions was not necessarily the same in each interview, but depended on the flow of each session and the interest of the respondent. Written notes about the interview were taken and later copied to computer files (organised by catchment and question, in addition to general comments made by the respondent). The results of the interviews will be used for both the analysis of the sustainability condition of each catchment (included in Chapter 6) and also for the discussion about the adequacy of the framework of sustainability indicators (presented in Chapter 7).
82
Box 3.3: Topics Covered in Interviews with Catchment Stakeholders: (After presenting the list of water sustainability criteria and indicators) 1) Ask about the appropriateness of the water sustainability criteria and indicators 2) Ask about the appropriateness of the research strategy and techniques 3) Ask about difficulties in terms of availability of environmental and socio-economic in the catchment 4) Ask about long-term solutions to facilitate the production of data at the catchment 5) The main issues related to water sustainability identified in this research were ___________ (specific of each catchment). Ask if the respondent agrees with this conclusion; ask about the main challenges to the catchment conservation and management 3.7 Chapter Conclusions This Chapter described the approach to water sustainability assessment adopted in the research, which was designed to understand the development of sustainability indicators through the critical analysis of the political ecology of water problems. The research activities comprised the development of sustainability indicators in a process of successive testing and evaluation. A group of catchments was chosen (in pre-determined countries) to support the development of the framework of indicators. Water stakeholders were identified in those countries to discuss the selection of catchments and, afterwards, to provide inputs into the development of indicators. The development of the indicators required systematic analysis of the catchment context and the final framework of indicators was the product of the amalgamation of existing literature, interaction with stakeholders and the personal interpretation of water sustainability by the researcher. It was emphasised that the selection of appropriate indicators involved subjective judgement of the possible issues that could be included in the indicator expressions. At the same time, the indicators were also selected by considering explanatory capacity and straightforward communication of results. Because of the contested, positioned nature of sustainability indicators, it was central for the researcher to reflect about the preferences behind criteria and indicators. It was recognised that the most appropriate manner to deal with the intrinsic subjectivity of sustainability assessment was to make the background assumptions explicit to 83
those contacted during the research. The research basically followed an interactive strategy to allow the inclusion of different points of view throughout the development of the indicators. A combination of research methods was used for the characterisation of the catchments and for the calculation of the proposed water sustainability indicators. The Chapter described those different research techniques and the computer programmes employed in data gathering and manipulation. Finally, the Chapter described the interviews conducted with stakeholders in the selected catchments to discuss the indicator results and the appropriateness of the methodology. The proposed ‘water sustainability indicators’ essentially served as a tool to organise the positioned analysis of water problems, working as ‘measures of change’ rather than claiming objectivity or truth about the catchment condition. The next chapter will present the details of the indicator expressions, including advantages, innovative aspects and limitations of each indicator.
84
Chapter 4 - Framework of Sustainability Indicators 4.1 Chapter Overview This Chapter presents the criteria of water sustainability selected in this study and the related indicators developed through a series of trial stages and in discussion with local catchment stakeholders (as described in the last chapter). This group of indicators forms the central element of the developed framework, which covers the environmental, economic and social dimensions of water sustainability. All dimensions and indicators are treated equally, assuming that they are all independently essential for a sustainable condition of the water systems. For each indicator described in this Chapter, there is an initial explanation about the relevance to water sustainability and examples of comparable assessment approaches, followed by the technical details about the proposed indicator formulation. The Chapter also contains references from works included earlier in the literature review (Chapter 2). 4.2 Indicators for the Assessment of Water Sustainability A sustainable condition is the result of the balance between environmental, economic and social dimensions of water use and conservation. Questions related to the allocation and use of water evoke those three dimensions, which must be adequately assessed in order to understand the difficulties and achievements in terms of sustainability. To facilitate the understanding of the internal relationships between the three dimensions, a group of nine indicators of water sustainability is proposed here (Table 4.1). Indicator results were analysed together with other additional sources of information about local water problems. As explained in the previous Chapter, this list of indicators derived from the review of the available literature and was chosen through a process of testing and refining. The justification of the indicators is based on the discussion presented on Section 2.7 above. The starting point was the definition of key sustainability criteria and related management issues. From this broad list of criteria and issues, the most critical, but still easily manageable, group of sustainability indicators was eventually defined.
85
Table 4.1: Components of the Proposed Water Sustainability Framework Sustainability Water Sustainability Criteria Dimension Water Quality Environmental Water Quantity System Resilience Water Use Efficiency Economic User Sector Productivity Institutional Preparedness Equitable Water Services Social Water-related Well-being Public Participation For each criterion presented in the above table, there is a correspondent sustainability indicator. These proposed indicators were developed for the catchment scale, however, it is also possible to apply them to other scales of analysis (i.e. national, regional or sub-catchment levels). The indicators are combinations of subsidiary environmental and socio-economic indicators, which incorporate data about individual parameters of the water system. There is, thus, a gradual aggregation of data for the production sustainability indicator results, according to the following scheme (Figure 4.1): A G G R E G A T E
S.I. Subsidiary Indicators
Raw Data
Figure 4.1: Aggregation of Data for the Calculation of Sustainability Indicators (SI) It is important to acknowledge that the proposed framework of indicators represents a simplification of complex catchment processes and expresses personal preferences of the researcher. As proposed by Walmsley (2002), a 86
framework of indicators is essential as it assists in developing and reporting on indicators in a logical fashion in order that key issues can be readily identified and summarised. Frameworks are required to organise the indicators and to logically grouping related sets of information, thus promoting interpretation and integration and helping to identify data collection needs and data gaps. The emphasis of this proposed approach is the high-level combinations of processes that are responsible for the overall sustainability of the water system. The indicators are intended to identify trends in the critical elements that affect water sustainability in the catchment. The selection of this list of indicators had fundamental methodological and operational justifications. It involved a trade-off between the extensive number of parameters related to the management of the water system and the need to provide explanation for the sustainability condition of the catchment. Water stakeholders were involved in the selection of water sustainability issues and associated indicators during the development of the framework. The next sub-sections describe the indicator expressions, which are the result of the interactive process mentioned above. 4.3 The Environmental Dimension of Freshwater Sustainability The environmental dimension of freshwater sustainability is considered in this framework of analysis by the three criteria and indicators below (Table 4.2). For catchments where data is not available for the calculation of these three core formulations, proxy (alternative) indicators can be adopted according to the specific circumstance: Table 4.2: Criteria and Indicators of the Environmental Dimension Water Examples of Proxy Sustainability Sustainability Indicators Indicators Criteria Relative Proportion of River stretches with Water Quality Water Quality Conditions of individual water River Stretches quality parameters Ratio between Water Ratio between annual Demand and Seasonal Low abstraction and annual Water Flow, Related to Water low flow Quantity Import, Export and Rate of groundwater Recycling use System Deviation from Average Frequency of extreme Resilience Monthly Flows flow events 87
4.3.1 Water quality The first criterion of water sustainability included in this framework is the conservation of the chemical, physical and biological properties of both the aqueous matrix and the aquatic environment. Those properties characterise the ability of a water body to support all appropriate beneficial uses (EPA, 1998). Those beneficial uses are the ways in which water is utilised by humans, wildlife and the environment. It means that a good water quality is not restricted to chemical parameters, but must also consider the ecological integrity of the water environment. The precautionary conservation of good water quality is important for the sustainability of the entire water system, because it is not easy to determine the specific threshold when the system reaches an irreversible deteriorated condition. Therefore, to avoid an irreversible deterioration of the water system it is essential to maintain the quality of its chemical, physical and biological properties in the long-term. The condition of water quality is determined through extensive research and long-term data collection, due to the complexity of the water system and the different resilience of individual species. Water quality status is determined by comparing physical, chemical, microbiological, hydro-biological and ecotoxicological parameters with reference conditions. The comparison between sampled values and reference conditions represents the best scientific judgement about the impacts of water quality changes on human health and on the environment. Modern monitoring methods are able to relate the levels of various constituents, especially nutrients, with the condition of the aquatic ecosystem. In order to understand the complex dynamics of water quality, monitoring procedures have evolved from being mono-dimensional to more realistic representations of continuity of processes happening in the river system (Huang and Xia, 2001). An indicator of water quality that can be used for the assessment of sustainability should be able to describe historic trends and relations between parameters. It requires a temporal and spatial analysis of parameters, as well thresholds that can be adjusted considering local environmental conditions. An indicator should be able to relate oscillations in water quality with anthropogenic interventions in the catchment. The most common representation of water quality for sustainability assessment is the length of river stretches that fall into specific condition classes (‘bands’). Normally, the most stringent parameter defines the band, and is in other words, a classification by default. 88
Sustainability Indicator No. 1:
RELATIVE PROPORTION of WATER QUALITY CONDITIONS of RIVER STRETCHES (y/x) where:
Equation 1:
y = extension of river stretches into water quality categories according to the official classification methodology adopted locally x = total extension of river stretches
Definition
Proportion of stretches with specific water quality conditions, in relation to the total extension of river stretches. Unit of measurement
Variable units: (x) and (y) in kilometres (km) Result: percentage (%) or extension (km) of river stretches under specific quality categories Purpose
Assess the degree to which water quality is being affected by human activities in the river basin, considering stressing processes that can disrupt the autodepuration capacity of water bodies and the stability of water ecosystems. Notes
This indicator provides information about the expansion of human impacts throughout the river basin that are able to produce changes in long-term water quality of river stretches Based on the data available, each stretch of the river is classified according to quality classes (bands of water quality condition separated by thresholds). The indicator considers data accumulated during a significant time period (normally between one and three years) and, therefore, does not consider short-time events and seasonal changes 89
Each river system has its own hydrologic characteristics and particular physicochemical patterns, which depend on the climate, geology and geomorphology of the surrounding land and riverbed composition. It is not possible to establish universal thresholds for water quality, but the analysis of water quality condition considers the thresholds developed and adopted nationally or locally Innovation and advantages of the indicator
The indicator is similar to the approaches of environmental regulators (for instance in the United Kingdom) The indicator has the advantage of providing standardised information about the water quality condition (i.e. classes of water quality), therefore facilitating the comparison between river stretches and between years The indicator provides easily communicable results about the evolution of the water quality condition and facilitates the establishment of management targets Limitations of the indicator
Because of the aggregation of different river stretches, it is not possible to infer, from the final result, the specific points where water quality is improving or deteriorating in the catchment River water quality monitoring does not include evaluation of ground water pollution (moreover, due to the close interaction between ground and surface water, this is, to a certain extent, covered by the assessment of river stretches)
4.3.2 Water quantity The second criterion of sustainability is the conservation of the water balance in the river basin in order to maintain the long-term environmental integrity, while appropriately satisfying human needs. A sustainable condition requires the long-term conservation of river flows, groundwater stocks and surface reservoirs. Not only must the quantity be maintained, but the patterns of hydrological regime must also be satisfactory conserved. In particular, sustainability requires the maintenance of critical ecological flows (high and low flows) in order to preserve ecosystem structure and environmental processes. Sustainable water quantities are not only related to abstraction of water, but also interbasin transfers and physical interventions must respect hydrologic features of the river basin, not creating barriers that affect the recovering capacity of the water system. 90
To analyse whether water abstraction satisfies the quantitative requisites of water sustainability, it is necessary to make a comparison of reference conditions with changes in the hydrological regime due to human action. There is a long list of hydrological indicators that can be used to describe changes in water regime. However, over complexity must be avoided, especially because changes in some parameters may not necessarily have significant impact on sustainability. For example, Black et al. (2000) propose a method that considers any direct interventions in the drainage network, which cause a material change to the hydrological regime of a river or lake. Petts (1996) also suggests that floodplain flow, channel maintenance flow, minimum flows and optimum flows are the attributes that deserve consideration in the assessment of anthropogenic impacts on the water cycle. Sustainability Indicator No. 2:
RATIO BETWEEN WATER DEMAND and SEASONAL LOW FLOW, RELATED TO WATER IMPORT, EXPORT and RECYCLING [ y / x ] * { 100 / [ 100 - (Exp - Imp - Rec) ] } where: y = seasonal water abstraction (m3/s) x = seasonal flow of exceeded 95% of the time (m3/s)
Equation 2:
Exp = percentage of abstracted water that is exported from the river basin (%) Imp = percentage of abstracted water that is imported to the river basin (%) Rec = percentage of abstracted water that is recycled in river basin (%)
Definition
Rate of withdrawal in relation to seasonal low flows, considering imported and recycled flows and discounting exported flows. Unit of measurement
Variable units:
water flow (m3/s) 91
Result:
proportion of water abstraction
Purpose
Assess the degree to which freshwater has been appropriated for human uses within the river basin, recycled and exchanged with neighbouring areas. Notes
The rate of withdrawal includes, in principle, water abstraction for consumptive uses (domestic supply, irrigation, industry, etc). If necessary, non-consumptive uses (hydropower, fish farms, recreation, etc) can be considered separately. Seasonal low flows are the river flows that are exceeded 95% of the time (Q95), which are calculated from daily mean flow data (estimated at the downstream catchment outflow point) For the cases where other ecological minimum flow was specifically estimated, this must be used as the threshold instead of Q95 Flows imported and exported include human activities that bring water to or take water away from the river basin (interbasin transfers) The recycle flow includes water already used for certain purposes that, instead of being discharged back into the environment is used again for the same or for a different purpose Innovation and advantages of the indicator
The indicator adopted for this study includes in the same expression the rate of abstraction regarding seasonal low flows, and incorporates an additional factor related to interbasin transfers and recycling of water The indicator has the advantage of relating the level of water abstraction to the periods of critical (low) flows, therefore informing about demand pressures that can potentially disrupt the environmental equilibrium There is flexibility to establish an acceptable level of abstraction according to the environmental sensitivity of the catchment The indicator gives a positive rate to the recycling and transfer of water into the catchment, as well as gives a negative rate to transfers of water to other areas The indicator provides easily communicable results about the evolution of the water balance and facilitates the establishment of management targets
92
Limitations of the indicator
The indicator only relates human uses with low flows and not with all points of the flow duration curve The indicator aggregates water withdrawals present in the river basin Transfers of water to the catchment are not always positive to the catchment sustainability, as long as it can bring invasive species and affect the chemical properties of the receiver catchment
4.3.3 System resilience The third criterion of sustainability is the maintenance of the natural speed of recovery from unsatisfactory conditions (i.e. unsatisfactory conditions are events occurring beyond the range of values considered satisfactory). The recovery from unsatisfactory conditions is defined as the rate of system resilience (Loucks and Gladwell, 1999). Due to the dynamic characteristics of the water cycle, there is a natural level of variability in its internal processes, but a sustainable water system must recovery from exceptional conditions to guarantee the preservation of ecosystems, the stability of economic activity and the maintenance of quality of life. A low resilience condition, for example, can be the results of modification in land use in the catchment, construction of impoundments or changes in the climate. The assessment of system resilience needs to evaluate the variability of the hydrologic regime. This assessment can include deviations in the average of recorded parameters or in parameter dispersion. There are different methodologies that can quantify hydrological changes and indicate the level of system resilience. For instance, Krasovskaia (1995) analyses the stability in flow regimes on the basis of the seasonality shown in monthly flow data. Backhaus et al. (2002) proposed an approach to assess catchment landscape sustainability that considers the long term monitoring of the dynamics of water flow and matter load. Still Richter et al. (1996) formulated a method for assessing hydrological alteration using 32 parameters, which compare measures of central tendency and dispersion of each parameter.
93
Sustainability Indicator No. 3: Equation 3:
DEVIATION FROM AVERAGE MONTHLY FLOWS 12
[ Σ (Qi – QMi ) / si ] / 12 i =1
where: Qi = moth river flow (month ‘i’) QMi = long-term monthly mean flow for month ‘i’ si = standard deviation for month ‘i’ Definition
Annual average of standardised month flow deviations from the month average. Unit of measurement
Variable units: water flow (m3/s) Result: dispersion from the average Purpose
Assess the long-term reliability of the river flow (i.e. no tendency towards increased wetness or dryness). Notes
The basic principle behind this indicator is that higher variability means lower system resilience The indicator is calculated from mean daily flow, which serves to derive individual month average, historic month flow and historic standard deviation Innovation and advantages of the indicator
This is a new hydrological indicator, which considers the rate of deviation from average river flow 94
The indicator consolidates daily river flow into a single annual output, which facilitates the understanding of the water system condition for that specific year The indicator providing standardised information about the water quality condition for the whole period of analysis, therefore facilitating the comparison between years The indicator provides easily communicable results about the resilience and stability of the water system Limitations of the indicator
The indicator does not separate the influence of climate change from the influence of land cover change on runoff-rainfall figures (although such differentiation is not necessary for the assessment of trends of system sustainability) Because the indicator only takes into account annual figures, it does not show details about the severity and length of individual adverse events (floods and droughts)
4.4 The Economic Dimension of Freshwater Sustainability The economic dimension of freshwater sustainability is considered in the framework of analysis by the following criteria and related indicators (Table 4.3): Table 4.3: Criteria and Indicators of the Economic Dimension Water Examples of Proxy Sustainability Sustainability Indicators Indicators Criteria Regional (broader Economic Growth in than the river basin) Water Use Relation to Water economic growth Efficiency Demand regarding water demand Sectoral Production in Ration between water User Sector Relation to Sectoral demand and Productivity Water Demand economic output Checklist of Structure and Institutional Institutional organisational details Preparedness Requirements of water institutions
95
4.4.1 Water use efficiency The first criterion of the economic dimension of water sustainability is the requirement of an efficient and judicious use of water in the river basin. The satisfaction of human needs is a fundamental objective of sustainable development, but at the same time it requires that economic benefits should not be achieved at the expense of excessive demand for water. The water system tends towards a more sustainable condition when the aggregate economic outputs are produced with a relative reduction in the use of water. In other words, there is a tendency towards a sustainable condition if economic development is not dependent on an incremental demand for water. However, such equivalence between rates of economic outcome and rates of water use can be considered only within certain limits because, beyond a determined point, reductions in water withdrawal affect the social dimension of water sustainability. The level of water use efficiency can be assessed by the considering the relation between water resource use per unit of product or service. It means the maximisation of marginal economic benefits derived from water use. The most common indicator of economic output is GDP (Gross Domestic Product). Alternatively, GDP can be adjusted with purchase power parity [i.e. by adopting the formula: GDP = (actual value – minimum value)/(maximum value – minimum value)]. However, Daly (1996) points out that GDP is rather an index of cost, benefits and changes in accumulation and suggests the adoption of ‘Green GDP’. This new formulation of GDP discounts ‘defensive expenditures’ (costs of all environmental protection activities and expenditures for environmental damage compensation) and ‘depletion of natural capital’ (reduction in flow of products and ecosystem services).
96
Sustainability Indicator No. 4:
ECONOMIC GROWTH IN RELATION TO WATER DEMAND [ 100 *(GDP2 – GDP1) / GDP2 ] [ 100 * (demand2 – demand1 )/ demand2 ] where: GDP2 = catchment Gross Domestic Product of the current period
Equation 4:
GDP1 = catchment Gross Domestic Product of the previous period demand2 = water demand from ground and surface water for the current period demand1 = water demand from ground and surface water for the previous period
Definition
Difference between the relative variation in GDP and the relative variation in water demand (i.e. elasticity economic growth-water use). Unit of measurement
Variable units: GDP in national currency; water demand in volume (Ml/d) or flow (m3/s)
Result:
balance between economic growth and water demand
Purpose
Assess to what degree there is a relation between gains or losses in terms of catchment GDP figures and increases/decreases in water demand. Notes
This indicator includes in the same expression two processes related to different dimensions of water sustainability: GDP, as a proxy of economic production, and water demand, as a proxy of human appropriation of water
97
resources. Water demand considers abstraction from surface and groundwater sources and water transference from other river basins The basic concept behind this indicator is that the relative variation in GDP and water demand affects the level of sustainability. This indicator assesses trends of decoupling water consumption from economic growth. If the increase (or reduction) in the rate of water use is equivalent with the increase (or reduction) in economic output there is a stable water productivity condition According to this interpretation, if the relative increase in GDP happens to be higher than the relative expansion of water demand, there is a positive contribution towards water sustainability. Likewise, if the relative increase in GDP is smaller than the relative expansion of water demand, there is a negative contribution towards water sustainability. In other words, it means that part of the gain in GDP has been done at the expense of overexploitation of water In the long run, the expansion of GDP and reduction of water demand indicate gains in terms of sustainability. However, there is no necessary connection between both processes for every individual year, as long as there are other technological, climatic and structural constraints Innovation and advantages of the indicator
This is a new indicator that relates the annual rate of variation in the catchment economic output to the annual rate of change in water demand The indicator calculation intrinsically incorporates the evolution of economic output and water demand, therefore facilitating the analysis of trends and tendencies The indicator results easily communicate if there is a tendency towards a more efficient use of water (i.e. a positive result of the indicator indicates that economic growth is higher than growth in water demand, therefore suggesting a tendency towards efficiency. On the contrary, a negative result of the indicator indicates that economic growth is achieved at the expense of higher rates of water demand, suggesting a tendency towards inefficiency) Limitations of the indicator
This indicator formulation does not include threshold values for the natural limits to the expansion of water demand (i.e. threshold values for water abstraction that does not encroach upon the carrying capacity of the water system) 98
GDP is an economic index widely used and well known, which makes it very easily accessible. Moreover, there are serious limitations with the use of GDP as measurement of economic productivity, since this is more an index of cost, benefits and changes in accumulation The evolution of GDP indicates changes in economic productivity rather than changes in economic efficiency. GDP also fails to reflect the environmental damage done in generating income Particularly for sustainability analyses, it would be preferred to make use of other more environmentally coherent indices that include a discount for defensive expenditures (e.g. costs of all environmental protection activities, expenditures for environmental damage compensation, depletion of resources and quality of life), such as ‘Green GDP’.
4.4.2 User sector productivity The second economic criterion of water sustainability is the requirement for efficient use of water by the individual user sectors. The aggregate efficient use of water is required for a sustainable condition, but it also presupposes a correspondent effort of each individual user sector in the river basin. That effort is required for sectors that use either large or small volumes of water. This common requirement for all sectors is based on the fact that sustainability is a long-term goal and the relative water demand of each sector can change in space and in time. Gains in productivity by individual sectors and individual users depend on the willingness to change practices and on the opportunities available to improve efficiency, such as technological improvements and investment capacity. Sectoral water productivity can be assessed by relating the units of water used with the units of economic outcome. Alternatively, it can assess water used against the use of other inputs, such as raw materials or energy, as well as with pollution generation. Another way of addressing sector productivity is by considering the volumes of water used with the output of the respective sectors in monetary terms to evaluate in the way in which water is utilised in more general terms (Krinner et al., 1999). In a different approach, Cai et al. (2002) propose to address the sustainability of water uses by taking into account the cumulative effects of short-term water use decisions and trade-offs between the benefits of current and future generations.
99
Sustainability Indicator No. 5:
ECONOMIC GROWTH IN RELATION TO SECTORAL WATER DEMAND [ 100 * (turnover2 – turnover1) / turnover2 ] [ 100 * (sector demand2 – sector demand1 )/ sector demand2 ] where:
Equation 5:
turnover2 = economic result of the productive sector during the current period turnover1 = economic result of the productive sector during the previous period sector demand2 = water demand by the sector in the catchment for the current period sector demand1 = water demand by the sector in the catchment for the previous period
Definition
Balance between relative variation in turnover of the economic sectors and relative variation in water use. Unit of measurement
Variable units: GDP in national currency; water demand in volume (Ml/d) or flow (m3/s)
Result:
balance between turnover and water demand
Purpose
Assess to what degree there is a relation between gains or losses in sector production and increases or decreases in sector water demand. Notes
Turnover is the amount of money taken by the productive sector within a certain period of time, in this case a year
100
Water demand considers metered and unmetered user sectors (i.e. the former is charged by the metered volume of water use and the latter is charged by a fixed amount, normally related to the size of the activity) The fundamental concept behind this indicator is that a positive tendency towards sustainability depends on increases in economic production (represented by the rate of turnover) at higher rates than the increases in water demand. Consequently, where rates of water demand are higher than rates of economic growth there is a negative tendency towards sustainability Innovation and advantages of the indicator
This is a new indicator that relates the annual rate of variation in the economic results of the water user sectors to the annual rate of change in water demand per user sector The indicator calculation intrinsically incorporates the evolution of economic output and water demand, therefore facilitating the analysis of trends and tendencies The result easily communicates if there is a tendency towards more productive use of water by the economic sector Limitations of the indicator
The rate of turnover depends on market conditions and does not directly represent gains in economic efficiency The indicator needs to be related to other sources of information on the use of water by the individual productive sectors, such as expansion of productive capacity or technological changes Household water demand includes both the satisfaction of basic human needs and also luxurious uses of water (such as water gardening or private swimming pools), which may not be socially acceptable under scarcity conditions)
4.4.3 Institutional preparedness The third economic criterion of sustainability is the requirement of an adequate institutional framework to regulate water use and conservation. Sustainability depends on capable institutions to cope with social, economic and environmental questions associated with water. Appropriate institutions are necessary, among other things, for fair allocation, efficient management and conservation of water resources. In particular, robust institutions aim to provide sets of rules for allocation of water across user sectors and, thereby, administer 101
conflicting demands. An effective institutional arrangement maximises benefits to local populations and, at the same time, promotes sound environmental management in order to minimise negative impacts. The institutional preparedness can be assessed against a range of legal, administrative and technical aspects that are basic for the management of water in the river basin. An indicator of institutional sustainability can gauge whether a certain character is given or not, the hierarchy of qualitative states or still quantitative information linked to specific targets. Spangenberg et al. (2002) affirm that indicators of sustainable institutions must consider not only the existence of organisations, but also their effectiveness. Another example was proposed by Ostrom et al. (1993) as a framework to evaluate the different institutional arrangements based on five criteria: 1) economic efficiency; 2) equity through fiscal equivalence; 3) redistributional equity; 4) accountability; and 5) adaptability.
102
Sustainability Indicator No. 6:
CHECKLIST OF INSTITUTIONAL REQUIREMENTS 08
Σ Xi i=1
where: X1 = Legislation addresses water management at the river basin level X2 = River basin management is formally connected with the regional / national system of water management
Equation 6:
X3 = River basin management is organised / regulated by specific plans and programmes X4 = Water allocation mechanism is based on local hydrologic assessments and appropriate criteria X5 = Allocation of water takes into account social and environmental priorities of use X6 = Existence of a river basin organisation with specific water management duties X7 = Hydrologic and water quality monitoring with satisfactory space and time coverage X8 = Capacity building activities at the catchment level
Definition
Number of institutional requirements that are properly satisfied, according to a list with eight basic requirements. Unit of measurement
Result:
sum of checklist items
Purpose
103
Assess the level of adequacy to which institutions are organised in order to implement an integrated river basin management approach that contributes to the construction of water sustainability. Notes
In order to represent the main issues related to institutional arrangement, this particular indicator relies on eight fundamental requirements of the river basin institutional preparedness and performance. The list includes aspects that summarise the range of technical, administrative, economic and socio-political challenges posed for river basin institutions. It addresses the responsibilities of both river basin authorities and other governmental organisations. River basin institutions covers not only agencies or organisations, but also includes the way in which stakeholders interact with organisations, the processes by which decisions are made, and activities undertaken to implement their goals (encompassing technical and normative instruments). The institution arrangement of a river basin is thus defined as the combination of administrative structures, key participants, legislation, policies, economic arrangements, political structures, traditional customs and values In terms of administrative structures, the river basin institutional arrangement encompasses two kinds of different regulators: there is a first group that operate exclusively at the river basin scale (like agencies and committees); there is a second group that operate as part of other government agents (affiliated to local, state, or national administrative spheres). The latter group includes environmental agencies, local authorities, agricultural service, forestry service, water supply and sanitation, etc. Part of those functions under the responsibility of governmental agencies can be opened to private enterprise The river basin scale is the adequate level of governance for the management of water resources and requires some form of institutional organisation to deal with the river basin specific questions. The main justification for having a separate administrative structure is the fact that public management agencies have shared and fragmented responsibilities, either from one level of government to another (local, state, national) or among agencies at the same level of government (water, agriculture, forestry, etc.). This normally creates incomplete response or excessive distance between the problem source and the government agent in charge
104
Table 4.4 lists the group of requirements to be taken into account for the analysis of institutional preparedness and performance. The particular function that each requirement describes for the river basin management process is also described, as well as the main attributes can be expected Table 4.4: Institutional Requirements, Functions and Expected Attributes Expected Institutional requirement Functions attributes Legislation addresses water Comprehensive management at the river basin Regulatory and updated level River basin management is formally connected with the Integrated and Strategic regional/national system of water co-operative management River basin management is Systematic and organised/regulated by specific Planning effective plans and programmes Water allocation mechanism is based on local hydrologic Rigorous and Efficiency assessments and appropriate efficient criteria Allocation of water takes into Judicious and account social and environmental Justice consequent priorities of use Existence of a river basin organisation Competent and Responsibility with specific water management representative duties Hydrologic and water quality Accurate and monitoring with satisfactory Information continuous space and time coverage Capacity building activities at the Informative and Pedagogic catchment level formative Innovation and advantages of the indicator
This is a new indicator formulation that assesses the institutional preparedness against a set of selected parameters 105
The indicator summarises the most critical requirements that an institutional framework should include for the promotion of the sustainable management of water Despite the fact that this indicator included qualitative aspects of the institutional framework, the assessment of those aspects is straightforward Limitations of the indicator
This list of institutional requirements included in the indicator formulation describes an ideal conceptual model of river basin management, which is based on some successful experiences around the world. Moreover, it demonstrates an affiliation with certain preferences in terms of river basin institutional arrangements. Those preferences favour participatory approaches, comprehensive governmental regulation and some governmental direct provision of services
4.5 The social dimension of freshwater sustainability The social dimension of freshwater sustainability is considered in the framework of analysis by the following three criteria, which are related to three core sustainability indicators and, if necessary, potential proxy indicators (Table 4.5): Table 4.5: Criteria and Indicators of the Social Dimension Water Sustainability Sustainability Examples of Proxy Criteria Indicators Indicators Urban and rural access to water Equitable Water Access to Water services Services Services Drinking Water Standards Water use per capita Water-Related Well- Well-being in Relation Catchment indicators being to Water Demand of quality of life Number of meetings or events related to Checklist of water management Public Participation Participatory Number of water Requirements users involved in setting water management targets 106
4.5.1 Equitable water services The first criterion of the social dimension of water sustainability is the requisite that all persons, regardless of social characteristics or position in the catchment, have access to satisfactory water supply. Avoiding social exclusion and securing durable water services is not an end in itself, but means to alleviate poverty and improve quality of life. To fulfil those requirements of sustainability, water must be equitably allocated to permit the satisfaction of human needs, as well as to meet ecosystem demands. This implies that every person has access to satisfactory amounts of good quality water, but also takes proportional responsibilities for the maintenance of the water system. In addition, this criterion of sustainability presupposes that the access to good water supply is affordable to all and charges should compensate disadvantaged social groups. The assessment of equity in supply and sanitation services can comprise differences in resource distribution or can address a particular system structure. It can also include the size of the community served and the cost of services. Mukherjee (2002) proposes an approach based on parameters that indicate the minimum sustainability levels and, at the same time, demonstrate socially empowering, such as demand rate structures, landscape water use, plumbing and irrigation systems and education programs. A straightforward indicator is the satisfaction of minimal performance standards of water services. Sustainability Indicator No. 7:
Equation 7:
ACCESS TO WATER SERVICES ( x * 100-1 ) where: x = percentage of population served by potable water supply (or by adequate sanitation services)
Definition
Percentage of catchment population with access to water supply (or by improved sanitation). Unit of measurement
Variable units:
(x) in percentage of the catchment population 107
Result:
percentage (%) of service coverage
Purpose
Assess the degree to which water supply and sanitation services satisfactory attend the local population. Notes
Potable water supply means the existence of opportunities to satisfy the basic needs of the population with reasonable regularity, without contamination risks and with no abusive charges. It includes public and private supply systems, and also diffuse sources of water for the rural or peri-urban population Adequate sanitation means the existence of opportunities to connect domestic water system with the sewerage network. It includes public and private sewerage systems, as well as alternative, small-scale schemes There are economic and operational reasons to accept that total coverage is unlikely to be attained, because it is simply inappropriate in many circumstances for rural consumers to be connected. Those not connected rely on sources such as private wells, public water fountains, and private water vendors. There are, thus, limits for connecting population to water supply and wastewater treatment plants This indicator fundamentally addresses intra-generation equity (between people of the same generation). The basic underlying concept is that a more equitable condition is created if more people have access to water and sanitation services. Inter-generation equity can be inferred by considering the tendency of indicator results along the years. In other words, if the indicator demonstrates a steady increase in supply and sanitation services along the time, a lasting result in terms of equity can be expected Innovation and advantages of the indicator
The indicator is similar to the approaches adopted by environmental regulators and international organisations (for instance by development programmes in developing countries) The indicator addresses a basic aspect of the social dimension of water sustainability, which is the access to potable drinking water and adequate sanitation services 108
The indicator easily communicates the proportion of the population that is not served by water services Limitations of the indicator
The indicator does not provide explanation if improvements water services are the result of redistribution of the same amount of water or more resource being explored The indicator does not consider other factors that influence equitable water services, such as tariffs and subsidies, macro-economic policies, or leakage rate of the water distribution system The indicator does not address technical aspects of the quality of water supply and difference between urban and rural access to water
4.5.2 Well-being due to water availability The second criterion of the social dimension of water sustainability is an adequate level of social well-being derived from water availability and its direct and indirect utilisation. Water is fundamental for health and hygiene, as well as providing recreation and enjoyment services. Human well-being is the cumulative result of many factors related to water availability, such as diet, household environment and pleasurable landscape. Well-being and water are also associated with the prevention of floods and droughts. Satisfactory water availability is, therefore, paramount for public health, quality of life, food security and household safety. There are no universal figures on the water needed to promote well-being, because it differs from one culture or local conditions to another. It terms of well-being assessment, Neumayer (2001) observes that the relation between indicators of well-being and sustainability can be problematic, because sustainability is most commonly defined as non-declining utility or wellbeing over time. This means that the orientation towards indefinite system continuation makes most indicators of sustainability rather focused on the capacity to provide utility in the future, rather than including the measurement of current well-being. In order to overcome such contrast, more recent indicators have attempted to fully integrate the measurement of current welfare with that of intergenerational sustainability into one single indicator. For example, Desai (1995) proposes that the intensity of environmental exploitation should be discounted from well-being indicators (which means that well-being in the present due to environmental exploitation reduces the well-being in the future). Other authors integrate environmental degradation into the calculation of well-being 109
indicators, such as the pollution-sensitive index proposed by Vega and Urrutia (2001). Sustainability Indicator No. 8:
WELL-BEING IN RELATION TO WATER DEMAND [100 * (well-being2 – well-being 1) / well-being 2] [ 100 * (demand2 – demand1 )/ demand2] where: well-being2 = indicator of well-being related to water of the current period
Equation 8:
well-being1 = indicator of well-being related to water of the previous period demand 2 = per capita water demand of the current period
Definition
demand 1 = per capita water demand of the previous period
Difference between relative variation of well-being indicators related to water and the relative variation in water demand. Unit of measurement
Variable units: HID is a dimensionless index with a range between 0 and 1; water demand in volume (Ml/d) or flow (m3/s)
Result:
balance between well-being and water demand
Purpose
The indicator relates the evolution of an index of well-being and the expansion of water demand. It assesses to what degree there is a relation between gains or losses in terms of catchment well-being and increases or decreases in water demand. Notes
110
The basic assumption behind this particular indicator is that water contributes as one of the very basic aspects of human well-being and, up to certain limits, more domestic consumption of water represents a better quality of life. For the assessment of well-being in the river basin indicators of well-being that are related to water availability, such as frequency of gastric diseases, gastroenteritis, diarrhoea, and intestinal-worm infestation are adopted. It can also include more subjective issues, such as level of personal satisfaction or values conferred to water bodies. An international indicator of well-being, which can be easily adjusted for the catchment scale, is the Human Development Index (HDI), calculated by the UN-Development Programme. HDI comprises three variables, which are aggregated via simple arithmetic average: per capita income, life expectancy (a as proxy for health achievement) and adult literacy together with education enrolment (as a proxy for education attainment). (Nevertheless, Morse (2003a) identified substantial differences in the HDI results of 114 countries when recalculated the indicator using the various methodologies employed by the UNDP; such deviations make temporal comparisons of progress difficult.) Although HDI does not address well-being in relation to water availability, the three variables included in its expression have an indirect relation with the quality of water supply. Innovation and advantages of the indicator
This is a new indicator that relates the annual rate of variation in well-being parameters with the annual rate of change in water demand The indicator calculation intrinsically incorporates the evolution of economic output and water demand, therefore facilitating the analysis of trends and tendencies The indicator results easily communicate if there is a tendency towards a more efficient use of water (i.e. a positive result of the indicator indicates that economic growth is higher than growth in water demand, therefore suggesting a tendency towards efficiency. A negative result of the indicator indicates that economic growth is achieved at the expense of higher rates of water demand, therefore suggesting a tendency towards inefficiency) Limitations of the indicator
The indicator fundamentally addresses the quantifiable elements of well-being associated with the use of water (such as improvements in health or longevity) 111
It is relatively difficult to quantify other subjective elements of well-being associated with water availability (such as improvements in amenity)
4.5.3 Public participation The third social criterion of water sustainability is the effective participation of the river basin society in the decision-making process related to water management. Sustainability is a social construction of more sensible approaches to common resources and, therefore, it requires mechanisms for the legitimate representation of multiple interests and opinions that contribute for the achievement of common goals. Social involvement aims to improve the level of confidence in the decision by sharing information and uncertainties with all those affected, facilitating changes in established practices. Participatory decisionmaking is expected to improve system performance by involving users in the process as a way to encourage changes among beneficiaries themselves (Parkes and Panelli, 2001). Public participation also plays an important role in disseminating information and raising awareness about water sustainability problems. It facilitates the promotion of behaviour changes that are necessary to curb overuse and pollution of water (Corral-Verdugo et al., 2002). Lockie et al. (2002) observe that the complexity of relationships between social change and natural resource management has generated interest in the identification of indicators that provide more streamlined means for monitoring and planning. For example, Healey (1997) identifies five parameters for participatory and democratic governance: range and variety of stakeholders concerned with local environmental quality; spread power from formal agencies of government; framework for informal intervention and local initiatives; inclusion of all members of the community, recognising diversity; and continuity and accountability. Morrissey (2000) separates groups of participation indicators aiming to address the level and quality of participation (process indicators), the impact of participation on self-development and community capacity (development indicators), and the impact of participation on policy or change (instrumental indicators). Watson (2001) makes use of five elements to analyse public participation in water management: compatible motives, equitable representation and power, adaptive capacity, adequate resources and the final outputs and outcomes.
112
Sustainability Indicator No. 9:
CHECKLIST OF PARTICIPATORY REQUIREMENTS 08
Σ Xi
i =1
where: X1 = Legislation delegate water management decision-making to water users and civil society X2 = Practice/mechanism of water management includes stakeholder participation X3 = Opportunities for public participation at the regional/national system of water management Equation 9:
X4 = River basin planning is conducted via participatory approaches X5 = The majority/totality of stakeholder sectors are properly involved in the river basin management X6 = Policy making is influenced by river basin public participation X7 = Conflicts among water users are considered and dealt at the river basin level X8 = Campaigns/activities that aim to involve the river basin population at large
Definition
Number of public participation requirements that are properly satisfied, according to a list with eight basic requirements. Unit of measurement
Results:
sum of checklist items
Purpose
Assess the level of participation available for the different stakeholder groups and their options to become effectively involved in the decision-making process for the river basin management. Notes 113
Participatory river basin management means that water users and civil society representatives contribute to define problems, set priorities, select technologies and policies, and monitor and evaluate impacts. Sustainable management gives equal opportunity for minorities and excluded groups to participate in the decision-making. It creates the conditions for the empowerment of water users and civil society stakeholders, and very often ends up challenging traditional power structures The appropriate level of participation depends on specific goals and circumstances of the river basin context, as well as on the expectations and capabilities of the beneficiaries themselves. It constitutes an adaptive process, which progressively searches to design mechanisms for organising stakeholders and facilitating collective action. It takes into consideration the interaction in time and space not only between individuals but also between individuals and the natural dynamics of water resources. It means that the management of a complex system like a watershed must be associated with a process of individual and social learning. For this reason, there is not one single possible framework for public participation, but it varies according to the level of inputs provided by stakeholders, the control over decision-making, and the authority and responsibility that rest with society There are internal and external obstacles that hinder the development of participation within a river basin. These include governmental interference and economic interests, as well as non-cooperative social groups and cultural conflicts. Public participation produces better outcomes when it is able to recognise the range and variety of stakeholders. It means fostering social inclusion and maintaining management decisions continually and openly accountable
Table 4.6 lists the group of requirements to be taken into account for the analysis of public participation in relation to water management. The particular function that each requirement describes for the river basin management process is identified, as well as the main attributes that are expected to be achieved.
114
Table 4.6: Institutional Requirements, Functions and Expected Attributes Expected Institutional requirement Functions attributes Legislation delegate water management Comprehensive Regulatory decision-making to water users and and updated civil society Practice/mechanism of water Democratic and management includes stakeholder Inclusiveness unrestricted participation Opportunities for public Real and participation at the regional/national Integration independent system of water management River basin planning is conducted Representative Empowerment via participatory approaches and reflective The majority/totality of stakeholder Qualified and sectors are properly involved in the Engagement critical river basin management Policy making is influenced by river Effective and Responsiveness basin public participation comprehensive Conflicts among water users are Legitimate and considered and dealt at the river Dialogical equitable basin level Campaigns/activities that aim to Frequent and involve the river basin Educational organised population at large Innovation and advantages of the indicator
This is a new indicator formulation that assesses the level of public participation against a set of selected parameters The indicator summarises the most critical opportunities for public involvement that are needed for the sustainable management of water Despite the fact that this indicator included qualitative aspects of public participation, the assessment of those aspects is straightforward Limitations of the indicator
This list of requirements for public participation, included in the indicator formulation, describes an ideal conceptual model of river basin management, which is based on successful experiences. It demonstrates affiliation with certain preferences for the participatory process. Those preferences are in 115
favour of bottom-up, critical approaches and ample opportunities for public engagement 4.6 Chapter Conclusions This Chapter presented the framework of sustainability criteria and the related indicators that were developed for this study. The group of nine indicators was selected taking into account the local context of the selected catchments. These indicators cover the environmental, economic and social dimensions of sustainable development, which should be considered together for the assessment of the sustainability of water systems. The indicator expressions were defined by establishing trade-offs between the critical parameters of water sustainability and the requirement of an easy calculation and clear communication of results. It was decided to give the same treatment to all indicators, since they incorporate equally important requirements for sustainable water systems. The Chapter presented the relevance of the indicator for water sustainability, the definition and equation, underlying concepts, advantages and limitations of the proposed indicators, as well as examples of proxy (substitute) indicators. This framework of sustainability indicators was applied to four catchments to test its appropriateness. The next Chapter will describe the catchments for which the indicators were developed, preceded by an explanation of the national institutional context of water management in Scotland and in Brazil.
116
Chapter 5 - National Water Policies and the Selected Catchments 5.1 Chapter Overview This Chapter gives the historical and institutional context of the water sustainability problems in Scotland and in Brazil: the two countries chosen for this research. The Chapter describes the four catchments selected, Clyde, Dee, Sinos and Pardo, provides general information about the physical characteristics of the catchments and includes a brief overview of the economic development, related environmental conflicts and regulatory framework in each country. This background of water sustainability problems provided the context for the development of the framework of indicators and underpinned the calculation of the individual indicators of sustainability in the next Chapter. Table 5.1 summarises the four catchments chosen for this study. Table 5.1: Key Information of the Four Catchments Item units Clyde Dee Sinos Pardo Population n 1,803,110 247,928 1,248,716 202,932 2 Area km 3,376 2,100 3,729 3,749 River length km 171 126 190 117 Mean yearly mm/yr 930 - 1,300 810 - 2,100 1,810 1,656 precipitation Mean yearly flow m3/s 49 47 80 66 (downstream point) Data Sources: Ecoplan (1997), RS (2002), GRO (2003), Magna (1996), SEPA (2000a), SEPA database, SPJC (2003) and Warren (1985) 5.2 Water Management Pressures and Responses in Scotland Scotland has, at the beginning of the 21st Century, been reorganising its public administration and, in particular, environmental regulation under the new conditions created by political devolution in 1999. Post-devolution, a range of previously centralised responsibilities, including water regulation, was transferred from London to Edinburgh. The transition towards devolved administration, understandably, produced tensions and uncertainties and also major administrative challenges related to the recent establishment of a semi117
autonomous parliament and executive government. As argued by Jones et al. (2004) devolution is shaped by, and also shapes, the actions and strategies of a variety of state personnel, who are active in producing the new territories and scales of governance in the United Kingdom. At the same time, Devolution raises opportunities for enhanced ownership of the decision-making involved in water regulation, with potentially positive results in terms of efficiency, transparency and equity. Scotland is a country with a general abundance of water resources when the annual average of rainfall and runoff is taken into consideration. However, while the overall national situation is certainly satisfactory, there are regional imbalances, which justify the need for improved management and, in particular, control over water abstractions (Adeloye and Low, 1996). The great majority of the Scottish population and economic activities are concentrated in a relatively small area surrounding Glasgow and Edinburgh, commonly termed the ‘Central Belt’. The high population density in the Central Belt is the cause of most of the problems in relation to water supply and water pollution. There are relatively low rates of rainfall along the East Coast of Scotland, putting additional pressures in those areas, particularly in small catchments with high water demand. This all serves to reinforce the importance of promoting appropriate management of water resources in Scotland (Dunn et al., 2003). In addition to local environmental pressures, there are uncertainties related to changes in the climatic and hydrological regimes in Scotland. For instance, Doughty et al. (2002) affirm that the mean annual flows in rivers and the frequency of flood events in western catchments of Scotland have increased in recent years as a result of climate change rather than catchment-related processes. Bennett and Smith (1994) show an increasing wetness over Scotland of approximately 40% in terms of yearly mean flow during 1970-89. Anderson et al. (1997) calculated that for the period 1973-94 the mean discharge of the Tay River increased by 13% in comparison to the period covering 1960-72. In terms of aggravated scarcity, Werritty (2002) argues that a drier summer condition could increase the demand for public water supplies by 5% over the period 1990-2021 and with an even higher increase in the amounts of water used for spray irrigation, which could raise by up to 115%. On the other hand, Price and McInally (2001) argue that in Scotland a defence against a flood with 1:100 years return period built in 1990 may only protect against floods with 1:60 years return period in 2050. Due to the reorganisation related to political devolution and in order to cope with those local pressures and climatic variability, the management of water resources in Scotland has been in a state of rapid change. Nevertheless, some 118
basic problems still remain, such as the notoriously fragmented framework of water management (Soulsby et al., 2002) and the hesitation to adopt catchment management approaches (Werritty, 1997). Warren (2002) explains that management of water in Scotland has been characterised by specifically targeted organisations, allowing for focused, locally oriented management, but lacking a more holistic perspective. Historically, the right to abstract water from surface and groundwater in Scotland has been founded in common law, without the need for previous authorisations or licences (Wright, 1995). The only exceptions have been public water supply, large hydro schemes, special buildings requiring planning permission and a few catchments with irrigation in the East Coast. However, the practical reason for not developing a proper abstraction control system was widely held belief that Scotland had excess water resources, so a widespread regulatory framework was considered unnecessary (Fox and Walker, 2002). This fragmented water management framework started to improve in 1996, prior to devolution, when the Scottish Environment Protection Agency (SEPA) was constituted. The new agency incorporated the responsibilities of seven predecessor River Purification Boards, the Island councils and Her Majesty’s Industrial Pollution Inspectorate. After devolution, SEPA became accountable to the Scottish Minister of the Environment and the Scottish Parliament. The water services were also reorganised with three public water authorities established in 1996 and later merged, in 2002, to give rise to a single water authority called Scottish Water. Other organisations, such as Scottish Natural Heritage (SNH), District Salmon Fisheries Boards and 32 local authorities retain complementary responsibilities for water management. In particular the conservation of aquatic landscapes, habitats and biota is shared between SEPA, SNH, and the water authority. Flood defence and land drainage remain primarily the responsibility of local authorities and landowners. The privatisation of water services seems to have attracted increasing support in Scotland. For instance, in 1994 a postal referendum showed that 97% of the population rejected the privatisation (The Economist, 2003). However, in 2004 a new poll by the Scottish Consumer Council (SCC) found that the percentage has dropped to 70%. The reduction has been attributed to concerns about levels of investment, inefficiencies in the industry and high water tariffs (BBC News, 2004). Simultaneously to this rearrangement of public agencies, recent advances in the legislation have emphasised river basin management, and have also placed priority on public involvement and integrated water management approaches. 119
With repercussions for all European countries, the Water Framework Directive (WFD), came into force in December 2000 and institutionalised ecosystem-based objectives and planning processes at the catchment level (Kallis and Butler, 2001). White and Howe (2003) point out that the WFD can have far-reaching implications due to the recognition of the river basin as a new administrative unit of management. Chave (2001) argues that the most important features of the Directive are: 1) the management of water on river basin basis, 2) the use of combined approaches for the control of pollution, setting emission limits and water quality, 3) the provision that users bear the costs of providing and water use reflects its true costs, and 4) the involvement of the public in making decisions. According to Blöch (1999), European waters were in need of more protection and the WFD came as a response because it combines approaches of emission limit values and quality standards, stimulating economic efficiency and public involvement. At the beginning of 2003 Scotland became the first European country to transpose the WFD into national legislation. The Water Environment and Water Services (WEWS) Act established, for the first time, a source-to-sea planning framework for river basin management designed to reduce levels of pollution and enhance habitats supporting wildlife. The new Act specifically requires SEPA to consult communities, businesses and other interested parties (Scottish Parliament, 2003; WWF, 2003a). The direction proposed by the Scottish WEWS Act coincides with most of the objectives of water sustainability. It aims to achieve the conservation and improvement of quantity and quality of water resources while considering the environmental and social requirements at large. Moreover, Hendry (2003) warns that, being an ambitious piece of legislation, it requires a profound change in the structure and culture of organisations that deal with water management. It may create fierce disputes over costs to reduce impacts on water resources, which would require serious negotiation. The implementation of the WEWS Act presents numerous challenges, politically and institutionally. Government activity at any level that is related to water, and is likely to increase costs, will be met with opposition. This attitude may cause problems as decision-makers attempt to increase effective participation in water management. However, citizen participation is a key principle of the modern water legislation, inextricably bound up with sustainable development, but it may be the hardest principle of all to put into effect in water management in Scotland (Hendry, 2003). Those new political, institutional and legal processes have gradually invited Scotland to incorporate water sustainability into policies and programmes. It is worth mentioning an ongoing initiative of measuring progress towards 120
sustainability called Indicators of Sustainable Development for Scotland (water quality is one of the 24 indicators of sustainable development monitored). The ultimate purpose of this methodology is the reduction of the impact of present actions on future generations by radically reducing the use of resources and minimising environmental impacts (Scottish Executive, 2003a). For the Scottish government, “sustainable development is about holistic thinking and promoting integration rather than about making trade-offs. It will not be achieved simply by weighing competing demands in the balance. It is not a matter of economic development versus environment but of development based on proper management of environmental resources and consideration of full life cycle impacts and costs” (Scottish Executive, 2002a: 5) The same document states that a strategic approach to water catchment management under the Water Framework Directive will improve the water environment for the whole of Scotland, bringing benefits across the board from communities to biodiversity. The non-governmental organisations of Scotland have also been directly involved in translating sustainable development into local action and relating it to the management of natural resources. For example, Friends of the Earth emphasise the connection between sustainability and environmental justice in Scotland, demanding a ‘decent’ environment for all, with no more than a fair share of the natural resources (Scandrett, 2000). WWF highlight the urgent need to promote integrated river basin management in order to tackle poverty and meet the challenges of sustainable development, as well as to arrest the wasteful use of scarce water resources. According to WWF, using the river basin as the unit of management allows the plight of interconnected parties to be considered in order to balance the costs and benefits of different interventions to deliver the most efficient, equitable and sustainable option for development (McNally and Tongetti, 2002). 5.3 Catchments in Scotland The section above described the overall context for the application of the proposed framework of water sustainability indicators in the two catchments in Scotland. The following description of the river problems will provide the basis for the calculation of the respective indicators in the next chapter. The first selected catchment is the Clyde in the West of Scotland, a region that played a fundamental role in the industrialisation of the country. The rapid economic growth and relaxed environmental control meant that the river faced progressive deterioration of water quality, as will be discussed later in the next chapter. The 121
second catchment is the Dee, in the Northeast of Scotland. The headwaters of the River Dee are located in high mountains with outstanding environmental importance and of significant for tourism and recreation. On its lower reaches, however, the Dee has suffered from growing levels of urbanisation and industrialisation. Figure 5.1 illustrates the location of the two Scottish rivers analysed in this study.
RIVER DEE
RIVER CLYDE
Figure 5.1: Rivers Clyde and Dee in Scotland (Source: SEPA, 2003a) 122
5.3.1 The Clyde catchment Munro (1907: 08) observed that “the Clyde (...), when one comes to think of it, is not one river, but three, so wholly different are her character and destiny at different parts”. The river geography demonstrates remarkable hydrological and environmental variation throughout its 171 km length, as described by Bean (2001). The river has its origins in the North Lower Uplands and the upper reaches are nutrient poor with low biological production. Moving downstream (to the north), water flow and nutrient concentration increase significantly. In its middle reaches, the river offers supporting habitat to a range of terrestrial and aquatic flora and fauna. Further downstream, the lower river comprises the estuary around the Glasgow metropolitan area, where the river morphology is carefully controlled and the progression of saline waters is prevented by the presence of a tidal weir. The Clyde estuary has only partially mixed water circulation and relatively shallow depths. Finally, more downstream, the vast firth is formed by a large number of fjordic sealochs.
Figure 5.2: Glasgow and the Clyde Area History shows that there were unique opportunities for capital accumulation in the lower Clyde in the 18th and 19th centuries. Due to economic expansion, the river had to be modified to satisfy the needs of trade and industry. Trade started to improve in Scotland, particularly after the Act of Union in 1707, when Scottish merchants were given rights to trade freely with English colonies in America (Herman, 2003). The Clyde was transformed into the main backdrop of the industrial revolution in Scotland, particularly due to gradual improvement 123
in shipbuilding (Marwick, 1898). Schwerin (2004) demonstrates the emergence of complex regional innovation systems in the Clyde shipbuilding industry in the 19th Century, both in technological and financial terms. The industrial and trade demands forced a succession of efforts to make the river more accessible for ships ever increasing in size and, since the beginning of the industrialisation of the region, there was a constant concern with the geographic limits imposed by the river on navigation and trade (House, 1975; Riddell, 2000; Robertson, 1949; Walker, 1984). James Deas, one of its most distinguished navigation engineers, stated in 1873 that probably for no river in Great Britain has so much been done ‘by art and man’s device’ as for the river Clyde. After the Second World War, the economy in the Clyde faced a dramatic transformation with the continuous decrease in shipbuilding industry. Smith (1985a) observes that, from being a river lined with shipyards, only a handful remained and the Clyde lost its international position in the global market. Shipbuilding continued to decline and manufacturing followed suit (OECD, 2002). The region became characterised by the social ills of an appalling housing environment, chronic overcrowding and the industrial problems of a collapsing manufacturing base. Around 80% of the most disadvantaged communities in Scotland are located within the City of Glasgow itself and similar problems of social polarisation occur across the Clyde River Basin (CWWG, 2002). On the other hand, in the most recent decades the river Clyde has provided the context for the regeneration of Glasgow area and has been identified as one of the key assets of the region (OECD, 2002). The Glasgow and Clyde Valley Joint Structure Plan has been an attempt to deal with the social and environmental restoration of the river basin (Goodstadt, 2001). This Plan identified crucial challenges, such as re-establishing the River Clyde as a major contributor to economic life, creating opportunities for further riverside housing developments, and redefining the physical, social, cultural and economic relationship between the river, its neighbouring districts and the metropolitan core (SPJC, 2003). The intensification of economic activities produced not only negative social consequences, but also the environmental condition of the catchment was significantly impaired. As a direct consequence of industrial and urban expansion, water quality gradually became, in the end of the 19th Century, a matter of serious concern, as reported by Gillespie (1876), Glaister (1907), Pollock (1898), Randolph (1871) and Rivers Pollution Commission (1872). The Clyde and its many tributaries became so polluted that since 1834 the City of Glasgow started to look for alternative sources of public supply. In 1859, drinking water for the larger urban areas in the Clyde came from Loch Katrine: a neighbouring 124
catchment. The Loch Katrine project was the largest in Scotland (343.20 Ml/d) from the time of the construction to the opening of the analogous Loch Lomond scheme in 1975 (Scottish Water, 2002). Throughout the years, it has been recurrently declared that water is abundant and the existing sources are sufficient to satisfy a rising demand (e.g. Hunter, 1933), but this belief in the abundance of water resources has led to a highly overstretched supply system in the Glasgow conurbation. Likewise, the lower Clyde is an area naturally prone to floods, but human action has had major influences on flooding, such as siltation, reduced channel capacity and changed flow regime (WWF, 2002). Fleming (2002) produced a map that shows the Lower Clyde with very restricted floodplain storage available, aggravating the potential of flood impacts. Werritty et al. (2002) highlight the social and health costs in the area, due to a combination of local environmental change and increased climatic variability Nowadays, the environmental condition of the Clyde is a mixed picture of problems and achievements. After a century of deterioration of water quality due to domestic and industrial pollution, and the subsequent loss of numerous species of fish and invertebrates, the situation has been improving since the 1960s. The River Clyde, which had lost its entire migratory fish population in the 1860s and was virtually fishless in the lower reaches, has recovered to the point that salmon and other migratory species are now returning. The migratory fish first reappeared in the 1980s, but only in 2002 the survey was sufficient to show that salmon have come back in healthy numbers (W. Yeomans, pers. comm.) Although commercial salmon fishing was never widespread on the Clyde, the return of salmon is symbolically important and is also a sign of big improvements to water quality: like sea trout, which have also reappeared in the Clyde system in recent years, salmon are very sensitive to environmental conditions and require cool, welloxygenated water to thrive. However, according to McAlpine (1999), there are still considerable threats to the quality of Clyde waters, such as diffuse pollution from agricultural and urban sources, aggravated by changes in the pattern of rainfall. Moss (2003) still doubts whether water quality results can really show any improvement at all in the past 20 years, affirming that present systems only accurately represent the solution to the largely 19th Century problem of gross organic pollution and ignore much greater current problems. Apart from water quality problems, Table 5.2 demonstrates the overall tendency of increasing water demand in the Clyde catchment for approximately 165 years. In addition to the consumptive uses of water included in that Table, three small hydroelectric power schemes are located at Bonnington and Stonebyres, which divert 25 cumecs of the river through the turbines. A more 125
recent scheme was installed at Blantyre Weir and makes use of 22 cumecs (CRPB, 1985a). It is relevant to mention here three specific studies commissioned to assess the water balance in Scotland due to increasing water demand. The first study (SDD, 1973) calculated that the demand of water in the Lower Clyde was 163 l/head/day and 319 l/head/day for respectively domestic and trade uses. For the Upper Clyde (Lanarkshire), the respective figures were 249 and 115. This document projected a geometric expansion in water consumption for the following decades: 32.8% in average from 1971 to 2001 for Lanarkshire and 13.8% for the Lower Clyde. Those forecasts were not confirmed and the second study (SDD, 1984) concluded that developed water resources were adequate to meet demands, although local problems still persisted. The second report stated that a net decrease in demand was expected on the basis of static industrial consumption and reduced levels of leakage. One decade later, the third study (Scottish Office, 1994) calculated a total water demand of 1,067.50 Ml/d in 1991 (and a rate of leakage of 290.31 Ml/d) for the Strathclyde area (including other parts of the West of Scotland). Unfortunately, the territorial boundaries considered in those three different reports and the assumptions behind the results make it difficult to compare the figures. Table 5.2: Summary of Water Demand in the Clyde (1838-2003) Total Daily Year Demand* Coverage Area Source of Information (l/head/day) 1838 118.2 Glasgow Burnet, 1869 1852 177.3 Glasgow Burnet, 1869 1871 218.2 Glasgow Glasgow Corporation, 1955 1901 254.6 Glasgow Glasgow Corporation, 1955 1921 277.3 Glasgow Glasgow Corporation, 1955 1951 318.2 Glasgow Glasgow Corporation, 1955 364.0 Lanarkshire 1971 SDD, 1973 482.0 Lower Clyde 1991 482.0 Strathclyde Scottish Office, 1994 503.4 West of Scottish Executive, 1998 Scotland 2000a
126
1999 1999 2000 2001 2003
136.0 ** 505.4 523.9 517.6 452.5
West of SWA, 2000 Scotland West of Scottish Executive, Scotland 2001a West of Scottish Executive, Scotland 2001b West of Scottish Executive, Scotland 2003b Lanarkshire (private consultancy) * Includes metered and unmetered demand ** Domestic demand only
There has been an institutional evolution in the regulation of water management in the Clyde, however, one of the main problems for the regeneration of the river is the absence of co-ordinated action by the local authorities located in the river basin, and between those and the national environmental agencies (Scottish Executive, 2002b). The serious pollution condition prompted the establishment, in 1956, of the Clyde River Purification Board, which brought the whole river basin under a single independent regulator with new powers to control discharges by means of legally enforceable standards. However, it was not until the enactment of a new Act in 1965 that the Board acquired adequate control over all existing discharges to inland waters and new discharges to tidal waters. A ten year plan was then drawn up establishing a list of priority targets comprising both sewage and industrial effluents. A third piece of related legislation was passed in 1972 and provided powers for the control of pollution discharges to underground strata and of sand and gravel extraction (CRPB, 1983). The Clyde River Purification Board was restructured in 1975 due to the Local Government (Scotland) Act 1973, replacing the previous Clyde and Ayrshire Boards (CRPB, 1975). Eventually, the Clyde Board was incorporated into the aforementioned SEPA in 1996. 5.3.2 The Dee catchment The River Dee exhibits a range of channel patterns reflecting fluvial processes operating in a variety of bed and bank materials. In many places, it has floodplains that permit meandering and also moderate downstream flooding (Maizels, 1985). The Dee is one of the few large rivers in the UK that rise above 1,000 m of altitude: a fact of considerable ecological importance. The headwaters of the Dee are situated in the Braeriach Plateau at about 1,200 metres, a point that is included in the recently established Cairngorms National Park (SNH, 2000), 127
which can be seen in Figure 5.3. A study of the conservation of the Cairngorms area has been carried out. With the provocative title, ‘Common sense and sustainability: a partnership for the Cairngorms’, the study expresses concerns about the future needs for water abstraction in the River Dee, due to expanding population, increasing personal water consumption and industrial requirements (Scottish Office, 1992). This report does not mention Thomas Reid, the famous philosopher of Aberdeen University, who advocated the fundamental importance of common sense for human agency. Despite its controversy and complexity, the construction of water sustainability seems to require a good deal of common sense. The area of the Dee Catchment can be clearly differentiated between western upper lands (>300 m of altitude) and eastern lowlands (