4 Calculate the one-independent sample z test and interpret the results. ... This
type of experimental situation, using the example of standardized exam scores, is
...
CHAPTER
8
Introduction to Hypothesis Testing 8.1
Inferential Statistics and Hypothesis Testing
LEARNING OBJECTIVES
8.2 Four Steps to Hypothesis Testing
After reading this chapter, you should be able to:
8.3
Hypothesis Testing and Sampling Distributions
8.4
Making a Decision: Types of Error
8.5
Testing a Research Hypothesis: Examples Using the z Test
8.6
Research in Focus: Directional Versus Nondirectional Tests
8.7
Measuring the Size of an Effect: Cohen’s d
8.8
Effect Size, Power, and Sample Size
8.9
Additional Factors That Increase Power
1 Identify the four steps of hypothesis testing. 2 Define null hypothesis, alternative hypothesis,
level of significance, test statistic, p value, and statistical significance.
3 Define Type I error and Type II error, and identify the type of error that researchers control.
4 Calculate the one-independent sample z test and interpret the results.
5 Distinguish between a one-tailed and two-tailed test, and explain why a Type III error is possible only with one-tailed tests.
6 Explain what effect size measures and compute a Cohen’s d for the one-independent sample z test.
7 Define power and identify six factors that influence power. 8 Summarize the results of a one-independent sample z test in American Psychological Association (APA) format.
8.10 SPSS in Focus: A Preview for Chapters 9 to 18 8.11 APA in Focus: Reporting the Test Statistic and Effect Size
2
PART III: PROBABILITY AND THE FOUNDATIONS OF INFERENTIAL STATISTICS
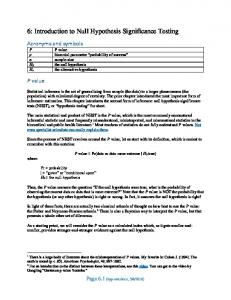
8.1 INFERENTIAL STATISTICS AND HYPOTHESIS TESTING We use inferential statistics because it allows us to measure behavior in samples to learn more about the behavior in populations that are often too large or inaccessi ble. We use samples because we know how they are related to populations. For example, suppose the average score on a standardized exam in a given population is 1,000. In Chapter 7, we showed that the sample mean as an unbiased estimator of the population mean—if we selected a random sample from a population, then on average the value of the sample mean will equal the population mean. In our exam ple, if we select a random sample from this population with a mean of 1,000, then on average, the value of a sample mean will equal 1,000. On the basis of the central limit theorem, we know that the probability of selecting any other sample mean value from this population is normally distributed. In behavioral research, we select samples to learn more about populations of interest to us. In terms of the mean, we measure a sample mean to learn more about the mean in a population. Therefore, we will use the sample mean to describe the population mean. We begin by stating the value of a population mean, and then we select a sample and measure the mean in that sample. On average, the value of the sample mean will equal the population mean. The larger the difference or discrep ancy between the sample mean and population mean, the less likely it is that we could have selected that sample mean, if the value of the population mean is cor rect. This type of experimental situation, using the example of standardized exam scores, is illustrated in Figure 8.1.
FIGURE 8.1 The sampling distribution for a population mean is equal to 1,000. If 1,000 is the correct population mean, then we know that, on average, the sample mean will equal 1,000 (the population mean). Using the empirical rule, we know that about 95% of all samples selected from this population will have a sample mean that falls within two standard deviations (SD) of the mean. It is therefore unlikely (less than a 5% probability) that we will measure a sample mean beyond 2 SD from the population mean, if the population mean is indeed correct.
We expect the sample mean to be equal to the population mean.
µ = 1000
The method in which we select samples to learn more about characteristics in a given population is called hypothesis testing. Hypothesis testing is really a systematic way to test claims or ideas about a group or population. To illustrate,
C H APT ER 8 : I N T RO D U C T I O N T O H YPO T H ES I S T ES T I NG
3
suppose we read an article stating that children in the United States watch an aver age of 3 hours of TV per week. To test whether this claim is true, we record the time (in hours) that a group of 20 American children (the sample), among all children in the United States (the population), watch TV. The mean we measure for these 20 children is a sample mean. We can then compare the sample mean we select to the population mean stated in the article. Hypothesis testing or significance testing is a method for testing a claim or hypothesis about a parameter in a population, using data measured in a sample. In this method, we test some hypothesis by determining the likelihood that a sample statistic could have been selected, if the hypothesis regarding the population parameter were true.
DEFINITION
The method of hypothesis testing can be summarized in four steps. We will describe each of these four steps in greater detail in Section 8.2. 1. To begin, we identify a hypothesis or claim that we feel should be tested. For example, we might want to test the claim that the mean number of hours that children in the United States watch TV is 3 hours. 2. We select a criterion upon which we decide that the claim being tested is true or not. For example, the claim is that children watch 3 hours of TV per week. Most samples we select should have a mean close to or equal to 3 hours if the claim we are testing is true. So at what point do we decide that the discrepancy between the sample mean and 3 is so big that the claim we are testing is likely not true? We answer this question in this step of hypothesis testing. 3. Select a random sample from the population and measure the sample mean. For example, we could select 20 children and measure the mean time (in hours) that they watch TV per week. 4. Compare what we observe in the sample to what we expect to observe if the claim we are testing is true. We expect the sample mean to be around 3 hours. If the discrepancy between the sample mean and population mean is small, then we will likely decide that the claim we are testing is indeed true. If the discrepancy is too large, then we will likely decide to reject the claim as being not true.
1. On average, what do we expect the sample mean to be equal to? 2. True or false: Researchers select a sample from a population to learn more about characteristics in that sample.
NOTE: Hypothesis testing is the method of testing whether claims or hypotheses regarding a population are likely to be true.
LE A R N I N G C H EC K 1
characteristics in the population that the sample was selected from. Answers: 1. The population mean; 2. False. Researchers select a sample from a population to learn more about
4
PART III: PROBABILITY AND THE FOUNDATIONS OF INFERENTIAL STATISTICS
8.2 FOUR STEPS TO HYPOTHESIS TESTING The goal of hypothesis testing is to determine the likelihood that a population parameter, such as the mean, is likely to be true. In this section, we describe the four steps of hypothesis testing that were briefly introduced in Section 8.1:
Step 1: State the hypotheses.
Step 2: Set the criteria for a decision.
Step 3: Compute the test statistic.
Step 4: Make a decision.
Step 1: State the hypotheses. We begin by stating the value of a population mean in a null hypothesis, which we presume is true. For the children watching TV example, we state the null hypothesis that children in the United States watch an average of 3 hours of TV per week. This is a starting point so that we can decide whether this is likely to be true, similar to the presumption of innocence in a courtroom. When a defendant is on trial, the jury starts by assuming that the defendant is innocent. The basis of the decision is to determine whether this assumption is true. Likewise, in hypothesis testing, we start by assuming that the hypothesis or claim we are testing is true. This is stated in the null hypothesis. The basis of the decision is to determine whether this assumption is likely to be true.
DEFINITION
NOTE: In hypothesis testing, we conduct a study to test whether the null hypothesis is likely to be true.
DEFINITION
The null hypothesis (H0), stated as the null, is a statement about a population parameter, such as the population mean, that is assumed to be true. The null hypothesis is a starting point. We will test whether the value stated in the null hypothesis is likely to be true. Keep in mind that the only reason we are testing the null hypothesis is because we think it is wrong. We state what we think is wrong about the null hypothesis in an alternative hypothesis. For the children watching TV example, we may have reason to believe that children watch more than (>) or less than ( .05), we retain the null hypothesis. The decision to reject or retain the null hypothesis is called significance. When the p value is less than .05, we reach significance; the decision is to reject the null hypothesis. When the p value is greater than .05, we fail to reach significance; the decision is to retain the null hypothesis. Figure 8.3 shows the four steps of hypothesis testing.
NOTE: Researchers make decisions regarding the null hypothesis. The decision can be to retain the null (p > .05) or reject the null (p < .05).
LE A R N I N G C H EC K 2
1. State the four steps of hypothesis testing. 2. The decision in hypothesis testing is to retain or reject which hypothesis: the null or alternative hypothesis? 3. The criterion or level of significance in behavioral research is typically set at what probability value? 4. A test statistic is associated with a p value less than .05 or 5%. What is the deci sion for this hypothesis test? 5. If the null hypothesis is rejected, then did we reach significance?
7
outcome; 4. Reject the null; 5. Yes. Step 3: Compute the test statistic. Step 4: Make a decision; 2. Null; 3. A .05 or 5% likelihood for obtaining a sample Answers: 1. Step 1: State the null and alternative hypothesis. Step 2: Determine the level of significance.
8
PART III: PROBABILITY AND THE FOUNDATIONS OF INFERENTIAL STATISTICS
STEP 1: State the hypotheses. A researcher states a null hypothesis about a value in the population (H0) and an alternative hypothesis that contradicts the null hypothesis. STEP 2: Set the criteria for a decision. A criterion is set upon which a researcher will decide whether to retain or reject the value stated in the null hypothesis.
POPULATION
-------------------------------------------------Level of Significance (Criterion) --------------------------------------------------
A sample is selected from the population, and a sample mean is measured.
Conduct a study with a sample selected from a population.
STEP 3: Compute the test statistic. This will produce a value that can be compared to the criterion that was set before the sample was selected.
Measure data and compute a test statistic.
STEP 4: Make a decision. If the probability of obtaining a sample mean is less than 5% when the null is true, then reject the null hypothesis. If the probability of obtaining a sample mean is greater than 5% when the null is true, then retain the null hypothesis.
FIGURE 8.3 A summary of hypothesis testing.
8.3 �HYPOTHESIS TESTING AND SAMPLING DISTRIBUTIONS The logic of hypothesis testing is rooted in an understanding of the sampling distribution of the mean. In Chapter 7, we showed three characteristics of the mean, two of which are particularly relevant in this section: 1. The sample mean is an unbiased estimator of the population mean. On average, a randomly selected sample will have a mean equal to that in the population. In hypothesis testing, we begin by stating the null hypothesis. We expect that, if the null hypothesis is true, then a random sample selected from a given population will have a sample mean equal to the value stated in the null hypothesis. 2. Regardless of the distribution in the population, the sampling distribution of the sample mean is normally distributed. Hence, the probabilities of all other possible sample means we could select are normally distributed. Using this distribution, we can therefore state an alternative hypothesis to locate the probability of obtaining sample means with less than a 5% chance of being selected if the value stated in the null hypothesis is true. Figure 8.2 shows that we can identify sample mean outcomes in one or both tails.
C H APT ER 8 : I N T RO D U C T I O N T O H YPO T H ES I S T ES T I NG
To locate the probability of obtaining a sample mean in a sampling distribution, we must know (1) the population mean and (2) the standard error of the mean (SEM; introduced in Chapter 7). Each value is entered in the test statistic formula computed in Step 3, thereby allowing us to make a decision in Step 4. To review, Table 8.1 displays the notations used to describe populations, samples, and sampling distributions. Table 8.2 summarizes the characteristics of each type of distribution. TABLE 8.1 A review of the notation used for the mean, variance, and standard deviation in population, sample, and sampling distributions.
Characteristic
Population
Mean
m
Sample – M or X
Variance
s2
s2 or SD 2
Standard deviation
s
s or SD
Sampling Distribution mM = m 2 σM =
σM =
σ2 n σ n
TABLE 8.2 A review of the key differences between population, sample, and sampling distributions.
Population Distribution
Sample Distribution
Distribution of Sample Means
What is it?
Scores of all persons in a population
Scores of a select portion of persons from the population
All possible sample means that can be drawn, given a certain sample size
Is it accessible?
Typically, no
Yes
Yes
What is the shape?
Could be any shape
Could be any shape
Normally distributed
1. For the following statement, write increases or decreases as an answer. The like lihood that we reject the null hypothesis (increases or decreases): a. The closer the value of a sample mean is to the value stated by the null hypothesis? b. The further the value of a sample mean is from the value stated in the null hypothesis? 2. A researcher selects a sample of 49 students to test the null hypothesis that the average student exercises 90 minutes per week. What is the mean for the sam pling distribution for this population of interest if the null hypothesis is true?
LE A R N I N G C H EC K 3
9
Answers: 1. (a) Decreases, (b) Increases; 2. 90 minutes.
10
PART III: PROBABILITY AND THE FOUNDATIONS OF INFERENTIAL STATISTICS
8.4 MAKING A DECISION: TYPES OF ERROR In Step 4, we decide whether to retain or reject the null hypothesis. Because we are observing a sample and not an entire population, it is possible that a conclusion may be wrong. Table 8.3 shows that there are four decision alternatives regarding the truth and falsity of the decision we make about a null hypothesis: 1. The decision to retain the null hypothesis could be correct. 2. The decision to retain the null hypothesis could be incorrect. 3. The decision to reject the null hypothesis could be correct. 4. The decision to reject the null hypothesis could be incorrect. TABLE 8.3 Four outcomes for making a decision. The decision can be either correct (correctly reject or retain null) or wrong (incorrectly reject or retain null).
Decision
True Truth in the population�
False
Retain the null
Reject the null
CORRECT 1–a
TYPE I ERROR a
TYPE II ERROR b
CORRECT 1–b POWER
We investigate each decision alternative in this section. Since we will observe a sample, and not a population, it is impossible to know for sure the truth in the population. So for the sake of illustration, we will assume we know this. This assumption is labeled as truth in the population in Table 8.3. In this section, we will introduce each decision alternative.
DECISION: RETAIN THE NULL HYPOTHESIS When we decide to retain the null hypothesis, we can be correct or incorrect. The correct decision is to retain a true null hypothesis. This decision is called a null result or null finding. This is usually an uninteresting decision because the deci sion is to retain what we already assumed: that the value stated in the null hypoth esis is correct. For this reason, null results alone are rarely published in behavioral research. The incorrect decision is to retain a false null hypothesis. This decision is an example of a Type II error, or b error. With each test we make, there is always some probability that the decision could be a Type II error. In this decision, we decide to retain previous notions of truth that are in fact false. While it’s an error, we still did nothing; we retained the null hypothesis. We can always go back and conduct more studies.
C H APT ER 8 : I N T RO D U C T I O N T O H YPO T H ES I S T ES T I NG
Type II error, or beta (b) error, is the probability of retaining a null hypothesis that is actually false.
DECISION: REJECT THE NULL HYPOTHESIS When we decide to reject the null hypothesis, we can be correct or incorrect. The incorrect decision is to reject a true null hypothesis. This decision is an example of a Type I error. With each test we make, there is always some probability that our decision is a Type I error. A researcher who makes this error decides to reject previ ous notions of truth that are in fact true. Making this type of error is analogous to finding an innocent person guilty. To minimize this error, we assume a defendant is innocent when beginning a trial. Similarly, to minimize making a Type I error, we assume the null hypothesis is true when beginning a hypothesis test. Type I error is the probability of rejecting a null hypothesis that is actually true. Researchers directly control for the probability of committing this type of error.
11
DEFINITION
NOTE: A Type II error, or beta (b) error, is the probability of incorrectly retaining the null hypothesis.
DEFINITION
An alpha (a) level is the level of significance or criterion for a hypothesis test. It is the largest probability of committing a Type I error that we will allow and still decide to reject the null hypothesis. Since we assume the null hypothesis is true, we control for Type I error by stating a level of significance. The level we set, called the alpha level (symbolized as a), is the larg est probability of committing a Type I error that we will allow and still decide to reject the null hypothesis. This criterion is usually set at .05 (a = .05), and we compare the alpha level to the p value. When the probability of a Type I error is less than 5% (p < .05), we decide to reject the null hypothesis; otherwise, we retain the null hypothesis. The correct decision is to reject a false null hypothesis. There is always some probability that we decide that the null hypothesis is false when it is indeed false. This decision is called the power of the decision-making process. It is called power because it is the decision we aim for. Remember that we are only testing the null hypothesis because we think it is wrong. Deciding to reject a false null hypothesis, then, is the power, inasmuch as we learn the most about populations when we accurately reject false notions of truth. This decision is the most published result in behavioral research. The power in hypothesis testing is the probability of rejecting a false null hypothesis. Specifically, it is the probability that a randomly selected sample will show that the null hypothesis is false when the null hypothesis is indeed false.
NOTE: Researchers directly control for the probability of a Type I error by stating an alpha (a) level.
NOTE: The power in hypothesis testing is the probability of correctly rejecting the value stated in the null hypothesis.
DEFINITION
LE A R N I N G C H EC K 4
1. What type of error do we directly control? 2. What type of error is associated with decisions to retain the null? 3. What type of error is associated with decisions to reject the null? 4. State the two correct decisions that a researcher can make. hypothesis. Answers: 1. Type I error; 2. Type II error; 3. Type I error; 4. Retain a true null hypothesis and reject a false null
12
PART III: PROBABILITY AND THE FOUNDATIONS OF INFERENTIAL STATISTICS
8.5 �TESTING A RESEARCH HYPOTHESIS: EXAMPLES USING THE Z TEST The test statistic in Step 3 converts the sampling distribution we observe into a standard normal distribution, thereby allowing us to make a decision in Step 4. The test statistic we use depends largely on what we know about the population. When we know the mean and standard deviation in a single population, we can use the one–independent sample z test, which we will use in this section to illustrate the four steps of hypothesis testing.
DEFINITION
NOTE: The z test is used to test hypotheses about a population mean when the population variance is known.
The one–independent sample z test is a statistical procedure used to test hypotheses concerning the mean in a single population with a known variance. Recall that we can state one of three alternative hypotheses: A population mean is greater than (>), less than () NOTE: An upper-tail critical test is conducted when it is not possible or highly unlikely that a sample mean will fall below the population mean stated in the null hypothesis.
DEFINITION
E X A M PL E 8 . 2
In Example 8.2, we will use the z test for a directional, or one-tailed test, where the alternative hypothesis is stated as greater than (>) the null hypothesis. A direc tional test can also be stated as less than () or less than () this value: H0: m = 558 �Mean test scores are equal to 558 in the population of students at the elite school. H1: m > 558 �Mean test scores are greater than 558 in the population of students at the elite school. Step 2: Set the criteria for a decision. The level of significance is .05, which makes the alpha level a = .05. To determine the critical value for an upper-tail critical test, we locate the probability .0500 toward the tail in column C in the unit normal table. The z-score associated with this probability is between z = 1.64 and z = 1.65. The average of these z-scores is z = 1.645. This is the critical value or cutoff for the rejection region. Figure 8.6 shows that for this test, we place all the value of alpha in the upper tail of the standard normal distribution.
NOTE: For one-tailed tests, the alpha level is placed in a single tail of a distribution. For upper-tail critical tests, the alpha level is placed above the mean in the upper tail.
Step 3: Compute the test statistic. Step 2 sets the stage for making a decision because the criterion is set. The probability is less than 5% that we will obtain a sample mean that is at least 1.645 standard deviations above the value of the population mean stated in the null hypothesis. In this step, we will compute a test statistic to determine whether or not the sample mean we selected is beyond the critical value we stated in Step 2.
C H APT ER 8 : I N T RO D U C T I O N T O H YPO T H ES I S T ES T I NG
17
Critical value for an uppertail critical test with α = .05
Rejection region α = .05
−3
−2
−1
0
Null
1
2
3
z = 1.645
FIGURE 8.6 The critical value (1.645) for a directional (upper-tail critical) hypothesis test at a .05 level of significance. When the test statistic exceeds 1.645, we reject the null hypothesis; otherwise, we retain the null hypothesis.
The test statistic does not change from that in Example 8.1. We are testing the same population, and we measured the same value of the sample mean. We changed only the location of the rejection region in Step 2. The z statistic is the same computation as that shown in Example 8.1: zobt =
M − µ 585 − 558 = = 1.94 . σM 13.9
Step 4: Make a decision. To make a decision, we compare the obtained value to the critical value. We reject the null hypothesis if the obtained value exceeds the critical value. Figure 8.7 shows that the obtained value (Zobt = 1.94) is greater than the critical value; it falls in the rejection region. The decision is to reject the null hypothesis. The p value for this test is .0262 (p = .0262). We do not double the p value for one-tailed tests. We found in Example 8.2 that if the null hypothesis were true, then p = .0262 that we could have selected this sample mean from this population. The criteria we set in Step 2 was that the probability must be less than 5% that we obtain a sample mean, if the null hypothesis were true. Since p is less than 5%, we decide to reject the null hypothesis. We decide that the mean score on the GRE General Test in this
The test statistic reaches the rejection region; reject the null hypothesis. Rejection region α = .05
Retain the null hypothesis
−3
−2
−1
FIGURE 8.7 0
Null
1
2
1.94
3
Since the obtained value reaches the rejection region, we decide to reject the null hypothesis.
18
PART III: PROBABILITY AND THE FOUNDATIONS OF INFERENTIAL STATISTICS
population is not 558, which was the value stated in the null hypothesis. Also, notice that we made two different decisions using the same data in Examples 8.1 and 8.2. This outcome is explained further in Section 8.6.
DIRECTIONAL, LOWER-TAIL CRITICAL HYPOTHESIS TESTS (H1: 0
m1 – m2 ≠ 0
a. Which did he identify as nondirectional? b. Which did he identify as directional? 30. The one-tailed tests. In their book, Common Errors in Statistics (and How to Avoid Them), Good and Hardin (2003) wrote, “No one will know whether your [one-tailed] hypothesis was con ceived before you started or only after you’d examined the data” (p. 347). Why do the authors state this as a concern for one-tailed tests? 31. The hopes of a researcher. Hayne Reese (1999) wrote, “The standard method of statistical inference involves testing a null hypothesis that the researcher usually hopes to reject” (p. 39). Why does the researcher usually hope to reject the null hypothesis? 32. Describing the z test. In an article describing hypothesis testing with small sample sizes, Collins and Morris (2008) provided the following description for a z test: “Z is considered signifi cant if the difference is more than roughly two standard deviations above or below zero (or more
36
PART III: PROBABILITY AND THE FOUNDATIONS OF INFERENTIAL STATISTICS
precisely, |Z| > 1.96)” (p. 464). Based on this description: a. Are the authors referring to critical values for a one- or two-tailed z test? b. What alpha level are the authors referring to? 33. Sample size and power. Collins and Morris (2008) simulated selecting thousands of samples and analyzed the results using many different test statistics. With regard to the power for these samples, they reported that “generally speaking,
all tests became more powerful as sample size increased” (p. 468). How did increasing the sam ple size in this study increase power? 34. Describing hypothesis testing. Blouin and Riopelle (2004) made the following statement concerning how scientists select test statistics: “[This] test is the norm for conducting a test of H0, when . . . the population(s) are normal with known variance(s)” (p. 78). Based on this descrip tion, what test statistic are they describing as the norm? How do you know this?
APPENDIX C Chapter Solutions for Even-Numbered End-of-Chapter Problems C H A P T E R 8� 2. Reject the null hypothesis and retain the null hypothesis. 4. A Type II error is the probability of retaining a null hypothesis that is actually false. 6. Critical values = ±1.96.
18. a. a = .05. b. a = .01. c. a = .001. 20. 1a. Reject the null hypothesis. 1b. Reject the null hypothesis. 1c. Reject the null hypothesis. 1d. Retain the null hypothesis. 2a. Retain the null hypothesis. 2b. Retain the null hypothesis. 2c. Reject the null hypothesis. 2d. Reject the null hypothesis.
8. All four terms describe the same thing. The level of significance is represented by alpha, which defines the rejection region or the region associated with the probability of committing a Type I error. 10. Alpha level, sample size, and effect size. 12. In hypothesis testing, the significance of an effect determines whether an effect exists in some pop ulation. Effect size is used as a measure for how big the effect is in the population. 14. All decisions are made about the null hypothesis and not the alternative hypothesis. The only appropriate decisions are to retain or reject the null hypothesis. 16. The sample size in the second sample was larger. Therefore, the second sample had more power to detect the effect, which is likely why the deci sions were different.
22. a. σ M =
7 74 − 72 = 1.0; hence, zobt = = 2.00. 1 49
24.
The decision is to reject the null hypothesis. 74 − 72 b. d = = .29. A medium effect size. 7 0.05 = 0.125. A small effect size. 0.4 b. d = 0.1 = 0.25. A medium effect size. 0.4 0.4 c. d = = 1.00. A large effect size. 0.4 a. d =
37
38
26.
PART III: PROBABILITY AND THE FOUNDATIONS OF INFERENTIAL STATISTICS
1 1 1 b. d = 2 1 c. d = 4 1 d. d = 6 a. d =
= 1.00. Large effect size. = 0.50. Medium effect size. = 0.25. Medium effect size. = .17. Small effect size.
28. This will decrease standard error, thereby increas ing power.
30. The point Good and Hardin (2003) are making is that it is possible with the same data to retain the null for a two-tailed test and reject the null for a one-tailed test where the entire rejection region is placed in a single tail. 32. a. Two-tailed z test. b. a = .05. 34. We would use the z test because the population variance is known.