Furthermore the set-up will be connected to Internet of Things (IoT) network by which we will be able ... Fig 1.2: Block Architecture of IOT around a Microcontroller .... Once the sensor had been connected work could start on writing a program to get a ..... The two worlds of Cloud and IoT have seen an independent evolution.
Smart Weather Station 2018
Chapter I INTRODUCTION
AEIE 891 – B.E. – AEIE – UIT, BU
Page 1
Smart Weather Station 2018 INTRODUCTION: An automated digital weather station is a device that is used to measure and record the known parameters of atmosphere without involvement of humans. The weather conditions are required to be monitored to maintain the healthy growth in crops and to ensure the safe working environment in industries, etc. Due to technological growth, the process of reading the environmental parameters became easier compared to the past days. The sensors are the miniaturized electronic devices used to measure the physical and environmental parameters. By using the sensors for monitoring the weather conditions, the results will be accurate and the entire system will be faster and less power consuming. The system here describes the implemented flow of the weather monitoring station. It includes the wireless communication technology IEEE 802.11 b/g (Wi-Fi) for communication. The system monitors the weather situations and updates the information to the web page. The reason behind sending the data to the web page is to maintain the weather conditions of a particular place can be known anywhere in the world. All these sensors measure the corresponding weather parameters. The system is once designed and developed can be used for domestic, outdoor and industrial purposes PROJECT OBJECTIVE: The main focus of this project is to build a low cost digital weather station is capable of measuring, recording and displaying weather Vis – a – Vis climatic parameters viz. air and soil temperature, relative humidity, soil pH/salinity status, wind speed, rain fall, atmospheric pressure and light intensity. Furthermore the set-up will be connected to Internet of Things (IoT) network by which we will be able to upload and download data for saving it and further referencing. The data will be acquired via an array of sensors specific for each of the above mentioned parameters which will then be fed to Raspberry Pi for further transmission and control, if any. The justification of using Raspberry Pi 3 Model B instead of Arduino Uno or Arduino Mega 2560 are listed in comparison table.
AEIE 891 – B.E. – AEIE – UIT, BU
Page 2
Smart Weather Station 2018 OVERVIEW: Internet of Things (IoT) Internet of Things (IoT) is a network of physical devices and appliances enabling these devices to connect and exchange data. The basic rule behind IoT is “Anything that can be connected, will be connected.” Here the devices are provided with unique identifiers enabling them to transfer data over network without human interaction. The thing is the IoT can be anything that can be assigned an IP address. IoT is an evolution from the convergence of wireless technologies, microelectromechanical systems (MEMS), micro services and internet. The convergence has brought together Operational Technology (OT) and Information Technology (IT) allowing the unstructured machine – generated data to be analyzed for insights that will drive automation and improvements.
Fig 1.1: Schematic of IoT Structure P.C: DOI10.1109/CAMAD.2013.6708104
AEIE 891 – B.E. – AEIE – UIT, BU
Page 3
Smart Weather Station 2018
Fig 1.2: Block Architecture of IOT around a Microcontroller
INTER INTEGRATED CIRCUIT FOR RASPBERRY PI AND ARDUINO I2C: Inter Integrated Circuit I2C is a multi-master bus, which means that multiple chips can be connected to the same bus and each one can act as a master by initiating a data transfer. It is a simple procedure of transferring data between different ICs, boards and sensors. The two connections that are required with the Arduino controller or Raspberry Pi computer are SDA (Serial Data Line - Data) and SCl (Serial Clock Line - Clock). The highest speed that is achievable via I2C bus 3.2 MBPS. Along with Serial Peripheral Interface (SPI), it is also intended for short distance communications within a single device.
AEIE 891 – B.E. – AEIE – UIT, BU
Page 4
Smart Weather Station 2018
Fig 1.3: I2C Channel Diagram P.C: superhouse.tv/i2c-for-arduino
Fig 1.4: I2C Illustration with Arduino & Raspberry Pi P.C: radiostud.io AEIE 891 – B.E. – AEIE – UIT, BU
Page 5
Smart Weather Station 2018 PRINCIPAL CONTROLLER DEVICES: The principal components that will act as the heart and soul of this project are Raspberry Pi Model B which can act as a stand-alone computer and Arduino Mega2560 which will provide the necessary support to the Raspberry Pi. Arduino components are microcontroller based devices that will be made compatible and available for the Raspberry Pi as and when needed. 1. Raspberry Pi 3 Model B 2. Arduino Mega2560 3. Arduino UNO 4. Arduino Nano
PARAMETERS TO BE MEASURED FOR WEATHER STATION: 1. Wind Speed 2. Air and Soil Temperature 3. Relative Humidity 4. Atmospheric Pressure 5. Rain Fall 6. Soil pH/Salinity 7. Air Quality Importance of Digital Weather Station 1. Data Collection 2. Data Display 3. Data Interpretation
AEIE 891 – B.E. – AEIE – UIT, BU
Page 6
Smart Weather Station 2018
Fig 1.5: Schematic Block of Smart Weather Station
CODE SECTION: The software code to connect and control the device with one another is done in Python and this section comprises the code for the same as provided beneath. JUSTIFICATION OF THE PROJECT: As the room of improvement is never saturated, we can take forward our work from just recording and displaying data and sharing over network to processing the data for evaluation of different parameters associated with climate and proceed to building automatic controllers for determining water budget schemes, irrigation scheduling, forecasting alerts and irrigation and farm controllers. The scopes of improvement are therefore limitless. The principal aim of this project is to design and develop a prototype model of a digital weather station that will be capable of measuring, recording and displaying weather parameters viz. temperature, wind speed, humidity, atmospheric pressure, air quality, and day light intensity. We have been successful in achieving our goal with good levels of accuracy (above 98 %) and also the data sensed from the sensors are sent out to the IoT based server created for uploading, archiving and processing by other researchers across the globe. As mentioned in the previous section, the scope of improvement and advancements are many and we look forward to achieving those advancements in the very near future. AEIE 891 – B.E. – AEIE – UIT, BU
Page 7
Smart Weather Station 2018 DEVICES &SENSORS REQUIRED FOR DIFFERENT PARAMETERS TO BE MEASURED FOR WEATHER STATION Sl. No. 1. 2. 3. 4. 5.
6. 7. 8. 9.
10. 11. 12. 13. 14. 15. 16. 17. 18.
Parameter Controlling Device
Device Raspberry Pi 3 Model B; Arduino UNO, Mega & Nano Power Supply for Pi Raspberry Pi Universal Power Supply GPIO, I2C & SIP Pi T – Cobbler pin connectors Solar Power 2 Nos. 20 W 12 V Solar Panels Generator Humidity DHT 11 & DHT 22 HTU21D – F SEN51035P Air Temperature DHT 11 & DHT 22& AM2315& LM 35, LM 336 Atmospheric BMP 085/180/280 (controlled via I2C) Pressure Analog Sensor – MPX4115a (high accuracy) Soil Temperature LM 35 Light Intensity Light Sensor (LDR Small/Big) TLS2561 MAX44009 Rain Fall Raindrop Sensor via MCP 3008 Soil Moisture Analog Moisture Sensor via MCP 3008 Content Grove Soil Moisture Sensor via MCP 3008 Solar Radiation Using Solar Panel Wind Speed Anemometer via Hall Effect Sensor Air Quality MQ 135 Real Time Clock DS1307 RTC& DS3231 RTC ADC ADS1115& MCP 3008 Wireless Transceiver NRF24l01 (for Arduino) Module Wi Fi ESP8266 (for Arduino) Communication Module
AEIE 891 – B.E. – AEIE – UIT, BU
Page 8
Smart Weather Station 2018 WORK PLAN: Features of the Project – Digital Weather Station
The proposed project will serve the following unique features. 1. Simplicity 2. Usability 3. Low cost 4. Maintainability. The desirable aspects of this weather station are that it should be capable of recording and processing data outdoor tolerating the wear and tear of outside nature and should have a considerable long life with good accuracy (± 0.5). EXPERIMENTAL SET – UP: As we are on the way of implementation of this prototype, the following steps will be traversed in the venture towards completion of the model. 1. Flow Chart 2. Algorithm 3. Block Diagram 4. Physical Diagram 5. Arrangement of Sensors/Components 6. Assemble 7. Record & Display 8. Validate 9. Upload in the web server and/or cloud server.
AEIE 891 – B.E. – AEIE – UIT, BU
Page 9
Smart Weather Station 2018
CHAPTER II WEATHER PARAMETERS
AEIE 891 – B.E. – AEIE – UIT, BU
Page 10
Smart Weather Station 2018 INTRODUCTION: In this section, we will learn about the parameters that are to be considered for the modeling of the prototype smart weather station. The sensors that will be responsible for the measurements of these parameters will also be dealt with before one can integrate the sensors into one unit. The parameters that will be discussed in this chapter are i) ii) iii) iv) v) vi) vii) viii)
Relative Humidity Temperature Air Pressure Soil Moisture Rain fall measurement Light Meter or Lux meter Gas or Air Quality Carbon Oxide (CO)
TEMPERATURE AND HUMIDITY SENSOR (DHT-22): This module deals with wiring up and receiving an output from the DHT22 temperature and humidity sensor. The sensor is manufactured by a Chinese company, Aosong Electronics, and is very low cost. As such it doesn’t use a standard for communication between it and the microcontroller, but instead uses its own communication protocol. Connecting the sensor the Arduino was straightforward; all that was required was the sensor, some jumper wires and a 10k Ohm resistor. The pins on the sensor are long enough to allow it to plug directly into the breadboard. The sensor has four pins: VCC (3 to 5V power), Data out, Null and GND. Once the sensor had been connected work could start on writing a program to get a reading from it. Due to the delicate timings required for communication with the sensor the C programming language is used, instead of Python. This is the only part of the project for which this change had to be made. When the start signal is sent to the sensor, it changes from low-power mode to running mode, and after the start signal has finished the sensor sends a response signal of 40-bit data that contains the relative humidity and temperature readings. Data from the sensor is comprised of integral and decimal parts. AEIE 891 – B.E. – AEIE – UIT, BU
Page 11
Smart Weather Station 2018
Fig 2.1: Pin Diagram of Temp & Humidity Sensor DHT22
HIGH ALTITUDE AIR PRESSURE SENSOR (BMP-180): This pressure sensor is a BMP-180 based digital barometric pressure sensor module and is functional compatible with older BMP-085 digital pressure sensor with less power consumption smaller in size and more accurate. BMP180 combines barometric pressure, temperature and altitude. The IC allows easy interface with any microcontroller. On board 3.3V LDO regulator makes this board fully 5V supply compatible. BMP-180 can measure pressure range from 300 to 1100hPa (+9000m to 500m relating to sea level) with an accuracy down to 0.02hPa (0.17m) in advance resolution mode. BMP-180 is an improved replacement for BMP-085 sensor. BMP180 uses piezo-resistive technology for high accuracy, linearity, EMC robustness and stability for a longer period of time. Specifications
Supply Voltage:1.8V to 3.6V Low power consumption:0.5uA at 1Hz I2C interface Max I2C Speed: 3.5Mhz Very low noise up to 0.02hPa (17cm) Pressure Range: 300hPa to 1100hPa (+9000m to -500m)
AEIE 891 – B.E. – AEIE – UIT, BU
Page 12
Smart Weather Station 2018 Working of BMP180 The BMP180 consists of a piezo-resistive sensor, an analog to digital converter and a control unit with E2PROM and a serial I2C interface. The BMP180 delivers the uncompensated value of pressure and temperature. The microcontroller sends a start sequence to start a pressure or temperature measurement. After converting time, the result value (pressure or temperature respectively) can be read via the I2C interface. For calculating temperature in °C and pressure in hPa, the calibration data has to be used. These constants can be read out from the BMP180 E2PROM via the I2C interface at software initialization. The sampling rate can be increased up to 128 samples per second (standard mode) for dynamic measurement. In this case, it is sufficient to measure the temperature only once per second and to use this value for all pressure measurements during the same period.
Fig 2.2: Actual Diagram & Pin Out of BMP 180
SOIL MOISTURE SENSOR: The Moisture sensor is used to measure the water content (moisture) of soil when the soil is having water shortage, the module output is at high level, else the output is at low level. This sensor reminds the user to water their plants and also monitors the moisture content of soil. It has been widely used in agriculture, land irrigation and botanical gardening. Specification
Working Voltage: 5V Working Current: Board menu (according to the microcontroller on your board). For details, see the reference and tutorials. The ATmega328 on the Arduino Uno comes preprogrammed with a bootloader that allows you to upload new code to it without the use of an external hardware programmer. It communicates using the original STK500 protocol (reference, C header files). You can also bypass the bootloader and program the microcontroller through the ICSP (In-Circuit Serial Programming) header using Arduino ISP or similar; see these instructions for details. The ATmega16U2 (or 8U2 in the rev1 and rev2 boards) firmware source code is available in the Arduino repository. The ATmega16U2/8U2 is loaded with a DFU bootloader, which can be activated by: On Rev1 boards: connecting the solder jumper on the back of the board (near the map of Italy) and then rese ing the 8U2. On Rev2 or later boards: there is a resistor that pulling the 8U2/16U2 HWB line to ground, making it easier to put into DFU mode. Memory of Uno: The ATmega328 has 32 KB (with 0.5 KB occupied by the bootloader). It also has 2 KB of SRAM and 1 KB of EEPROM (which can be read and written with the EEPROM library). Input and Output in Uno: See the mapping between Arduino pins and ATmega328P ports. The mapping for the Atmega8, 168, and 328 is identical.
AEIE 891 – B.E. – AEIE – UIT, BU
Page 49
Smart Weather Station 2018
Fig 4.5: Pin Diagram of Arduino UNO
Each of the 14 digital pins on the Uno can be used as an input or output, using pinMode(),digitalWrite(), and digitalRead() functions. They operate at 5 volts. Each pin can provide or receive 20 mA as recommended operating condition and has an internal pull-up resistor (disconnected by default) of 20-50k ohm. A maximum of 40mA is the value that must not be exceeded on any I/O pin to avoid permanent damage to the microcontroller. The Uno has 6 analog inputs, labeled A0 through A5, each of which provide 10 bits of resolution (i.e. 1024 different values). By default they measure from ground to 5 volts, though is it possible to change the upper end of their range using the AREF pin and the analogReference() function.
AEIE 891 – B.E. – AEIE – UIT, BU
Page 50
Smart Weather Station 2018 RASPBERRY PI 3 MODEL 3: The Raspberry Pi is a series of small single-board computers developed in the United Kingdom by the Raspberry Pi Foundation to promote the teaching of basic computer science in schools and in developing countries. The original model became far more popular than anticipated, selling outside its target market for uses such as robotics. It does not include peripherals (such as keyboards, mice and cases). However, some accessories have been included in several official and unofficial bundles. Raspberry Pi 3 Model B was released in February 2016 with a 64 bit quad core processor, and has on-board WiFi, Bluetooth and USB boot capabilities. On Pi Day 2018 model 3B+ appeared with a faster 1.4 GHz processor and a 3 times faster network based on gigabit ethernet (300 Mbit / s) or 2.4 / 5 GHz dual-band Wi-Fi (100 Mbit / s). Other options are: Power over Ethernet (PoE), USB boot and network boot (an SD card is no longer required). This allows the use of the Pi in hard-to-reach places (possibly without electricity). Processor of Raspberry Pi: The Raspberry Pi 3+ uses a Broadcom BCM2837B0 SoC with a 1.4 GHz 64-bit quadcore ARM Cortex-A53 processor, with 512 KB shared L2 cache. Raspberry Pi 3 have 1 GB of RAM. Raspberry Pi 3 Specifications: Chipset: Broadcom BCM2837 CPU: 1.2GHz quad-core 64-bit ARM cortex A53 Ethernet : 10/100 (Max throughput 100Mbps) USB: Four USB 2.0 with 480Mbps data transfer Storage: MicroSD card or via USB-attached storage Wireless: 802.11n Wireless LAN (Peak transmit/receive throughput of 150Mbps), Bluetooth 4.1 Graphics: 400MHz VideoCore IV multimedia Memory: 1GB LPDDR2-900 SDRAM Expandability: 40 general purpose input-output pins Video: Full HDMI port; Camera interface (CSI) & Display interface (DSI) Audio: Combined 3.5mm audio out jack and composite video AEIE 891 – B.E. – AEIE – UIT, BU
Page 51
Smart Weather Station 2018 Input and Output of Raspberry Pi:
Fig 4.6: GPIO & Pin Diagram of Raspberry Pi 3
The Central processing unit is the brain of the raspberry pi board and that is responsible for carrying out the instructions of the computer through logical and mathematical operations. The raspberry pi uses ARM11 series processor, which has joined the ranks of the Samsung galaxy phone The general purpose input & output pins are used in the raspberry pi to associate with the other electronic boards. These pins can accept input & output commands based on programming raspberry pi. The raspberry pi affords digital GPIO pins. These pins are used to connect other electronic components. For example, you can connect it to the temperature sensor to transmit digital data. The XBee socket is used in raspberry pi board for the wireless communication purpose The power source cable is a small switch, which is placed on side of the shield. The main purpose of the power source connector is to enable an external power source.
AEIE 891 – B.E. – AEIE – UIT, BU
Page 52
Smart Weather Station 2018 The Universal Asynchronous Receiver/ Transmitter is a serial input & output port. That can be used to transfer the serial data in the form of text and it is useful for converting the debugging code. Applications of Raspberry Pi: The raspberry pi boards are used in many applications like Media streamer, Arcade machine, Tablet computer, Home automation, Carputer, Internet radio, Controlling robots, Cosmic Computer, Hunting for meteorites, Coffee and also in raspberry pi based projects. COMPARING THE BASIC THREE ARDUINO: Arduino Mega: If your Arduino project has a lot of wires running all around, which requires more than 20 pins, you can opt for an Arduino mega. Say you are working on a 5x5 LED Cube which has a total of 30 inputs. Then you may find the Arduino Uno or the Mini insufficient with 20GPIO pins. In such cases, you may either use a Decoder IC74595 to increase the number of pins on your Arduino Uno or you may buy an Arduino Mega instead, which reduces the fuss of extra wires, PCBs or ICs. To make your project simpler and easier in such scenarios, you may even go for an Arduino Mega 2560. The Arduino mega has 4 pairs of Tx and Rx pins so that you may connect more serial communication devices. Arduino Nano: If you are looking to get a cheaper intro into the field, or if you need your product in a smaller size, then you may go for the Arduino mini. It has all the functionalities of the Arduino Uno in a smaller size and is cheaper than the UNO. The mini has a length of about 3cm and is hence suitable for compact projects like small robots. But in the mini version, you still have the problem of the controller IC being surface mounted on the board. Arduino Uno: If you are a beginner trying to get into the world of Arduino, the best option for you would be the Arduino Uno R3 which costs around Rs.1500. Or you can also buy clone boards like Freeduino which you could get starting from Rs.500. Arduino has 14 Digital pins and 6 Analog pins. So you have a total of 20 GPIO pins (General Purpose Input Output pins), which is good enough for much of the beginner and intermediate level projects. It also has a pair of Rx and Tx pins to connect Serial Communication Devices. Apart from that, a separate pair of Rx and Tx pins can be defined by including the header file SoftwareSerial.
AEIE 891 – B.E. – AEIE – UIT, BU
Page 53
Smart Weather Station 2018 The Arduino Uno R3 comes in two models; the normal version and the SMD version. In the SMD version you have the Atmega328 controller IC as an SMD chip soldered into the board, whereas in the normal version the IC is held on, the Arduino by an IC Holder. The better option for beginners would be the Normal version. Even if you fry your controller IC accidently while working on your project, you may restore normal working by just replacing the IC. If you have an SMD Arduino, then you may end up replacing the Arduino board if you get the IC fried up. ARDUINO VS RASPBERRY PI: Choosing which board you want depends on the type of project you want to make, and your experience in programming. If you have no experience in programming or electronics, you will find the Arduino a steeper learning curve than the Raspberry Pi as you will have to learn them both at the same time. The Arduino is based on hardware, which means you won’t get far without some components: LCDs, LEDs, resistors, motors etc. Depending upon what project you want to do. You need no experience or components to get the Raspberry Pi to do something. Just plug and play. If you want to make a hardware project, then the Arduino is the best choice. If you want to make a software project, then the Raspberry Pi is the way to go. Feature Raspberry Pi Arduino Programming Language No limit Arduini, C/C++ Processor Speed 700 MHz, 16MHz Internet connection very easy Not easy Doable Hardware design Closed source Open source Real time Hardware real time In real time Analog to Digital No Yes Thus, this is all about the differences between Arduino and Raspberry Pi.
AEIE 891 – B.E. – AEIE – UIT, BU
Page 54
Smart Weather Station 2018
Chapter V AGRI WEATHER WEBSITE
AEIE 891 – B.E. – AEIE – UIT, BU
Page 55
Smart Weather Station 2018 INTRODUCTION: Different kinds of websites have different purposes depending on who the intended audience is. Some websites are geared towards selling products and other websites are geared towards providing practical information, while others are merely for entertainment. Let’s take a look at some of the different types of websites that are out there – A. B. C. D. E. F.
Informative/ Practical Information Websites; Entertainment Websites; E-commerce Websites; Service Based Business Websites; Blogs; Social Media Websites et cetera.
Our website “Agri Weather” comes under the ambit of informative/ practical information websites category. Purpose of informative website is to convey specific and helpful information to a specific user/ audience so that reader learns new things or understands a topic better. These websites are geared around more actionable information and may contain guidance, support information, instructions, directions et cetera.
Fig 5.1: Home page of Agri Weather AEIE 891 – B.E. – AEIE – UIT, BU
Page 56
Smart Weather Station 2018 OBJECTIVE: The objective with which this website is created and launched are pointed out below as follows. 1) Providing quality content on website, updating regularly data on website and this helps to become an authoritative resource. It also helps to gain trust. 2) This website helps to create a brand on online market. 3) It helps to save money and time of customers as well as of the organization. 4) This website provides information about and for the organization. 5) It improves interaction with existing and potential knowledge seekers and clients. 6) In many cases its success depends on how we as an organization presents the data and information in online and offline mode. So in the online mode website plays an important role.
Fig 5.2: The ABOUT Section of Agri Weather AEIE 891 – B.E. – AEIE – UIT, BU
Page 57
Smart Weather Station 2018
Fig 5.3: The CONTACT US Section of Agri Weather
FEATURE OF OUR WEBSITE: The name of the website is chosen as Agri Weather and put the ambit of informative/practical information category and this has been done with a certain motive. It has been designed in a manner perceivable by all and therefore easy to collect data and information. This site gives update on various weather parameters few of which are not typical but out of the box viz. Soil temperature, soil ph, solar radiation et cetera, CO level along with standard parameters like air temperature, air pressure, wind speed, relative humidity, air quality and other. And thereafter to create a repository for future referencing and analysis.
Fig 5.4: TEMPERATURE page of Agri Weather AEIE 891 – B.E. – AEIE – UIT, BU
Page 58
Smart Weather Station 2018
Fig 5. 5: LIGHT INTENSITY page of Agri Weather
Fig 5.6: WIND SPEED Page of Agri Weather
Fig 5.7: CARBON MONOOXIDE Page of Agri Weather AEIE 891 – B.E. – AEIE – UIT, BU
Page 59
Smart Weather Station 2018 ALGORITHM OF THE WEBSITE DESIGN: In this section an elaborate stepwise algorithm is provided for the new learners on how to initiate and process the design and implementation and then launching of a website. Step 1: Start Step 2: Analyze the service to be provided and/or product. Step 3: Figure out the minute specifications of the service and/or product. Step 4: Start with the template design of the website and develop it simultaneously. Step 5: Chalk out the Content of the Site and accordingly prepare the buttons of the home page. Step 6: Next step in to code and test the functionality of the website before validation. Step 7: Set up the Search Engine Optimization (SEO) and Online promotion schemes on various platforms. Step 8: Launch the website. Step 9: Post launching of the site, it requires continuous maintenance and upgradations. Step 10: Look for feedback and short falls and rectify them and modify on the positive feedbacks. In the simplest terms, a website should be easy to grasp and comprehend so that the user can in the very first go, knows what to find, where to find and how to find. And for this purpose, the site map should be clearly framed out.
AEIE 891 – B.E. – AEIE – UIT, BU
Page 60
Smart Weather Station 2018
Fig 5.8: Website Development Process; P.C: webconfs.com
Fig 5.9: Web Design Life Cycle; P.C: a1dezine.com
AEIE 891 – B.E. – AEIE – UIT, BU
Page 61
Smart Weather Station 2018
Fig 5.10: Process Flow Representation of Website Design & Development; P.C: webpagefx.com
DEVELOPMENT PLATFORM: Our website is designed with the help of website https://www.wix.com/ Wix.com Ltd. is an Israeli cloud-based web development platform that was first developed and popularized by the Israeli company also called Wix. It allows users to create HTML5 web sites and mobile sites through the use of online drag and drop tools. Users may add functionality such as social plug-ins, e-commerce, online marketing, contact forms, e-mail marketing, and community forums to their web sites using a variety of Wix-developed and third-party applications.
AEIE 891 – B.E. – AEIE – UIT, BU
Page 62
Smart Weather Station 2018 SIMILAR PLATFORM: Similar to wix.com, there are similar platform where we can design website templates and launch it on the internet. All these different platforms come with the own pros and cons. These platforms are however more or less the same. It is therefore on the designer’s discretion on which of these several platforms to use. In the figures below, few of the most popular and commonly used website designing platforms is shown. The only bone of contention is after being launched, to make these websites more reachable to people and the society, an annual charge has to be paid which is pretty nominal based on the features they provide to the designers.
Fig 5.11: Few Platforms for designing web templates and launching of Sites
FUTURE PLAN: 1. If we manage to get other weather parameters then it will be included in our website. 2. Basically our website shows data of Burdwan only, if possible we can add more cities later. 3. If any bugs are there it will be removed. 4. We will try to improve user experience.
AEIE 891 – B.E. – AEIE – UIT, BU
Page 63
Smart Weather Station 2018
Chapter VI AGRI WEATHER APP
AEIE 891 – B.E. – AEIE – UIT, BU
Page 64
Smart Weather Station 2018 WHAT IS AN ANDROID APP? An Android app is a software application running on the Android platform. Because the Android platform is built for mobile devices, a typical Android app is designed for a smartphone or a tablet PC running on the Android OS. Although an Android app can be made available by developers through their websites, most Android apps are uploaded and published on the Android Market, an online store dedicated to these applications. The Android Market features both free and priced apps. Android apps are written in the Java programming language and use Java core libraries. They are first compiled to Android Studio to run on the Android virtual machine, which is a virtual machine specially designed for mobile devices. Developers may download the Android software development kit (SDK) from the Android website. The SDK includes tools, sample code and relevant documents for creating Android apps. Novice developers who simply want to play around with Android programming can make use of the App Inventor and AppyPie and other applications. Using this online application, a user can construct an Android app as if putting together pieces of a puzzle. Currently 77% of the world’s population is online. With the rapid adoption of smart phones and tablets businesses are faced with more and more opportunities every day that will radically change how their service or product is delivered and accessed. WHAT ARE THE BENEFITS OF HAVING A MOBILE APP? Customers don’t have to play the waiting game. Mobile apps provide a much faster alternative than mobile web browsing. Web browsing requires a user to launch a web browser, enter a URL and wait for the site to load (providing there is adequate reception), whereas it only takes a second to launch a mobile app because the majority of the information is stored in the application itself making it possible to function offline. AEIE 891 – B.E. – AEIE – UIT, BU
Page 65
Smart Weather Station 2018 Apps are a constant reminder of your business. Mobile apps reinforce your brand by increasing your visibility. An app gives a business more presence on a phone than a browser bookmark does because it is always visible on the phone’s screen. This helps build loyalty with customers because your business is in front of them at all times. Apps increase customer engagement. Customers are calling out for mobile apps because they quickly connect them to businesses they most commonly want or need. Businesses are using apps to improve their processes and increase the level of accessibility their customers have to them. The point of a mobile app is to seamlessly connect and interact with customers, making it a valuable tool for the modern business. Apps reduce costs. Apps reduce costs of SMS messages and paper newsletters. They simplify communications by securely, instantly and directly messaging customers. Apps reduce staff workload by information requests and phone calls. WHAT SHOULD BE CONSIDERED BEFORE DEVELOPING A MOBILE APP? Determining how popular your app will be. Is my app going to be helpful to customers and are people going to use it? The only answer to this question can be found through research. Poll your existing customers and your online visitors and ask the question. This will help you better understand whether there is a market for your app. Defining the purpose of your app. First and foremost the app has to have a clear purpose to provide value. Put yourself in your customers’ shoes, what do they want and need from your app? How is your app going to improve your service to them? What will grab their attention? Allocation of time and resources. Mobile apps are not just a financial investment, but also require an investment of time as well. Like anything technology based, mobile apps should be maintained to stay relevant to provide the best service to your customers and to continue improving internal processes. AEIE 891 – B.E. – AEIE – UIT, BU
Page 66
Smart Weather Station 2018 Your business requirements. Mobile apps aren’t for every business so before you make any decisions you need to focus on the actual needs of your business. If you need something with high functionality and have a website that requires customers to login, then a mobile app would be worthwhile because of the performance benefits mentioned earlier. Apps are also particularly useful for businesses that have high customer interaction and engagement. An example where mobile apps are working particularly well is for many Australian schools. This is because they bring together all school-to-parent communication in a convenient and effective way, enabling parents access to important school information, including, school newsletters, notices and alerts directly via their Smartphone. App Development Lifecycle: The mobile app ecosystem shows no sign of shutting down anytime soon, with revenues from app stores forecast to reach $80.6 billion by 2020, up from $44.6 billion in 2016. With 2.2 million apps in the iOS App Store and 2.8 million apps in the Play Store, creating high quality apps coupled with solid marketing strategies is the only guarantee for success. 5 STAGES IN THE MOBILE APP DEVELOPMENT LIFECYCLE: 1. IDEA: While every app starts with a core idea, your initial idea probably isn’t enough to build an app which makes money or get an audience. You need to build an app which caters to a large enough market yet is also specific enough to resonate with particular users. 2. DESIGN: Depending on your app budget and project scope, the design phase can be completed in a single afternoon or can take a team thousands of hours. This is when you start working on the look and feel of your app, since you already know the features and outcomes you will seek to deliver to the user AEIE 891 – B.E. – AEIE – UIT, BU
Page 67
Smart Weather Station 2018
Fig.6.1: Mobile App Development
3. DEVELOPMENT: Your developers can either use an app development platform like GoodBarber, Shopgate, and Buildfire, or set up the storage, databases, APIs, and servers as they start building the backend of your prototype. 4. TESTING: With mobile app development, it’s a good idea to test as early and often. Doing this will keep final costs low. The farther in you go into the development cycle the costlier it becomes to fix bugs. You should always refer to the original design and planning documents while building out the various test cases.
Fig.6.2: Mobile App Development Stages AEIE 891 – B.E. – AEIE – UIT, BU
Page 68
Smart Weather Station 2018 5. LAUNCH: The launch phase of the app development life cycle is critical to the success of your app. Botch this phase, and all the hard work and money you have invested will go down the drain. The objective of the launch phase is to get your app in the hands of as many users as possible.
Fig.6.3: Launching of Mobile App
APPLICATION FUNDAMENTALS: Android apps can be written using Kotlin, Java, and C++ languages. The Android SDK tools compile your code along with any data and resource files into an APK, an Android package, which is an archive file with an .apk suffix. One APK file contains all the contents of an Android app and is the file that Android-powered devices use to install the app. Each Android app lives in its own security sandbox, protected by the following Android security features: The Android operating system is a multi-user Linux system in which each app is a different user. By default, the system assigns each app a unique Linux user ID (the ID is used only by the system and is unknown to the app). The system sets permissions for all the files in an app so that only the user ID assigned to that app can access them. Each process has its own virtual machine (VM), so an app's code runs in isolation from other apps. AEIE 891 – B.E. – AEIE – UIT, BU
Page 69
Smart Weather Station 2018 By default, every app runs in its own Linux process. The Android system starts the process when any of the app's components need to be executed, and then shuts down the process when it's no longer needed or when the system must recover memory for other apps. The Android system implements the principle of least privilege. That is, each app, by default, has access only to the components that it requires to do its work and no more. This creates a very secure environment in which an app cannot access parts of the system for which it is not given permission. However, there are ways for an app to share data with other apps and for an app to access system services: It's possible to arrange for two apps to share the same Linux user ID, in which case they are able to access each other's files. To conserve system resources, apps with the same user ID can also arrange to run in the same Linux process and share the same VM. The apps must also be signed with the same certificate. An app can request permission to access device data such as the user's contacts, SMS messages, the mountable storage (SD card), camera, and Bluetooth. The user has to explicitly grant these permissions. App components are the essential building blocks of an Android app. Each component is an entry point through which the system or a user can enter your app. Some components depend on others. There are four different types of app components: Activities Services Broadcast receivers Content providers Each type serves a distinct purpose and has a distinct lifecycle that defines how the component is created and destroyed. The following sections describe the four types of app components. ACTIVITIES: An activity is the entry point for interacting with the user. It represents a single screen with a user interface. For example, an email app might have one activity that shows a list of new emails, another activity to compose an email, and another activity for reading emails. Although the activities work together to form a cohesive user AEIE 891 – B.E. – AEIE – UIT, BU
Page 70
Smart Weather Station 2018 experience in the email app, each one is independent of the others. As such, a different app can start any one of these activities if the email app allows it. For example, a camera app can start the activity in the email app that composes new mail to allow the user to share a picture We implement an activity as a subclass of the Activity class. SERVICES: A service is a general-purpose entry point for keeping an app running in the background for all kinds of reasons. It is a component that runs in the background to perform long-running operations or to perform work for remote processes. A service does not provide a user interface. For example, a service might play music in the background while the user is in a different app, or it might fetch data over the network without blocking user interaction with an activity. Another component, such as an activity, can start the service and let it run or bind to it in order to interact with it. There are actually two very distinct semantics services tell the system about how to manage an app: Started services tell the system to keep them running until their work is completed. This could be to sync some data in the background or play music even after the user leaves the app. Syncing data in the background or playing music also represents two different types of started services that modify how the system handles them. BROADCAST RECEIVERS: A broadcast receiver is a component that enables the system to deliver events to the app outside of a regular user flow, allowing the app to respond to system-wide broadcast announcements. Because broadcast receivers are another well-defined entry into the app, the system can deliver broadcasts even to apps that aren't currently running. So, for example, an app can schedule an alarm to post a notification to tell the user about an upcoming event... and by delivering that alarm to a Broadcast Receiver of the app, there is no need for the app to remain running until the alarm goes off. Many broadcasts originate from the system-for example, a broadcast announcing that the screen has turned off, the battery is low, or a picture was captured. Apps can also initiate broadcasts-for example, to let other apps know that some data AEIE 891 – B.E. – AEIE – UIT, BU
Page 71
Smart Weather Station 2018 has been downloaded to the device and is available for them to use. Although broadcast receivers don't display a user interface, they may create a status bar notification to alert the user when a broadcast event occurs. More commonly, though, a broadcast receiver is just a gateway to other components and is intended to do a very minimal amount of work. For instance, it might schedule a JobService to perform some work based on the event with JobScheduler. A broadcast receiver is implemented as a subclass of BroadcastReciever and each broadcast is delivered as an Intent object. For more information, see the BroadcastReciever class. CONTENT PROVIDERS: A content provider manages a shared set of app data that you can store in the file system, in a SQLite database, on the web, or on any other persistent storage location that your app can access. Through the content provider, other apps can query or modify the data if the content provider allows it. For example, the Android system provides a content provider that manages the user's contact information. As such, any app with the proper permissions can query the content provider, such as ContactsContract.Data, to read and write information about a particular person. It is tempting to think of a content provider as an abstraction on a database, because there is a lot of API and support built in to them for that common case. However, they have a different core purpose from a system-design perspective. To the system, a content provider is an entry point into an app for publishing named data items, identified by a URI scheme. Thus an app can decide how it wants to map the data it contains to a URI namespace, handing out those URIs to other entities which can in turn use them to access the data. CONSTRUCTION OF APP: Step 1: The first step is to take a responsive website that you want to convert in android app important point to note is that it should be a responsive(mobile friendly) website. Here we are using our own https://uitweatherstation.wixsite.com/agriweather to convert into android application using WebView which is Mobile responsive site. AEIE 891 – B.E. – AEIE – UIT, BU
Page 72
Smart Weather Station 2018 Step 2: Create a new project in Android Studio and name it AgriWeather.
Fig.6.4: Mobile App Development Using Android Studio
Fig.6.5: Android Studio Project Development
AEIE 891 – B.E. – AEIE – UIT, BU
Page 73
Smart Weather Station 2018
Fig.6.6: Android Device Selection
Fig.6.7: Activity Selection in Android App
AEIE 891 – B.E. – AEIE – UIT, BU
Page 74
Smart Weather Station 2018
Fig.6.8: Configure Activity
Step 3: Open res -> layout -> activity_main.xml (or) main.xml, create the application interface and add webView element to it.
Page 75
Smart Weather Station 2018
Fig.6.9: Application Interface Creation
Fig.6.10: Adding Web View Element
Step 4: Open src -> package -> MainActivity.java. Here firstly declare a webView variable, make JavaScript enable and load the URL of the website. package com.example.barai.agriweather; AEIE 891 – B.E. – AEIE – UIT, BU
Page 76
Smart Weather Station 2018 import android.app.Activity; import android.support.v7.app.AppCompatActivity; import android.os.Bundle; import android.view.Window; import android.webkit.WebSettings; import android.webkit.WebView; import android.webkit.WebViewClient; public class MainActivity extends Activity { public WebView webView; @Override protected void onCreate(Bundle savedInstanceState) { super.onCreate(savedInstanceState); requestWindowFeature(Window.FEATURE_NO_TITLE); setContentView(R.layout.activity_main); webView = (WebView)findViewById(R.id.webView); WebSettings webSettings = webView.getSettings(); webSettings.setJavaScriptEnabled(true); webView.loadUrl("http://mobile.dudasite.com/site/uitweatherstationwixsite"); webView.setWebViewClient(new WebViewClient()); } @Override public void onBackPressed() { if(webView.canGoBack()) { webView.goBack(); }else{ super.onBackPressed(); } } } AEIE 891 – B.E. – AEIE – UIT, BU
Page 77
Smart Weather Station 2018
Fig.6.11: Declaration of Web View
Step 5: Now to add back buttons to the application to need to add following code to your MainActivity.java class.
@Override public void onBackPressed() { if(webView.canGoBack()) { webView.goBack(); }else{ super.onBackPressed(); }
AEIE 891 – B.E. – AEIE – UIT, BU
Page 78
Smart Weather Station 2018 Step 6: Open AndroidManifest.xml file and add internet permission to it just after the package name. It is required because the App will load data directly from the website.
AEIE 891 – B.E. – AEIE – UIT, BU
Page 79
Smart Weather Station 2018
Fig.6.12: Add Internet Permission
Step 7: Debug and run the app on android emulator.
Fig.6.13: Debug and Run
AEIE 891 – B.E. – AEIE – UIT, BU
Page 80
Smart Weather Station 2018 App Testing on Android Device: 1st the app debugged .apk file needed to be stored in the internal storage of the android device. Then it has to be installed granting all the permissions needed. After installing the app it is used properly for gathering bug reports and resolve the problems faced .
Fig.6.14: Mobile App Installation
Fig.6.15: Mobile App in Mobile Screen
AEIE 891 – B.E. – AEIE – UIT, BU
Page 81
Smart Weather Station 2018
Fig.6.16: AgriWeather Mobile App
Areas In Which The App Needed To Be Optimized: UI of the app should be properly organized. Some minor bugs should be optimized. Database of the system have to be managed properly. Site should be maintained properly.
AEIE 891 – B.E. – AEIE – UIT, BU
Page 82
Smart Weather Station 2018
Chapter VII PROJECT IMPLEMENTATION
AEIE 891 – B.E. – AEIE – UIT, BU
Page 83
Smart Weather Station 2018 In this section, we will discuss and elaborate on step wise implementation of the project and hardwire assembly followed by coding, compiling, debugging and execution of the codes to see and check whether the sensors are working as per our expectation or not. Once each one of the sensors acts according to the desirable result, the next step will be to upload the data into the web server so that others can have access to these data via our designed website and android app named Agri Weather. Along with allowing other people and users to have access to our data, we will also create a data repository in csv file format and also the system will be able to provide a graphical representation of the data recorded on time scale for easier understanding and comprehension. In section will provide a pictorial depiction of the assembled set – up of each one of the measured parameters and will also show case the values obtained while the programs were executed. There are ten parameters in total which were considered in the Smart Weather Station viz. Air Quality, CO in PPM, Soil Temperature, Air Temperature, Relative Humidity, Soil Moisture Content, Atmospheric Pressure, Rain Fall, Light Intensity and Wind Speed. Indirectly we are capable of measuring Solar Radiation which is a function of the Solar Cells power generation and the area of cross section of the solar panels. Also as the system is self – powered, we have solar panels attached to the system that will generate enough solar energy to drive all our sensors and actuators. The solar panel set up here itself is self-regulatory and is capable of adjusting its panels according to the position of the sun so that the panels can be exposed to the maximum solar intensity and enhance the conversion factors and efficiency levels. The sensors that are used by us in this project implementation are LDR for light intensity, DHT22 for humidity and temperature, LM35 for soil temperature, BMP180 for atmospheric pressure, BS1881 Hall Effect sensor for anemometer DS18B20 digital water proof sensor for soil temperature, HC – SR04 US Sensor for rain fall measurement via level measurement, BH1705 for measuring light intensity. Among other sensors, ACS712 Hall Effect current sensor and ZMPT101B Voltage sensors are also used.
AEIE 891 – B.E. – AEIE – UIT, BU
Page 84
Smart Weather Station 2018 Raspberry Pi 3 Model B, Arduino UNO, Arduino Nano and Arduino Mega2560 are the controller units that are used to control the sensors and devices and as I/O regulators. The actuator elements used are L293D motor driver IC, 12 V DC motor, 5 V 13 Kg – cm torque providing high speed servo motor, 5 V DC submersible pump and 2.4 inch TFT LCD screen for display. For power generation and storage, a 12 V 20 W Solar panel is used along with a 12 V 6Ah battery. As reserve and ancillary power supply, two 9 V lithium batteries are used. Among other components, 4X3 plywood board for accommodating the entire set - up, wooden chassis for mounting the solar panels and suitable bearing for movement of the solar panels and anemometer cups are used. This is subsequent paragraphs we will elaborate the assembly of the individual set – up with the output as obtained while executing the code section. The results obtained are very much in congruence with the actual data which are cross referenced by other measuring devices The below diagram provides the block diagram representation of the Smart Weather Station.
AEIE 891 – B.E. – AEIE – UIT, BU
Page 85
Smart Weather Station 2018
Fig 7.1: Schematic Block Diagram Representation of Smart Weather Station AEIE 891 – B.E. – AEIE – UIT, BU
Page 86
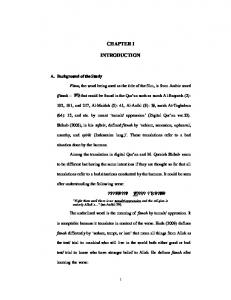
Smart Weather Station 2018 SOIL MOISTURE MEASUREMENT SET – UP: The soil moisture sensor consists of two probes which are used to measure the volumetric content of water. The two probes allow the current to pass through the soil and then it gets the resistance value to measure the moisture value. When there is more water, the soil will conduct more electricity which means that there will be less resistance. Therefore, the moisture level will be higher. Dry soil conducts electricity poorly, so when there will be less water, then the soil will conduct less electricity which means that there will be more resistance. Therefore, the moisture level will be lower. This sensor can be connected in two modes; Analog mode and digital mode. First, we will connect it in Analog mode and then we will use it in Digital mode. The Module also contains a potentiometer which will set the threshold value and then this threshold value will be compared by the LM393 comparator. The output LED will light up and down according to this threshold value. The below figures represent the hardware setup and implementation and the runtime output from the module.
Fig 7.2: Actual Set – Up of Soil Moisture Measurement AEIE 891 – B.E. – AEIE – UIT, BU
Page 87
Smart Weather Station 2018
Fig 7.3: Runtime Output from Soil Moisture Set - Up
RELATIVE HUMIDITY MEASUREMENT SET – UP: The amount of water vapor in the air at any given time is usually less than that required to saturate the air. The relative humidity is the percent of saturation humidity, generally calculated in relation to saturated vapor density. The formula for determining relative humidity is provided as below 𝑹𝒆𝒂𝒍𝒕𝒊𝒗𝒆 𝑯𝒖𝒎𝒊𝒅𝒊𝒕𝒚 =
𝑨𝒄𝒕𝒖𝒂𝒍 𝑽𝒂𝒑𝒐𝒖𝒓 𝑷𝒓𝒆𝒔𝒔𝒖𝒓𝒆 ∗ 𝟏𝟎𝟎% 𝑺𝒂𝒕𝒖𝒓𝒂𝒕𝒊𝒐𝒏 𝑽𝒂𝒑𝒐𝒖𝒓 𝑷𝒓𝒆𝒔𝒔𝒖𝒓𝒆
DHT11 or the DHT22 sensor for measuring temperature and humidity with the Arduino board. DHT22 is the more expensive version which obviously has better specifications. Its temperature measuring range is from -40 to +125 degrees Celsius with +-0.5 degrees accuracy, while the DHT11 temperature range is from 0 to 50 degrees Celsius with +-2 degrees accuracy. Also the DHT22 sensor has better humidity measuring range, from 0 to 100% with 2-5% accuracy, while the DHT11 humidity range is from 20 to 80% with 5% accuracy. AEIE 891 – B.E. – AEIE – UIT, BU
Page 88
Smart Weather Station 2018 DHT11 & DHT22 consist of a humidity sensing component, a NTC temperature sensor (or thermistor) and an IC on the back side of the sensor. For measuring humidity they use the humidity sensing component which has two electrodes with moisture holding substrate between them. So as the humidity changes, the conductivity of the substrate changes or the resistance between these electrodes changes. This change in resistance is measured and processed by the IC which makes it ready to be read by a microcontroller. Figures provided below represent the hardware set-up of the DHT22 module and the runtime output of the same.
Fig 7.4: Actual Set – Up of Relative Humidity Measurement
AEIE 891 – B.E. – AEIE – UIT, BU
Page 89
Smart Weather Station 2018
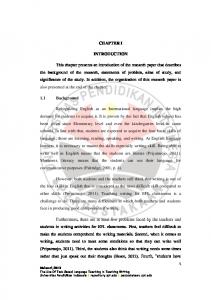
Fig 7.5: Runtime Output of Relative Humidity Set – Up RAIN FALL MEASUREMENT SET – UP: Rainfall is a very important parameter while designing and prototyping a weather station. Rainfall is measured in the unit of length i.e. mm which actually is the depth of a container up to which it is filled. As the base area of the container is known and fixed, by knowing the height, we are able to calculate the volume of rainfall received by any particular area. Here in our project we have used ultrasonic sensors to determine the height of the container till which it is filled. The ultrasonic sensor is also fed to a controller which performs two operations. Firstly it sends the data to the serial monitor for display and recording from where it is uploaded in the web server and secondly it drives the operation of a pump. The submersible motor is used to vacate the container upon reaching up to a certain limit beyond which the container will overflow. Figures below show the actual hardware set-up and the runtime output of this rain gauge. AEIE 891 – B.E. – AEIE – UIT, BU
Page 90
Smart Weather Station 2018
Fig 7.6: Actual Set – Up of Rain gauge
Fig 7.7: Runtime Output of Rain gauge AEIE 891 – B.E. – AEIE – UIT, BU
Page 91
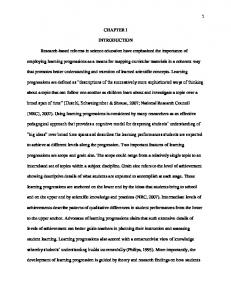
Smart Weather Station 2018 SOIL TEMPERTURE MEASUREMENT SET – UP: Soil temperature plays an important part of the soil ecology and as part of the meteorological data. For measuring the soil temperature, we have used LM35 sensor. The sensor is wrapped with water proof heat sink and then put inside the soil. The other end of the sensor is fixed to Arduino mega for data collection and uploading.
Fig 7.8: Actual Set – Up of the Soil Temperature Measurement
Fig 7.9: Runtime Output of the Soil Temperature Measurement AEIE 891 – B.E. – AEIE – UIT, BU
Page 92
Smart Weather Station 2018 WIND SPEED MEASUREMENT (ANEMOMETER) SET – UP: Speed and direction of wind play a vital role in the weather vis – a – vis climate of a region as evaporation and transpiration rates are greatly determined by them. Here in our weather station, we therefore have designed a low cost anemometer to determine and record the speed of wind by using hall-effect sensors. The set-up contains a rod containing two magnets passing by a Hall-effect sensor and on top of the rod there are four cups mounted to receive the wind and the rod is housed on ball bearing for friction free rotation. A Hall-effect sensor is a transducer that varies its output voltage in response to a magnetic field. Hall-effect sensors are used for proximity switching, positioning, speed detection, and current sensing applications. In a Hall-effect sensor, a thin strip of metal has a current applied along it. In the presence of a magnetic field, the electrons in the metal strip are deflected toward one edge, producing a voltage gradient across the short side of the strip (perpendicular to the feed current). Hall-effect sensors have an advantage over inductive sensors in that, while inductive sensors respond to a changing magnetic field which induces current in a coil of wire and produces voltage at its output, Hall-effect sensors can detect static (non-changing) magnetic fields. In its simplest form, the sensor operates as an analog transducer, directly returning a voltage. With a known magnetic field, its distance from the Hall plate can be determined. Using groups of sensors, the relative position of the magnet can be deduced. We have used a US1881 hall – effect sensor that is an integrated Hall-Effect latched sensor. Holding a magnet near the sensor will cause the output pin to toggle. This makes for a robust presence sensor. A reed sensor also works nicely, but can be limited by the glass encapsulation and size. A Hall-Effect sensor is much smaller, but can handle less current than a reed switch. The device includes an on-chip Hall voltage generator for magnetic sensing, a comparator that amplifies the Hall voltage, and a Schmitt trigger to provide switching hysteresis for noise rejection, and open-collector output. An internal bandgap
AEIE 891 – B.E. – AEIE – UIT, BU
Page 93
Smart Weather Station 2018 regulator is used to provide temperature compensated supply voltage for internal circuits and allows a wide operating supply range. If a magnetic flux density larger than threshold Bop, DO is turned on (low). The output state is held until a magnetic flux density reversal falls below Brp causing DO to be turned off (high). Figures below show the hardwire implementation and runtime output of the designed anemometer.
Fig 7.10: Actual Set – Up of Anemometer
Fig 7.11: Runtime Output of Wind Speed Measurement AEIE 891 – B.E. – AEIE – UIT, BU
Page 94
Smart Weather Station 2018 TEMPERATURE MEASUREMENT SET – UP: In order to measure air temperature, DHT22 sensors are used in our project, which is a dual sensor capable of measuring temperature and relative humidity. For measuring temperature DHT22 sensors use a NTC temperature sensor or a thermistor. A thermistor is actually a variable resistor that changes its resistance with change of the temperature. These sensors are made by sintering of semi conductive materials such as ceramics or polymers in order to provide larger changes in the resistance with just small changes in temperature. The term “NTC” means “Negative Temperature Coefficient”, which means that the resistance decreases with increase of the temperature. Figures below show the hardware implementation and runtime output.
Fig 7.12: Actual Set – Up of Temperature Measurement
AEIE 891 – B.E. – AEIE – UIT, BU
Page 95
Smart Weather Station 2018
Fig 7.13: Runtime Output of Temperature Measurement
ATMOSPHERIC PRESSURE MEASUREMENT SET – UP: Measurements from a mercury barometer are usually made in inches of Mercury (in Hg). An aneroid barometer can be used in place of a mercury barometer. It is easier to move and is often easier to read. This instrument contains sealed wafers that shrink or spread out depending on changes of atmospheric pressure. The BMP180 consists of a piezo-resistive sensor, an analog to digital converter and a control unit with E2PROM and a serial I2C interface. The BMP180 delivers the uncompensated value of pressure and temperature. The microcontroller sends a start sequence to start a pressure or temperature measurement. After converting time, the result value (pressure or temperature respectively) can be read via the I2C interface. For calculating temperature in °C and pressure in hPa, the calibration data has to be used. These constants can be read out from the BMP180 E2PROM via the I2C interface at software initialization. The sampling rate can be increased up to 128 samples per second (standard mode) for dynamic measurement. In this case, it is
AEIE 891 – B.E. – AEIE – UIT, BU
Page 96
Smart Weather Station 2018 sufficient to measure the temperature only once per second and to use this value for all pressure measurements during the same period. The below figures show the assembly of BMP180 module on the set – up and also show the runtime output of the module.
Fig 7.14: Actual Set – Up of BMP180 for Pressure Measurement
Fig 7.15: Runtime Output of Pressure Measurement AEIE 891 – B.E. – AEIE – UIT, BU
Page 97
Smart Weather Station 2018 AIR QUALITY MEASUREMENT SET – UP: Monitoring stations also may be established to determine background pollution levels, away from urban areas and emissions sources. Systems are needed to ensure that data are of acceptable quality, to record and store the data, and to analyze the data and present results. We have used MQ135 sensor module for monitoring and recording of the air quality. The MQ-135 gas sensor senses the gases like ammonia nitrogen, oxygen, alcohols, aromatic compounds, sulfide and smoke. The boost converter of the chip MQ-3 gas sensor is PT1301. The operating voltage of this gas sensor is from 2.5V to 5.0V. The MQ-3 gas sensor has a lower conductivity to clean the air as a gas sensing material. In the atmosphere we can find polluting gases, but the conductivity of gas sensor increases as the concentration of polluting gas increases. MQ-135 gas sensor can be implementation to detect the smoke, benzene, steam and other harmful gases. It has potential to detect different harmful gases. The MQ-135 gas sensor is low cost to purchase. The air quality sensor is also a MQ-135 sensor for detecting venomous gases that are present in the air in homes and offices. The gas sensor layer of the sensor unit is made up of tin dioxide (SnO2); it has lower conductivity compare to clean hair and due to air pollution the conductivity is increases. The air quality sensor detects ammonia, nitrogen oxide, smoke, CO2 and other harmful gases. The air quality sensor has a small potentiometer that permits the adjustment of the load resistance of the sensor circuit. The 5V power supply is used for air quality sensor.
AEIE 891 – B.E. – AEIE – UIT, BU
Page 98
Smart Weather Station 2018
Fig 7.16: Actual Set – Up of Air Quality Monitor
Fig 7.17: Runtime Output of Air Quality Monitor AEIE 891 – B.E. – AEIE – UIT, BU
Page 99
Smart Weather Station 2018 CO MEAUSREMENT SET – UP: A carbon monoxide detector or CO detector is a device that detects the presence of the carbon monoxide (CO) gas in order to prevent carbon monoxide poisoning. In the late 1990s Underwriters Laboratories changed their definition of a single station CO detector with a sound device in it to a carbon monoxide (CO) alarm. This applies to all CO safety alarms that meet UL 2034 standard; however for passive indicators and system devices that meet UL 2075, UL refers to these as carbon monoxide detectors. Here in our project we have utilized MQ7. Sensitive layer of MQ-7 gas sensitive components is made of SnO2 with stability. So, it has excellent long term stability. Its service life can reach 5 years under using condition. Resistance value of MQ-7 is difference to various kinds and various concentration gases. Figures below shows the MQ7 sensor in operation along with the runtime output.
Fig 7. 18: Actual Set – Up of CO Measurement
AEIE 891 – B.E. – AEIE – UIT, BU
Page 100
Smart Weather Station 2018
Fig 7.19: Runtime Output of CO Measurement
LIGHT INTENSITY MEASUREMENT SET – UP: Luminous intensity, the quantity of visible light that is emitted in unit time per unit solid angle. The unit for the quantity of light flowing from a source in any one second (the luminous power, or luminous flux) is called the lumen. The lumen is evaluated with reference to visual sensation. Lux (Illuminance) is a measurement of the light intensity at any point. It is equal to 1 Lumen per square meter. Figures below show the hardware assembly and runtime output from the module.
AEIE 891 – B.E. – AEIE – UIT, BU
Page 101
Smart Weather Station 2018
Fig 7.20: Actual Set – Up for Light Intensity Measurement
Fig 7.21: Runtime Output of Light Intensity Measurement
AEIE 891 – B.E. – AEIE – UIT, BU
Page 102
Smart Weather Station 2018 SOLAR RADIATION MEASUREMENT SET – UP: A solar radiation sensor measures solar energy from the sun. Solar radiation is radiant energy emitted by the sun from a nuclear fusion reaction that creates electromagnetic energy. The spectrum of solar radiation is close to that of a black body with a temperature of about 5800 K. About half of the radiation is in the visible short-wave part of the electromagnetic spectrum. The other half is mostly in the near-infrared part, with some in the ultraviolet part of the spectrum. The units of measure are Watts per square meter. The device is typically used in agricultural applications, and is used in the calculation of Evapotranspiration. Evapotranspiration is the potential for evaporation of moisture from the soil (or the reverse of rainfall) and is a function solar energy, wind and temperature. A very cheap and efficient way of measuring solar radiation is by using a solar panel. The formula of measuring solar radiation using solar panel is provided as under 𝑺𝒐𝒍𝒂𝒓 𝑹𝒂𝒅𝒊𝒂𝒕𝒊𝒐𝒏 (𝑾⁄𝒎𝟐 ) = 𝑽𝒐𝒍𝒕𝒂𝒈𝒆 ∗ 𝑪𝒖𝒓𝒓𝒆𝒏𝒕⁄𝑨𝒓𝒆𝒂 𝒐𝒇 𝑺𝒐𝒍𝒂𝒓 𝑷𝒂𝒏𝒆𝒍
Fig 7.22: Actual Solar Panel Set – Up for Solar Radiation Calculation AEIE 891 – B.E. – AEIE – UIT, BU
Page 103
Smart Weather Station 2018 SUN TRACKING SOLAR PANEL SET – UP: Here in this set – up, the objective is to make the solar panel rotate and revolve about its axes to align itself according to the position of the sun in order to make maximum sunlight incident on the panels. For this, we have made a chassis capable of rotating and revolving about two axes, i.e. one axis being from east to west with a rotation of 180° and the other axis being from north to south with a rotation of 360°. LDR sensors are mounted on the edges of the solar panel and a comparator circuit is built that will compare the light intensity incident on the panel. The controller on being fed with the comparator result will direct the actuator elements to position themselves in such a manner such that the intensity is at balanced positon or place the panel in alignment with the LDR receiving maximum intensity. As actuator elements, we have used to servo motor on two different arms holding the panels for movement from east to west. The figures below represent the logical block diagram and the actual set – up diagram of the tracking panels in real life scenario with measured results that proved more efficient.
Fig 7.23: Block Diagram of Dual Axes Sun Tracking Solar Panel AEIE 891 – B.E. – AEIE – UIT, BU
Page 104
Smart Weather Station 2018
Fig 7.24: Laboratory Set -Up of Sun Tracker Solar Panels
Fig 7.25: Field Validation of Sun Tracker Panels
Fig 7.26: Current Output for a fixed panel system AEIE 891 – B.E. – AEIE – UIT, BU
Page 105
Smart Weather Station 2018
Fig 7.27: Current Output of Tracking Panel System
Fig 7.28: Power Output Comparison of Fixed & Tracking Systems
After final set-up and comparison of the power ratings obtained it is found that the tracking solar panels do produce 25% more efficiency than the fixed solar panels.
AEIE 891 – B.E. – AEIE – UIT, BU
Page 106
Smart Weather Station 2018
Fig 7.29: Front View of the Total Weather Station Set – Up
Fig 7.39: Top View of the Total Weather Station Se - Up AEIE 891 – B.E. – AEIE – UIT, BU
Page 107
Smart Weather Station 2018
Chapter VIII DATA UPLOADING RESULTS
AEIE 891 – B.E. – AEIE – UIT, BU
&
Page 108
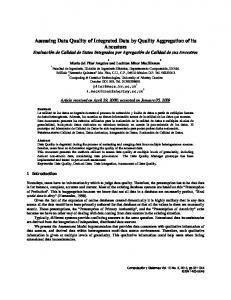
Smart Weather Station 2018 After the sensors sense data, the data are sent to the controller unit. The Arduino Mega is connected to ESP8266 Wi – FI module. This ESP8266 send out the data to a network server. Two channels with twelve field for twelve different parameters are created on Thingspeak which is an open source IOT application and API where data can be stored and later retrieved. For the internet connection, the ESP8266 WiFi (serial) module is used because it is small, cheap and easy to use, and for data logging the open data platform is used for the Internet of Things "ThingSpeak".
Fig 8.1: Function of ESP8266 Wi –Fi module pins
The pin operations of ESP8226 module is provided below Vcc, RST and CH_PD are connected to Arduino 3.3V
RXD to Arduino pin 11 (TX) via voltage divider circuit
TXD to Arduino pin 10 (RX)
Remove the RX and TX cables from the Arduino board at the time of uploading.
The ESP8266-01 is the smallest ESP8266 module and only has 8 pins. Of these VCC, GND, RST (reset) and CH_PD (chip select) are not I/O pins but are needed the operation of the module. This leaves GPIO0, GPIO2, TX and RX available as possible I/O pins, but even these have pre-assigned functions. The GPIO0 and GPIO2 determine what mode the module starts up in and the TX/RX pins are used to program the module and for Serial I/O, commonly used for debugging. GPIO0 and GPIO2 need to have pull-up resistors connected to ensure the module starts up correctly.
AEIE 891 – B.E. – AEIE – UIT, BU
Page 109
Smart Weather Station 2018
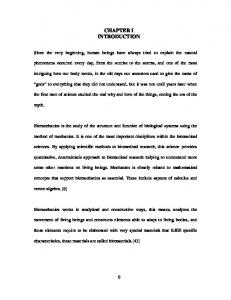
Fig 8.2: Actual Circuit Representation depicting ESP8266 connected to Mega2560
Source Code: The following code section is used to establish connection via Wi – Fi Module & upload data to ThingSpeak. #include #include /*-----------------ESP8266 Serial WiFi Module---------------*/ #define RX 10
//TX pin of esp8266 goes to RX of Arduino
#define TX 11
//RX pin of esp8266 goes to TX of Arduino
#define SSID "SSID"
// "SSID-WiFiname"
#define PASS "PASSWORD"
// "password"
#define IP "184.106.153.149"
// thingspeak.com ip
String api1 = "GET /update?key=WRITE_API_KEY"; //change WRITE_API_KEY with your key of channel 1... String api2 = "GET /update?key=WRITE_API_KEY"; //change WRITE_API_KEY with your key of channel 2... SoftwareSerial esp8266(RX,TX); /*-----------------------------------------------------------*/ AEIE 891 – B.E. – AEIE – UIT, BU
Page 110
Smart Weather Station 2018 int error; int field1; int field2; int field3; int field4; int field5; int field6; int field7; int field8; int field9; int field10; int field11; int field12; int field13; int field14; int field15; int field16; void setup() { Serial.begin(9600); esp8266.begin(115200); //use default 115200 for esp8266. esp8266.println("AT"); delay(5000); if(esp8266.find("OK")){ connectWiFi(); } // put your setup code here, to run once: } void loop() { start: //label AEIE 891 – B.E. – AEIE – UIT, BU
Page 111
Smart Weather Station 2018 error=0; // put your main code here, to run repeatedly: updateCh1(); //Resend if transmission is not completed if (error==1){ goto start; //go to label "start" } updateCh2(); //Resend if transmission is not completed if (error==1){ goto start; //go to label "start" } delay(60000); //Update every 1 minute } void updateCh1(){
//For updating Channel 1
String cmd = "AT+CIPSTART=\"TCP\",\""; cmd += IP; cmd += "\",80"; esp8266.println(cmd); delay(2000); if(esp8266.find("Error")){ return; } cmd = api1 ; cmd += "&field1="; //field 1 for field 1 data cmd += field1; cmd += "&field2="; //field 2 for field 2 data cmd += field2; cmd += "&field3="; //field 1 for field 3 data AEIE 891 – B.E. – AEIE – UIT, BU
Page 112
Smart Weather Station 2018 cmd += field3; cmd += "&field4="; //field 4 for field 4 data cmd += field4; cmd += "&field5="; //field 5 for field 5 data cmd += field5; cmd += "&field6="; //field 6 for field 6 data cmd += field6; cmd += "&field7="; //field 7 for field 7 data cmd += field7; cmd += "&field8="; //field 8 for field 8 data cmd += field8; cmd += "\r\n\r\n"; esp8266.print("AT+CIPSEND="); esp8266.println(cmd.length()); if(esp8266.find(">")){ esp8266.print(cmd); Serial.print("Data Uploaded in Channel 1"); } else{ esp8266.println("AT+CIPCLOSE"); Serial.println("Error Uploading Data in Channel 1"); } } void updateCh2(){
//For updating Channel 2
delay(3000); String cmd = "AT+CIPSTART=\"TCP\",\""; cmd += IP; cmd += "\",80"; AEIE 891 – B.E. – AEIE – UIT, BU
Page 113
Smart Weather Station 2018 esp8266.println(cmd); delay(2000); if(esp8266.find("Error")){ return; } cmd = api2 ; cmd += "&field1="; //field 1 for field 9 data cmd += field9; cmd += "&field2="; //field 2 for field 10 data cmd += field10; cmd += "&field3="; //field 3 for field 11 data cmd += field11; cmd += "&field4="; //field 4 for field 12 data cmd += field12; cmd += "&field5="; //field 5 for field 13 data cmd += field13; cmd += "&field6="; //field 6 for field 14 data cmd += field14; cmd += "&field7="; //field 7 for field 15 data cmd += field15; cmd += "&field8="; //field 8 for field 16 data cmd += field16; cmd += "\r\n\r\n"; esp8266.print("AT+CIPSEND="); esp8266.println(cmd.length()); if(esp8266.find(">")){ esp8266.print(cmd); Serial.print("Data Uploaded in Channel 2"); } AEIE 891 – B.E. – AEIE – UIT, BU
Page 114
Smart Weather Station 2018 else{ esp8266.println("AT+CIPCLOSE"); Serial.println("Error Uploading Data in Channel 2"); } } boolean connectWiFi(){
//Connect esp8266 with WiFi
esp8266.println("AT+CWMODE=1"); Serial.println("Connecting to WiFi"); delay(2000); String cmd="AT+CWJAP=\""; cmd+=SSID; cmd+="\",\""; cmd+=PASS; cmd+="\""; esp8266.println(cmd); delay(5000); }
When programming the ESP8266 using the Arduino IDE, we sometimes encounter these error messages as cited below. esp_com open failed error: Failed to open COM33 error: espcomm_open failed error: espcomm_upload_mem failed In that case these steps should be follwoed to get it working:AEIE 891 – B.E. – AEIE – UIT, BU
Page 115
Smart Weather Station 2018 1. 2. 3. 4. 5. 6.
Check if ESP8266 board is selected in the Arduino Tools menu. Check if we have selected a COM port in the Arduino Tools menu. Power cycle the ESP8266 with GPIO0 should be grounded. If 3) does not fix it, we should unplug the USB cable from the computer, wait few secs and then plug it back in If 4) does not fix it, we should unplug USB cable from PC, close Arduino IDE, open Arduino IDE, plug USB cable back in. When we apply power to the ESP8266, after grounding GPIO0, it should be made sure it is applied cleanly. The ESP8266 led should just come on and stay on without any flashes.
Few things that require notice while using ESP8266 are: GPIO1 (TX) is used as the Data line, because we will always get some debug output on GPIO1 on power up. There is no way to suppress this output, but the Clock line (RX) will be held high so none of this data will be clocked to the slaves When programming the ESP8266, the RX line is connected to the programmer's output. At the end of the programming the ESP8266 reboots and 330 Protection resistor prevents RX shorting the programmer's output drive. The I2C series resistors provide similar protection for the TX, RX from shorts on the I2C bus The ESP8266 is 3.3V device so preferably 3.3V I2C slaves are used. Many, but not all, I2C devices are 3.3V these days. “In general, in a system where one device is at a higher voltage than another, it may be possible to connect the two devices via I2C without any level shifting circuitry in between them. The trick is to connect the pullup resistors to the lower of the two voltages.” (SparkFun I2C tutorial). Using I2C is a great way to add a multi-channel A-to-D converter to the ESP8266-01 which does not expose the single ADC input of the underlying module.
AEIE 891 – B.E. – AEIE – UIT, BU
Page 116
Smart Weather Station 2018 THINGSPEAK UPLOAD: ThingSpeak server is an open data platform and API for the Internet of Things that enables us to collect, store, analyze, visualize, and act on data from sensors. We here will try and understand how data can be sent to THingSpeak via ESP8266 Wi – FI Module from Arduino. The devices and equipment that we will be requiring to attain the mentioned objective are Arduino UNO/Mega/Nano Sensors whose data will be uploaded. Thingspeak Account ESP8266 Module. There are other similar open data platforms like http://2lemetry.com http://exosite.com https://www.carriots.com https://www.grovestreams.com https://thingspeak.com http://openenergymonitor.org Firstly, the easy part is done and i.e. creating an account with Thingspeak. Once that is done, one can create channels each of which can have a maximum of eight fields representing eight data set from eight different sensors. For more than eight sensors, one therefore has to create more channels which thankfully has no upper limit. As we create channels, two API keys viz. Write API key and Read API key are generated which we will later use in our program so that our website can identify the channel created. From thingspeak, data is further exported to the website created viz. AgriWeather and the android app viz. AgriWeather. AEIE 891 – B.E. – AEIE – UIT, BU
Page 117
Smart Weather Station 2018 Embedding Thingspeak data on personal website. It is possible to embed ThingSpeak graphics and to display real-time data on our personal website. It is possible To provide real-time updates of our measured values on our own website. To create a dashboard for showing multiple fields or channels on the same webpage. To make a mobile app with embedded ThingSpeak plots. The three steps to embed data from ThingSpeak to our website in given as below 1. Gather the tag information from the plot that we are interested in. On the title bar of our plot, we have to click on the word bubble. 2. Then we have to copy the text that appears in the window. The text has the format shown here: 3. We can edit HTML in any plain text editor such as Notepad. In the editor we have to add the element we copied from our channel to our html file. ThingSpeak Embedded Plot A data repository is provided in the website from where data can be downloaded for future use and reference.
AEIE 891 – B.E. – AEIE – UIT, BU
Page 118
Smart Weather Station 2018
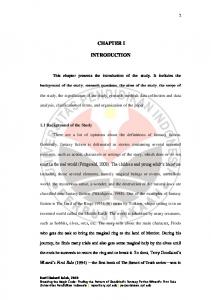
Fig 8.3: The Output Screen of the ThingSpeak Application
AEIE 891 – B.E. – AEIE – UIT, BU
Page 119
Smart Weather Station 2018
Chapter IX RATIOCINATION
AEIE 891 – B.E. – AEIE – UIT, BU
Page 120
Smart Weather Station 2018 Going through the chapter in this report, it has been clearly established, how much important climate and hence weather is in our day to day life and activities. All the ecological plans, schemes, initiatives and implementations are hugely guided by the prevailing weather condition. Hence it is also very important to pick up the right parameters while trying to analyze and predict the weather conditions. In chapter II of this report, we have spoken in depth of the parameters and the sensors that are used while implementing the Smart Weather Station. Now it is claimed to a Smart system, it is also required for us to comprehensively understand the need and utility of Information and Communication Technology (ICT) and Internet of Things (IoT). These sections would help us design and architect the basic framework on which communication would have be made possible. And talking about communication, it is meant both way communication and interactive information exchange, so that other researchers can access the data and feed their opinions, advices and suggestions along with modifications into it. The need to have a website and an Android based app will add the flexibility of access and operation. The user and operator friendly GUI will make the platform more informative and comprehensive. With that aim and target in mind, Agri Weather website and app were created. And these features have brought the entire hardwire setup within the grasp of all those person who have access to internet and/or a smart android phone. The main focus around which all the above mentioned topics revolved was the implementation of the weather station as a prototype model having the capacity and capability of being Smart. The goal has been achieved as it was implemented on a table top board with all the features coupled together as a singular operational unit. Albeit it is a singular unit, options and provisions are made so that partwise troubleshooting, repairing, replacement and modifications can be made as and when necessary. The entire cost of building this prototype is INR 10000/- (Ten Thousand) only where its similar counterparts are available in the market at double or triple its cost. This low price construction with the additional features of IoT and website and app makes the station stand apart and unique from others. However, as the room for improvement is never saturated, we are looking forward to making this prototype model even cheaper and more accurate and precise. AEIE 891 – B.E. – AEIE – UIT, BU
Page 121
Smart Weather Station 2018
CHPATER X SOURCE CODE
AEIE 891 – B.E. – AEIE – UIT, BU
Page 122
Smart Weather Station 2018 1. SOURCE CODE FOR AIR QUALITY & CO CONTENT CHECKING const int coAOUTpin = A0; const int coDOUTpin = 8; const int ledpin = 13; int value; int limit; int sensorValue; float vol; void setup() { Serial.begin(9600); pinMode(ledpin, OUTPUT); } void loop() { value = analogRead(coAOUTpin); sensorValue=analogRead(A2);//air quality check sensor value read; //vol=(float)sensorValue/1024*5,0; //Serial.print("PPM=");//air quality check sensor value; //Serial.println(vol,1); Serial.print(sensorValue); Serial.print(","); //Serial.print("CO value= ");//CO sensor value; Serial.println(value); delay(1000); }
AEIE 891 – B.E. – AEIE – UIT, BU
Page 123
Smart Weather Station 2018 2. SOURCE CODE FOR WIND SPEED MEASUREMENT volatile byte half_revolution; unsigned int rpm; unsigned long timeold; float v; void setup() { Serial.begin(9600); attachInterrupt(0, rpm_fun, RISING); half_revolution = 0; rpm = 0; timeold = 0; } void loop() { if (half_revolution >= 20){ rpm = 30*1000/(millis() - timeold)*half_revolution; v=(0.15*rpm*60)/1000; timeold = millis(); half_revolution = 0; } } void rpm_fun() { half_revolution++; Serial.print("wind speed="); Serial.print(v); Serial.print("\n"); } AEIE 891 – B.E. – AEIE – UIT, BU
Page 124
Smart Weather Station 2018 3. TEMPERATURE & HUMIDITY MEASUREMENT WITH DHT22 #include #include #include // replace with your channel's thingspeak API key, String apiKey = "BWWMTVIGG39MFG8B"; // replace with your wifi ssid and wpa2 key const char *ssid = "JioDongle2_50BE2D"; const char *pass = "6runuk770t"; const char* server = "api.thingspeak.com"; #define DHTPIN 0 // pin where the dht22 is connected DHT dht(DHTPIN, DHT22,15); WiFiClient client; void setup() { Serial.begin(115200); delay(10); dht.begin(); Serial.print("Connecting to "); Serial.println(ssid); WiFi.mode(WIFI_STA); WiFi.begin(ssid, pass); while (WiFi.status() != WL_CONNECTED) { delay(500); Serial.print("."); } Serial.println(""); Serial.println("WiFi connected"); AEIE 891 – B.E. – AEIE – UIT, BU
Page 125
Smart Weather Station 2018 } void loop() { float h = dht.readHumidity(); float t = dht.readTemperature(); if (isnan(h) || isnan(t)) { Serial.println("Failed to read from DHT sensor!"); return; } if (client.connect(server,80)) { // "184.106.153.149" or api.thingspeak.com String postStr = apiKey; postStr +="&field1="; postStr += String(t); postStr +="&field2="; postStr += String(h); postStr += "\r\n\r\n"; client.print("POST /update HTTP/1.1\n"); client.print("Host: api.thingspeak.com\n"); client.print("Connection: close\n"); client.print("X-THINGSPEAKAPIKEY: "+apiKey+"\n"); client.print("Content-Type: application/x-www-form-urlencoded\n"); client.print("Content-Length: "); client.print(postStr.length()); client.print("\n\n"); client.print(postStr); Serial.print("Temperature: "); Serial.print(t); Serial.print(" degrees Celcius, Humidity: "); Serial.print(h); Serial.println("%. Send to Thingspeak."); AEIE 891 – B.E. – AEIE – UIT, BU
Page 126
Smart Weather Station 2018 } client.stop(); Serial.println("Waiting..."); // thingspeak needs minimum 15 sec delay between updates, i've set it to 30 seconds delay (30000); } 4. LIGHT INTENSITY (LUX) MEASUREMENT #include //BH1750 IIC Mode #include int BME280address = 0x76; //setting i2c address byte buff[2]; void setup() { Wire.begin(); Serial.begin(57600);//init Serail band rate } void loop() { int i; uint16_t val=0; BME280_Init(BME280address); delay(200); if(2==BME280_Read(BME280address)) { val=((buff[0]