PHYSICAL REVIEW B 66, 195207 共2002兲
Characterization of hydrogen and silicon-related defects in CVD diamond by electron spin resonance K. Iakoubovskii* and A. Stesmans Department of Physics, Katholieke Universiteit Leuven, Celestijnenlaan 200 D, 3001 Leuven, Belgium 共Received 28 November 2001; revised manuscript received 19 August 2002; published 11 November 2002兲 Two hydrogen and two silicon-related defect centers were detected and characterized by electron-spin resonance 共ESR兲 in diamond films grown by chemical vapor deposition. Observation of hyperfine structure, combined with illumination and polishing treatments, suggests that the observed KUL2 and KUL9 ESR centers originate from two charge states of one defect, containing a vacancy and an adjacent hydrogen atom, while the KUL1 and KUL8 spectra can be associated with two charge states of another defect, involving one Si atom and exhibiting a trigonal symmetry. The KUL2 and KUL9 centers are tentatively assigned to negatively charged and neutral hydrogen-divacancy complexes, respectively. DOI: 10.1103/PhysRevB.66.195207
PACS number共s兲: 76.30.Mi, 68.55.Ln
I. INTRODUCTION
Peculiarities related to the synthesis strongly affect the defect structure of diamond grown by chemical vapor deposition 共CVD兲. It is typically synthesized on a Si substrate in a medium rich in hydrogen and, accidentally, in nitrogen. This accounts for the presence of substantial concentrations of silicon, hydrogen, and nitrogen atoms in CVD diamond. Two spin S⫽ 21 hydrogen-related electron-spin-resonance 共ESR兲 centers, named H1 and H2, were previously identified in CVD diamond.1 The H1 center is always present in diamond films in concentrations reaching up to hundreds of atomic parts per million, while the H2 center is less frequent and was observed only in a few samples with low impurity content. The involvement of one hydrogen atom in the H1 and H2 centers was concluded from the observation of forbidden hyperfine 共hf兲 lines 共those for which ⌬m⫽1, where m represents the quantum number of nuclear spin I), which were separated by a distance corresponding to twice the nuclear-magnetic-resonance frequency of hydrogen. The allowed (⌬m⫽0) hydrogen hf lines remained unresolved within the central line. The corresponding principal values of the hf interaction matrix A 1 , A 2 , and A 3 were inferred from line-shape fitting. Using those hf values, the distance r H between the unpaired spin and the hydrogen atom was estimated 共see Table II, which is discussed later兲 using a formula derived within the point-dipole approximation: r H ⬃(gg H B H /b) 1/3, where b⫽(2⫻A 1 ⫺A 2 ⫺A 3 )/6, A 1 is the largest hf value, and g, B and g H , H are the g factors and magnetic moments of electrons and protons, respectively. The estimated distances are 0.19 nm for the H1 and 0.23 nm for the H2 centers, which suggested the assignment of the H1 center to a neutral hydrogen-vacancy ( 关 H-V 兴 0 ) defect. Recently, three other hydrogen-related ESR centers, KUL2, KUL3, and KUL4, have been reported.2 Here, we characterize one more hydrogen-related S⫽ 12 ESR center, termed KUL9, and associate the KUL2 and KUL9 centers with negative and neutral hydrogen-divacancy complexes, respectively. As to silicon impurity, Si atoms may diffuse from the Si 0163-1829/2002/66共19兲/195207共7兲/$20.00
substrate into the growing diamond film and therefore reside within a few microns from the substrate side in the CVD diamond film.3 So far, only one Si-related defect center has been reported in as-grown CVD diamond films. It is associated with the 1.682-eV optical center and is suggested to consist of a Si atom at the center of a divacancy (VSiV 0 ) thus forming a defect of trigonal symmetry.4 There is, however, evidence for another Si-related defect: The S⫽1 ESR center KUL1 was previously associated with a Ni-divacancy defect.5 The assignment was based on the observation of hf lines, ascribed to the 61Ni isotope, and on an apparent correlation of the KUL1 signals with a 15-line photoluminescence 共PL兲 system, showing a PL line shape characteristic of a Ni-related center. Later results2 suggested that those ESR hf lines are unrelated to the KUL1 center, thus questioning the involvement of Ni. Three sets of hf lines were detected in the KUL1 spectrum. Two of them were assigned to one and two equivalent carbon sites ( 13C). The third one could originate either from four equivalent carbon sites or from one silicon site ( 29Si). Here, we show that the second assignment is correct and thus the KUL1 center does involve one Si atom. Moreover, we report an undocumented Si-related S⫽ 21 ESR center, labeled KUL8, which is suggested to be the one-more-negative charge state of the KUL1 center. Additionally, a previously reported6 opticalabsorption line at 1.640 eV is associated with a Si-related defect. Nitrogen in CVD diamond originates from the N2 impurity in the feed gases and from leaks in the CVD reactor. In CVD diamond, it is predominantly present as a single substitutional atom (NS ) forming an S⫽ 21 center, termed P1. The central line of the P1 spectrum may serve as a useful g standard (g marker兲, having a nominal zero-crossing g value g ZC ⫽2.002 17(1). Second-order corrections result in the g value of 2.002 16共1兲 for the P1 center.2 II. EXPERIMENTAL DETAILS
Polycrystalline diamond films were grown on Si substrates in a microwave plasma reactor. Typical deposition parameters were microwave power P ⫽5 kW, gas flow rate 300 cm3 /min, and substrate temperature 800 °C. Nitrogen
66 195207-1
©2002 The American Physical Society
PHYSICAL REVIEW B 66, 195207 共2002兲
K. IAKOUBOVSKII AND A. STESMANS
concentration was varied by adding 0–900 ppm 共volume兲 of N2 to the 99:1 H2 :CH4 feed gas mixture and by changing the base vacuum. The substrate was removed by acid etching. The polycrystalline CVD films were composed of randomly oriented grains, thus resulting in ‘‘powder-pattern’’ ESR spectra. About 50 polycrystalline diamond samples have been studied, however, most of the reported ESR spectra were recorded on two representative samples, 1 and 2. Both were nominally undoped good-quality films about 0.2 mm in thickness. For a part of sample 1, a thin (⬃20- m) layer was mechanically polished from the substrate 共siliconrich兲 side of the film in order to reveal possible Si-related defects. Some samples were irradiated at nominally room temperature by fast 共⬎1 MeV兲 neutrons at the Research Reactor of Moscow Engineering Physics Institute. Sample 3 is a 具 100典 -oriented monocrystalline CVD diamond film, which has been deposited by dc plasma CVD on a 具 100典 -oriented Ir substrate. The substrate was removed after deposition leaving a freestanding diamond layer of ⬃6 ⫻4⫻0.03 mm3 in size. A detailed description of sample preparation has been reported elsewhere.7 All samples were cleaned in a boiling mixture of nitric, fluoric, and perchloric acids and, finally, in acetone prior to measurements. ESR spectra were recorded using a commercial Q-band Bruker 共microwave frequency f ⬃33 GHz) setup and a K-band ( f ⬃20 GHz) homebuilt spectrometer at temperatures in the range 10–300 K. The g values and absolute intensities of ESR signals were determined using a thoroughly calibrated8 LiF : Li standard comounted with the studied sample. The absolute accuracy of the reported concentrations is estimated as 50%, while the accuracy of relative concentrations is about 20%. In order to identify the spectral lines an extensive simulation of the powder-pattern ESR spectra was performed using the computer code EPR. FOR provided by J. Weil. All spectra presented in this work were recorded at room temperature. ESR measurements with in situ illumination were performed at the Q band using a 457.9-nm continuous-wave Ar⫹ laser, providing a light intensity ⬃2 W/cm2 at the sample. The weakness of the photoinduced changes in our samples precluded spectrally resolved ESR measurements. Illumination of a thin (⬃1- m) surface layer was performed ex situ, using a low-pressure Kr lamp, which provides most
of its output in the 10-eV line 共intensity ⬃2 mW/cm2 ). In order to reduce the atmospheric absorption, the samples were placed on top of the MgF2 window of the lamp. III. EXPERIMENTAL RESULTS AND ANALYSIS A. ESR spectra 1. KUL1 and KUL2 centers
Figure 1 presents first-derivative Q-band ESR spectra from CVD diamond sample 1, in the as-grown state and after polishing. The high-field spectra (g⬃2), recorded using P ⫽0.5 W and modulation amplitude B m ⫽0.2 mT, are shown on the right side. The half-field spectra, recorded with P ⫽1.5 mW and B m ⫽0.02 mT, are presented on the left side. Note that the arbitrary scales are different for the left and the right sides of the spectra. No other signals were observed in the range of magnetic field 0.2–1 T. The highfield spectra exhibit a nearly perfect inversion symmetry with respect to their center (⬃1209 mT, g⬃2.002) and thus only their low-field parts are shown. The high-field part of the as-grown sample is dominated by two four-line spectra associated with the KUL1 and KUL2 centers. Their asymmetric derivative line shape, with the predominant positive part, is characteristic for powderpattern S⫽1 or S⫽ 23 centers. Note that asymmetric derivative line shapes are also common for powder-pattern spectra of S⫽ 12 centers exhibiting anisotropic g or/and A matrices, but in that case the negative part is predominant 关see Fig. 5共a兲, which is discussed below兴. As to S⫽ 23 centers, which are not unusual in nitrogen-containing diamond,9 their spectra exhibit strong central lines of certain intensity and position. Such signals were observed neither for the KUL1 nor KUL2 center and therefore the S⫽1 value is assigned to these centers. This assignment is further strongly supported by the presence of a single component in the half-field spectra of the KUL1 and KUL2 centers. Two weak signals are observed near the two largest highfield KUL2 signals in Fig. 1; the latter corresponds to allowed ⌬S⫽1 transitions. Magnification of the spectrum 共not shown兲 reveals that the former signals constitute the two ⌬S⫽1 lines of another S⫽1 center, which was identified as the W15 center. This center was previously assigned10 to a
TABLE I. Parameters 共300 K兲 of observed ESR centers. g 1 is parallel to the defect axis. D is the absolute value of the zero-field constant. For the KUL1, KUL2, and W15 centers the non-axial zero-field splitting constant E⬍0.1 mT. C is the maximum concentration observed. ⌬B p p here is the smallest observed peak-to-peak linewidth of allowed transitions. P sat represents the lowest value of P at which a significant (⬎20%) broadening of the corresponding ESR signal occurs (Q band, Q factor ⬃1500). Center
S
g1
g2
g3
P1 KUL1 KUL8 KUL2 KUL9 W15 H1
1 2
2.00216共1兲 2.0040共1兲 2.00368共3兲 2.0026共1兲 2.00262共2兲 2.0026共2兲 2.00270共3兲
2.00216共1兲 2.0035共1兲 2.00336共3兲 2.0026共1兲 2.00262共2兲 2.0022共2兲 2.00270共3兲
2.00216共1兲 2.0035共1兲 2.00336共3兲 2.0026共1兲 2.00262共2兲 2.0022共2兲 2.00270共3兲
1 1 2
1 1 2
1 1 2
195207-2
D 共mT兲 35.8共4兲 96.5共5兲 102.8共5兲
C 共ppm兲
⌬B p p 共mT兲
P sat ( W)
100 0.3 0.01 10 0.02 1 100
0.01 0.22 0.03 0.1 0.02 0.2 0.5
1 300 5 5 500 1 105
PHYSICAL REVIEW B 66, 195207 共2002兲
CHARACTERIZATION OF HYDROGEN AND SILICON- . . .
FIG. 1. First-derivative Q-band ESR spectra 共300 K兲 from CVD diamond sample 1, in the as-grown state and after polishing. The high-field spectra 共right side兲 were recorded using P ⫽0.5 W and B m ⫽0.2 mT. The half-field spectra 共left side兲 were recorded at P ⫽1.5 mW and B m ⫽0.02 mT. Note that the arbitrary scales are different for the left and right sides. The high-field spectra exhibit a nearly perfect inversion symmetry with respect to their center (⬃1209 mT, g⬃2.002) and thus only the their low-field parts are shown. The bottom line presents a fit produced using the parameters listed in Table I.
nearest-neighbor pair of a substitutional nitrogen atom and a negatively charged vacancy ( 关 NS -V 兴 ⫺ ). Two prominent features are observed in the half-field spectra shown on the left side of Fig. 1. They were associated with forbidden ⌬S⫽2 transitions at the KUL1 and KUL2 centers based on the results of fitting the positions and line shapes of the ⌬S⫽2 peaks, using the spin-Hamiltonian parameters derived from simulation of the ⌬S⫽1 lines. This assignment is further confirmed by the correlating intensities of the principal and half-field signals, observed over different samples, with and without illumination. The bottom curve in Fig. 1 presents optimized simulation of the experimental spectrum for the as-grown sample 1. The shape of the half-field doublet line of the KUL2 center could only be fitted if assuming hf interaction with one I⫽ 21 共hydrogen兲 nucleus. The parameters inferred from fitting are
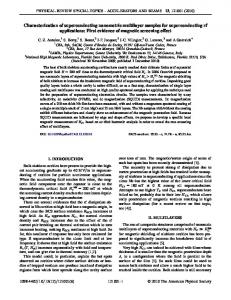
FIG. 2. An angular map of the positions 共squares兲 of the ⌬S ⫽1 lines at the KUL1 center, measured for the monocrystalline CVD diamond sample 3 共300 K, Q band兲. The lines present a simulation, computer generated using the parameters of Table I.
summarized in Tables I and II. It should be mentioned, though, that any combination of the hf parameters complying with 兩 A 1 ⫹A 2 ⫹A 3 兩 ⫽0.18 mT resulted in the same successful fit of the KUL2 half-field spectrum. Therefore, in order to better resolve the hf parameters, hf structure was searched for near the principal (⌬S⫽1) KUL2 lines. The smallest principal lines were observed to be split by 0.1 mT, as shown by the inset in Fig. 1. However, no splitting could be observed for the strongest ⌬S⫽1 KUL2 lines, not even in the samples with the smallest peak-to-peak linewidth ⌬B pp ⫽0.1 mT. Assuming axial symmetry of the hf interaction matrix, the hf parameters could then be deduced as A 1 ⫽0.1 mT, and A 2 ⫽A 3 ⫽0.04 mT. Figure 1 reveals that polishing of the substrate side of sample 1 strongly reduces the intensity of the KUL1 center, but not of the KUL2 and W15 centers. An important detail is that no new ESR, absorption, or PL centers were introduced by the polishing. Also, no significant change in the Fermilevel position occurred, as monitored by the ratio of the 关 NS -V 兴 ⫺ and 关 NS -V 兴 0 luminescence signals.11 An interesting observation is that apart from CVD diamond films, the ⌬S⫽1 and ⌬S⫽2 peaks of the KUL2 spec-
TABLE II. Hyperfine parameters for selected impurity-vacancy ESR centers in Si and diamond. Here, a and b are the isotropic and anisotropic hf constants, respectively; a⫽(A 1 ⫹A 2 ⫹A 3 )/3; r is the distance between the unpaired electron and the impurity, calculated from ESR data 共point-dipole approximation兲. r es represents the same distance, but now estimated from geometrical considerations 共no lattice relaxation兲, with Si-H and C-H bonds pointing along a 具 111典 axis and having lengths of 0.15 and 0.1 nm, respectively. The accuracy on all the values is ⬃20%. Pw indicates present work. Material
Center
Proposed assignment
a 共mT兲
b 共mT兲
r 共nm兲
r es 共nm兲
Reference
Si Diamond Si Diamond Diamond Diamond Si
S1 H1 S1a KUL9 KUL2 W15 G9
关 H-V 兴 0 关 H-V 兴 0 关 H-2V 兴 0 关 H-2V 兴 0 关 H-2V 兴 ⫺ 关 NS ⫺V 兴 ⫺ 关 AlS ⫺V 兴 ⫺
0.007 0.18 0.23 0.040 0.06 0.078 1.65
0.15 0.4 0.027 0.08 0.02 0.0023 0.017
0.27 0.19 0.47 0.32 1.12 0.56 0.60
0.28 0.17 0.46 0.30 0.30 0.25 0.38
12 1 12 Pw Pw 10 13
195207-3
PHYSICAL REVIEW B 66, 195207 共2002兲
K. IAKOUBOVSKII AND A. STESMANS
FIG. 3. The central parts of the ESR spectra of Fig. 1 recorded using P ⫽1 W and B m ⫽0.02 mT 共300 K, Q band兲. Solid and dashed arrows mark the allowed ⌬m⫽0 13C hf lines and forbidden ⌬m⫽1 14N hf lines, respectively.
trum were also observed in diamond powders,2 grown by the proprietary high-pressure high-temperature 共HPHT兲 technique, using a Mn/Ni catalyst, at the following conditions: pressure p⬃4.5 GPa, T⬃1200 °C, and growth time ⬃1 min. The concentration of the KUL2 centers in those powders was at the atomic parts per billion level. The KUL1 center was also detected in the monocrystalline CVD diamond sample 3. Figure 2 presents an angular map of the positions of the ⌬S⫽1 lines for the KUL1 center, which is unique for a trigonal center. The lines in Fig. 2 are a simulation, computer generated using the parameters of Table I. Remarkably, the same parameters were obtained from fitting the powder-pattern and single-crystal spectra of the KUL1 center. 2. KUL8 and KUL9 centers
The central parts of the high-field ESR spectra of sample 1, in the as-grown state and after polishing, can be seen in more detail in Fig. 3. The spectra are dominated by the S ⫽ 12 center P1 exhibiting the overshooting central line and prominent satellites at ⬃1206.1 and 1212.0 mT. The satellites correspond to the allowed ⌬m⫽0 transitions originating from hf interaction of the unpaired electron with one 14N nucleus. Solid and dashed arrows mark the allowed ⌬m ⫽0 13C hf lines and forbidden ⌬m⫽1 14N hf lines, respectively. Along with a previously reported2 KUL6 center, two undocumented spectra, labeled KUL8 and KUL9, are also observed. Figure 3 reveals that polishing of the substrate side of sample 1 strongly reduces the intensity of the KUL8 center, but not of the P1 and KUL6 centers. Figure 4 depicts a variation of the spectrum of Fig. 3 from the as-grown sample 1, recorded at a higher microwave power ( P ⫽0.1 mW), at two different frequencies. In order to facilitate the comparison, the spectra are offset by 1208.8 mT for the Q-band spectrum 共bottom curve兲 and by 731.7 mT for the K-band spectrum 共top curve兲. The high level of applied microwave power results in saturation of the P1 and KUL8 centers. The KUL9 central line exhibits two weak
FIG. 4. The central part of the room-temperature spectrum from the as-grown sample 1, recorded at elevated microwave power ( P ⫽0.1 mW) in the Q band (B m ⫽0.03 mT) and K band (B m ⫽0.07 mT).
satellites, spaced by 3.8 mT in the Q-band and by 2.4 mT the K-band spectra, the splitting corresponding to twice the proton nuclear-magnetic-resonance frequency. The intensity of the satellites is ⬃2.5-times higher in the K-band spectrum, as expected for the forbidden hf lines, whose intensity decreases1 with microwave frequency as f ⫺2 . Therefore, the satellites can be assigned to forbidden ⌬m⫽1 hf transitions involving one hydrogen atom. After subtraction of underlying signals in Fig. 3, a detailed view of the KUL8 and KUL9 spectra could be obtained, as shown in Fig. 5. The shape of the KUL8 spectrum 关Fig. 5共a兲兴 is characteristic of an axially symmetric S⫽n/2, n⫽1,3,5, . . . center, however, the small linewidth favors the
FIG. 5. A detailed view 共300 K, Q band兲 of the KUL8 共a兲 and KUL9 共b兲 spectra. Lines present simulations generated with different models 共see text for details兲.
195207-4
PHYSICAL REVIEW B 66, 195207 共2002兲
CHARACTERIZATION OF HYDROGEN AND SILICON- . . .
TABLE III. Influence of 457.9-nm illumination on ESR concentrations 共in atomic parts per billion兲 of some of the observed defect centers. Sample
Condition
P1
H1
KUL1
KUL2
KUL6
KUL8
KUL9
1 1 2 2
dark 457.9 nm dark 457.9 nm
1000 1300 170 230
1000 1000
20 16 10 8
200 200 45 60
800 800 30 40
4 9 2 5
20 10
S⫽ 12 assignment: CVD diamond is known to suffer from large strain. Strain can affect the distances between the unpaired electrons at high-spin centers, thus resulting in significant line broadening2 共see also Table I兲, which is not observed for the KUL8 center. The bottom line in Fig. 5共a兲 presents a simulation generated using the parameters of Table I. Several S⫽ 21 models have been considered when simulating the line shape of the KUL9 center. For all of them, in order to account for the stretched central line, it was necessary to set the anisotropic Gaussian linewidths ⌬B 1 ⫽0.02 mT, and ⌬B 2 ⫽⌬B 3 ⫽0.03 mT. The simulation curves for the most successful models are presented in Fig. 5共b兲, while the model parameters are listed below. Model 1 共curve fit 1兲: isotropic g⫽2.002 62, hf interaction with one I⫽ 21 nucleus, A 1 ⫽0.20 mT, and A 2 ⫽A 3 ⫽ ⫺0.04 mT. Model 2 共curve fit 2兲: the same g and hf interaction pattern as model 1, but A 1 ⫽0.20 mT, and A 2 ⫽A 3 ⫽0.01 mT. Model 3 共curve fit 3兲: g 1 ⫽2.002 46, g 2 ⫽2.002 62, g 3 ⫽2.002 78, and no hf interaction. All these models successfully simulate the shape of the satellites of the KUL9 spectrum. However, a satisfactory fit of the central line is only achieved with model 1, which is therefore selected for further analysis 共Table II兲. Finally, with regard to KUL9, we address an observation made on neutron-irradiated samples. Annealing the irradiated samples at temperatures above 600 °C, which correspond to annealing out of isolated vacancies in diamond, resulted in the appearance of the KUL9 signals in samples, which showed no KUL9 signals prior to irradiation. The KUL9 spectra produced by irradiation and annealing were identical to those presented by curve 1 in Fig. 5共b兲. The ⌬B pp , A, g, and D values of all observed ESR signals were found to be temperature independent in the range 10–300 K, except for the reported linear increase in D with temperature for the KUL1 center.2 B. Effect of illumination, nitrogen doping, and annealing on the observed ESR spectra 1. KUL1 and KUL8 centers
Measurements on a large series of samples reveal that the intensity of the KUL1 and KUL8 signals is the strongest in the samples with the largest surface area, but not with the largest volume, suggesting those centers to be surface related. In order to identify that surface, the subsurface regions 共a few micron deep兲 at the substrate side and at the growth
side of CVD films were either polished away or illuminated by strongly absorbed 10-eV light. Both treatments altered the intensity of the KUL1 and KUL8 signals when applied to the substrate 共Si-rich兲 side, but not to the growth 共Si-poor兲 side 共see Figs. 1 and 3兲. This observation may suggest that the KUL1 and KUL8 are Si related. Additionally, optical-absorption measurements 共not shown兲 revealed that the polishing of the substrate side, but not of the growth side, of CVD films resulted in the disappearance of the 1.682-eV and 1.640-eV absorption lines.6 However, in contrast to what might be suggested, no correlation was found between the intensities of the KUL1 and KUL8, 1.682-eV and 1.640-eV centers in different samples with or without illumination. In order to examine the possible relations between the KUL1 and KUL8 centers, their intensity was monitored in different samples, with and without in situ illumination. Results for samples 1 and 2 and 457.9-nm illumination are summarized in Table III. It reveals that a reduction in the concentration of the KUL1 center is accompanied by an increase in the KUL8 concentration, such that the total concentration 共KUL1 ⫹ KUL8兲 remains almost constant. This result may be interpreted as the KUL1 and KUL8 centers corresponding to different charge states of one Si-related defect. In order to reveal the relative charge of those states, the concentration of the KUL1 and KUL8 centers were monitored in samples with different Fermi-level positions. The latter was varied by nitrogen doping, which raises3 the Fermi level in CVD diamond from ⬃E V ⫹1 eV towards ⬃E C ⫺1.7 eV level. An increase in the KUL8 and decrease in the KUL1 concentrations with nitrogen doping were observed, suggesting that the KUL8 center corresponds to the onemore-negative charge state of the KUL1 center. 2. KUL2 and KUL9 centers
The analysis of Figs. 1 and 5 reveals that both the KUL2 and KUL9 centers involve one hydrogen atom, and the corresponding hydrogen hf parameters are similar for those centers. Similar to the KUL1 and KUL9 centers, an examination of possible relations between the KUL2 and KUL9 centers was performed by illuminating samples 1 and 2 with 457.9-nm light 共see Table III兲. The results from sample 2 reveal that a reduction in the concentration of the KUL9 center is accompanied by an increase in the KUL2 concentration, thus suggesting that those centers correspond to different charge states of one hydrogen-related defect. The order of those charge states was again inferred from doping results: An increase in the KUL2 and a decrease in the KUL9
195207-5
PHYSICAL REVIEW B 66, 195207 共2002兲
K. IAKOUBOVSKII AND A. STESMANS
concentrations with nitrogen doping were observed, suggesting that the KUL2 center corresponds to the one-morenegative charge state of the KUL9 center. IV. DISCUSSION A. Si-related KUL1 center
The results of Sec. III B 1 suggest that the KUL1 center is Si related. Therefore, the third set of hf lines at the KUL1 center 共see the Introduction兲 can be attributed to one Si rather than four equivalent carbon cites, thus suggesting that the KUL1 center involves one Si atom. The trigonal symmetry deduced for the KUL1 center 共see Fig. 2兲 may suggest the assignment of this center to the VSiV 0 defect.4 There is, however, a contradiction between the high symmetry and the previously deduced2 number of equivalent carbon sites, which needs to be resolved for adequate modeling of the KUL1 center. B. Hydrogen-related centers KUL2 and KUL9
The experimental results of Sec. III A suggest that both the KUL2 and KUL9 centers involve one hydrogen atom. Using the inferred hf parameters, the distance between the unpaired electron and the hydrogen atom in the KUL9 center can be estimated as 0.32 nm 共see Table II兲. This distance is close to the one expected for a 关 H-V 兴 0 center. Therefore, we tentatively attribute the KUL9 center to the 关 H-2V 兴 0 complex. Consequently, the KUL2 center may be attributed to the 关 H-2V 兴 ⫺ defect based on observations of Sec. III B 2. Below, we provide evidence that this tentative assignment can explain the anisotropic linewidth of the KUL2 and KUL9 centers, as well as other ESR parameters of the KUL2 center. Regarding to the KUL2 center, we would like to point to a remarkable similarity between the ESR parameters of the W15 ( 关 NS -V 兴 ⫺ ) and KUL2 centers: They have very similar g and D values, the g values being close9 to that of the V ⫺ center 共2.0026兲. For both the KUL2 and W15 centers, the angle between the symmetry axes of the g and D matrixes could be estimated from computer simulations to be within a few degrees.2 Both centers,2 as well as the KUL9 center 关see discussion of Fig. 5共b兲兴, exhibit a narrower linewidth along the defect axis than the one perpendicular to it. The defect axis of the W15 center10 is 具 111典 . A possible explanation for the smaller linewidth along the defect axis could be found in the fact that diamond exhibits its largest elastic modulus and thus is most resistant to strain along the 具 111典 axis. If correct, and adopting the same mechanism of stress hardness for the KUL2 and KUL9 centers, one might suggest that the symmetry axis of the corresponding defect is also close or parallel to the 具 111典 direction, in agreement with the proposed H-2V model. Table II also presents the distances r between the unpaired electron共s兲 and the involved impurity for several impurity-
vacancy complexes in diamond and Si. It clearly shows that the point-dipole approximation cannot be used for the negatively charged impurity-divacancy defects, thus rendering the estimation of r H for the KUL2 center unreliable. Interesting is the observation that the KUL9 center can be formed by ion irradiation of CVD diamond, followed by annealing at temperatures in the range where vacancies become mobile. It is worthwhile to note that those temperatures are too low to induce changes related to the C-H bond rearrangements in hydrogen-related ESR and optical centers.1,2 A possible mechanism of the irradiation-assisted production of the KUL9 center may involve capture of vacancies by the hydrogen-vacancy 共presumable H1兲 centers, which were present prior to irradiation. It may be suggested that the KUL2 signals in the samples with different strain,2 and in our HPHT diamond powders, originated not from one, but from various defects containing a common V ⫺ core. However, the same pattern of the halffield line splitting 共see left side of Fig. 1兲 was observed for all the mentioned samples, ruling out this hypothesis. V. SUMMARY
Characterization of several ESR centers in diamond films grown by chemical vapor deposition is reported. Observation of the hf structure, combined with illumination and polishing treatments, suggests that the KUL2 and KUL9 originate from two charge states of one defect, containing a vacancy and an adjacent hydrogen atom. Similarly, the KUL1 and KUL8 centers appear to be two charge states of another defect, containing one Si atom. A trigonal symmetry was deduced for the KUL1 center from measurements on a single-crystal CVD diamond film. Results on the polishing of the substrate 共Si-rich兲 side of CVD films suggest that the opticalabsorption center at 1.640 eV and 1.682 eV may as well be Si related. However, no correlation was found between the intensities of the 1.640- and 1.682-eV lines and the KUL1 and KUL8 ESR centers. The KUL2 and KUL9 centers are tentatively assigned to the negative and neutral charge states of a hydrogendivacancy complex, respectively. It has been demonstrated that the KUL2 center can be formed by ion irradiation of CVD diamond followed by annealing at temperatures in the range at which vacancies become mobile. The mechanism of this process is suggested to involve capturing of a vacancy by a hydrogen-vacancy defect present prior to irradiation. ACKNOWLEDGMENTS
The authors are indebted to K. Suzuki, M. Nesladek, and O. M. Tyutyunnyk for provision of monocrystalline CVD film, polycrystalline CVD films, and HPHT diamond samples, respectively. We also want to thank N. N. Dogadkin and A. Shiryaev for reactor irradiation and the Belgian FWO for financial support.
195207-6
PHYSICAL REVIEW B 66, 195207 共2002兲
CHARACTERIZATION OF HYDROGEN AND SILICON- . . . *Electronic address:
[email protected] 1
X. Zhou, G.D. Watkins, K.M.M. Rutledge, R.P. Messmer, and S. Chawla, Phys. Rev. B 54, 7881 共1996兲. 2 K. Iakoubovskii and A. Stesmans, Phys. Status Solidi A 186, 199 共2001兲. 3 K. Iakoubovskii and G. Adriaenssens, Diamond Relat. Mater. 9, 1349 共2000兲. 4 J.P. Goss, R. Jones, S.J. Breuer, P.R. Briddon, and S. Oberg, Phys. Rev. Lett. 77, 3041 共1996兲. 5 K. Iakoubovskii, A. Stesmans, B. Nouwen, and G. Adriaenssens, Phys. Rev. B 62, 16 587 共2000兲. 6 K. Iakoubovskii and G. Adriaenssens, Diamond Relat. Mater. 10, 18 共2001兲. 7 K. Ohtsuka, K. Suzuki, A. Sawabe, and T. Inuzuka, Jpn. J. Appl.
Phys., Part 2 35, L1072 共1996兲. A. Stesmans and G.V. Gorp, Rev. Sci. Instrum. 60, 2949 共1989兲. 9 C. A. J. Ammerlaan, in Semiconductors, Impurities and Defects in Group IV Elements and III-V Compounds, edited by O. Madelung and M. Schultz, Landolt-Bo¨rnstein, New Series, Group III, Vol. 22, Pt. b 共Springer, Berlin, 1990兲. 10 J.H.N. Loubser and J.A. van Wyk, Rep. Prog. Phys. 41, 1201 共1978兲. 11 K. Iakoubovskii, G.J. Adriaenssens, and M. Nesladek, J. Phys.: Condens. Matter 12, 189 共2000兲. 12 P. Stallinga, P. Johannesen, S. Herstrom, K.B. Nielsen, B.B. Nielsen, and J.R. Byberg, Phys. Rev. B 58, 3842 共1998兲. 13 G.D. Watkins, Phys. Rev. 155, 802 共1967兲. 8
195207-7