Characterization of Wireless Accelerometer Sensor and Its Industrial Applications Satish Mohanty*, K. K. Gupta*, Kota Solomon Raju†, Vikrant Mishra†, Vipin Kumar† and P. Bhanu Prasad† *Birla Institute of Technology and Science, Pilani, Rajasthan, India Email:
[email protected], †Central Electronics Engineering Research Institute (CEERI)/ Council of Scientific & Industrial Research (CSIR) Pilani, Rajasthan, India
Abstract—The basic idea of this paper is to characterize wireless MEMS capacitive accelerometer sensor based on their field of applications. The selection of accelerometers are difficult for certain applications, that demands the sensor to be mount on rotating platform, higher value of g, sensitivity, and wide bandwidth of operation. Whenever higher sensitivity is chosen, the short fall is in the range of g and the bandwidth of operation. This is a serious issue with the sensor as far as industrial applications i.e., ball mill and sag mills are concerned. There is a misconception of using higher value of g (approximately around 500 g) with lower sensitivity in ball mill that is justified in this paper. Generally, the internal frequency of vibration of the ball mill is unknown, and the vibration due to impact during grinding is also random due to non uniformity in the grinding action inside the mill. For such an application, random selection of sensors can mislead the data acquisition and interpretation process. The perplexity of the application demands the characterization of accelerometer, when they are mounted on rotating platform. In this paper the sensor is characterized in mechanical testing lab using lathe machine and later on the same sensor is subjected to measure vibration of the industrial ball mill. Further, the data is transmitted using Zigbee (IEEE 802.15.4), and the RF signal losses during rotation and transmission are also taken care to avoid the high frequency losses due to multiple reflections. Finally, the vibration signatures obtained during experimental phases are analyzed using Fast Fourier Transform (FFT) to characterize the sensor at different operating speeds of the lathe machine.
Keywords— Vibration; Wireless Accelerometer Sensor; FFT
I.
INTRODUCTION
Sensors have broadened the scope to understand the natures and its phenomena. Characterizations of sensors are important before they are used for any application. The accelerometer sensors can be classified based on technology i.e., resistive (it includes-strain gauge, piezoresistive, micro-machined and thin-film), capacitive, fiber optics, servo balance, vibrating quartz and piezoelectric. The design and application of these sensors are different and it depends on the sensitivity and 978-1-4799-2361-8/14/$31.00 ©2014 IEEE
bandwidth requirement for a particular application. The sensors are used to study transient and dynamic characteristics of machines, position of mobile platform, vibration and tilt measurement in rockets, vibration measurement in ball mill, human motion measurements, earth quake measurements etc. Some of the sensors are meant only to monitor dynamic response (shock and vibration) and some are meant for both dynamic and static (tilt) response. The purpose of accelerometer sensor is to measure the vibration as well as tilt, but one cannot stop it to measure any other parameters (exist due to coriolis forces). Once design and fabrication of the sensor is done then it is characterized and validated [1, 2]. But, the characterization may not fit into the application of different users (Ball Mill and Sag Mill). For such applications, the sensor must be characterized independently before subjecting it into the real time industrial environment. This paper studies and investigates time and frequency response of the sensor under stable (least vibration) rotating environment using acquired vibration signature. When the sensor is subjected to rotation as well as external impact (during application phase), then the frequencies obtained would better be used to differentiate the effects due to rotation and vibration. A tri-axis wireless (Zigbee Based) sensors (ADXL 210, ±10 g range and sensitivity of 100 mV/g) [3] is used for the experimental verification of the sensor through signal processing means. After successful analysis of the vibration signals of the sensor, it is subjected to real time field testing in industrial ball mill to acquire impact signals. II.
PRINCIPLES OF CAPACITIVE ACCELEROMETER
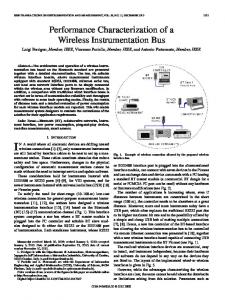
Capacitive accelerometer sensor consists of stationary fingers like structure placed inside the proof mass attached to the spring of particular stiffness as shown in the Fig 1. The proof mass and the stiffness of the spring will decide the sensitivity and band width of the sensor and they are inversely related to each other. As the air gap changes the capacitance changes and results a change in output voltage of the differential amplifier [4]. The sensitivity and the frequency [3] of the accelerometer are as given in Equations (1) and (2)-
Sensitivity=1/Applied acceleratiion
(1) (2)
Where f is resonance frequency of structurre, C1 and C2 are the capacitances of air gaps, ΔC = C1 - C2, k is stiffness of spring and m is the mass of proof mass. The mathematical expression for the callculation of the acceleration for different value of dissplacement and frequency in shown in Equation (3)
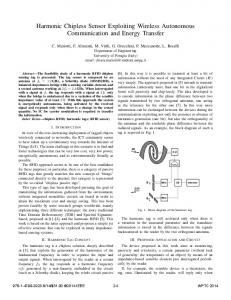
shown in Fig. 3a and wireleess receiver is connected to a PC. The X, Y & Z channelss of the sensor are the axial, tangential & radial componeents respectively as shown in Fig. 4. Step-2: Signals are acqquired at eight different tilt angles as marked in Fig. 3b. Step-3: The signals are acquired a with different speeds (rpm) as given in Table I. The data acquired from thhe sensor is transmitted to the receiving node using Zigbee..
(3) Where g is acceleration due to gravityy and x is the displacement. The moment of the proof mass off the sensor can be realized as a stiff mass moving up or o down due to actual internal weight, and it is the basic reeason that gives rise to the change in the value of the sensoor form ±1g.The acceleration due to gravity for positionall change in the sensor is shown in Fig. 2 and is expressed in Equation (4)
( (a)
a=gsinθ (4) Where a is acceleration due to gravityy, Ө is angular change from the reference ground and g is 9.81(1g). Stationaryy Fingers Anchor to Substrate
(b)
Flexible spring legs
Fig. 3.a) Experimental setup at tilt angles b) axial direction of different channels of wireless MEMS M capacitive sensor
Inertia mass
Fig. 1. Capacitive MEMS accelerometerr sensor
Fig. 4. Direction of chaannels in dynamic states TAB BLE I. DIFFERENT RPM AT DYNAMIC AND A ANGLES AT STATIC STATES
Fig. 2. Capacitive MEMS accelerometer sensor acctual motion on tilt
III.
METHODOLOGY
3.1 Experimental setupThe sensor mounting and signal acquisitioon procedure are as follows Step-1: The Zigbee based wireless acccelerometer [5 7] is mounted on to the spindle of the laathe machine as
RPM
26
45
65
140
180
240
299
350
Tilt Angle
0
45
90
135
180
215
270
315
IV.
RESULTSS AND ANALYSIS
Initial experiments are perfoormed to validate the changes in g value due to change in position p of the channels (X, Y and Z). These experiments are a performed to describe the nature of the vibration alongg the three different planes of the sensor.
A. Results and analysis at eight different tilt angles The initial experiments are conducted with sensor mounted on to the static lathe at different angular positions as tabulated in Table I. The g value obtained at eight different angular positions is as shown in the Fig. 5. The main goal of the tilt analysis is to study the change in the value of g as well as the dominant frequencies produced during tilt. 1 X CH Y CH
0.5
g, m/sec2
Z CH
B. Results and analysis at eight different rotating rpm
0
The dynamic studies of the accelerometer are performed at eight different speeds. The speed parameters are given in the Table I. It is easy to predict the accelerometer sensor behavior under static conditions, but the response under rotating environment is quite perplexed. The response of X, Y, Z channels is acquired at different speeds and the corresponding frequency analysis is performed. The amplitude and frequency response are obtained for different speeds. The Fig. 7 shows the time and frequency domain response of the signal at 240 rpm.
-0.5
-1
-1.5 0
50
100
150
200
positions, where as the response of the channel Z is quite high and is approximately 400Hz (response of X channel is close to zero). The response is due to the change in capacitance, as it more along Z channel i.e., as the proof mass inside the sensor starts moving from the main reference plane, the capacitance decreases along the Z direction. The frequent moment of the Z channel gives rise to higher frequency and the pattern is almost sine pattern with net change between ±1g i.e., the sensor is operating under stable condition with respect to the reference or dc offset.
250
300
350
Angular positions (Degree)
Fig. 5. g values of sensor at different angular positions
Experiments are performed for variable operating speeds of the lathe machine, and later on the time domain graphs are obtained. The highest intensity level for each time domain graph are collected for variable speeds and are plotted as shown in Fig. 8.
450 X CH
400
Y CH Z CH
Frequency (Hz)
350 300
250
0.05 Channel X 0 )
200
-0.05 -0.1 -0.15 -0.2
150 0
50
100
150
200
250
300
0.5
350
Angular positions (Degree)
1
1.5
2
2.5
3
1
g, m/sec2
Channel Y
Fig. 6. Frequencies at eight different angular positions
0.5 g 2
0
-0.5
-1
The acquired time domain signal is transformed to its frequency domain using FFT as in Equation (5)
-1.5 0
0.5
1
1.5
2
2.5
3
Channel Z
5.5
5
2/
|
/
|
(5)
4.5
4
Where N is the number of sample points, x is the input signal and X is the output coefficient at different frequencies. Frequency response of the sensor for different angular positions is as shown in Fig. 6.
0.5
1
1.5
2
2.5
3
Time(sec)
(a) Channel X
-20 -40
The Fig. 5 depicts that the response of the X channel is constant for different angular positions, while the response of the Y and Z channels are getting changed. When the angular position of the sensor changes, the radial and tangential components are getting changed, but the response of X channel remains constant, as it is along the axis of the lathe machine. The phase transition occurs, when only when the acceleration is converted to retardation (for channels Y and Z). The phase changes at 180o, but the amplitude response of the sensor for forced free vibration is within ±1g range. Fig. 6 clearly predicts the frequency response of channel Y is around 200 Hz for different values of angular
-60 -80 -100 0
100
200
300
400
500
600
0
P S D
Channel Y
-20 40 -60 -80 -100 100
200
300
400
500
600
Channel Z 0
-50
-100 0
100
200
300
Frequency (Hz)
400
500
600
(b) Fig. 7. a) Time response and b) frequency response at 240 rpm
w produce two different due to tilt and rotation will frequencies i.e., frequency due d to tilt and frequency due to rotation. Whenever impacct loading frequency is to be identified, it should be different from these two frequencies irrespective of thhe change in the g values and their intensities. The justificcation for this is detailed in the application in industrial ball b mill.
15 X CH g, m/sec2
10
Y CH Z CH
5 0 -5 0
V. 50
100
150
200
250 0
300
R.P.M (rev/min.)
Fig. 8. g value of sensor at different speeeds 6 X CH Y CH Z CH
Frequency (Hz)
5 4 3 2 1 0
0
50
100
150 200 R.P.M (rev/min.)
250 0
300
350
Fig. 9. Frequencies of sensor due to differeent speed
d speeds The time domain signals obtained at different are transformed to its respective frequencyy domain using FFT. The frequencies obtained at differennt speed consist of internal vibration frequency of the sensors as well as the speed at which it is rotating. The variabble frequencies obtained are shown in the Fig. 9. v signal The main objective is to separate the vibration due to rotation and the signal due to im mpact (external force applied on to the system) It is observed from the Fig. 8, thatt the response of the sensor to the change in g is minimaal for channel X at different speeds. The response of thee channel Y is quite stable, but the response of the chhannel Z over shoots the 10 g range and the signal getss clipped when the operating speed of the lathe is arounnd 350 rpm. It quite obvious that the responses for all the channels are quite significant below 140 rpm, buut it changes drastically for Z channel. Time domain analysis a justify that the change in g value for all the channels c fall in between ±1g, and is well below 140 rpm m without any impact loading. It can be concluded that the sensor can be used below 140 rpm with external force applied on to it. The impact loading and the g value thee sensor should match in the selection of the sensors for vibration measurement. Different values of frequencies obtained for variable speed of the lathe machine is plootted in Fig. 9. The angular rotational speed is getting reeflected equally along X, Y and Z channels. It increases as a the value of rotation increases as in Equation (6). k=rpm/60 Where k is the spindle rotating frequency
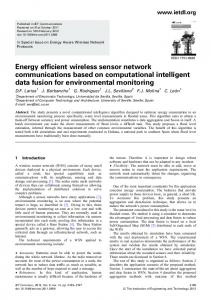
APPLICATION IN INDUSTRIAL BALL MILL
350
The impact analysis in baall mill is very important for product quality. An acceleerometer sensor is used to monitor the vibration due too impact in ball mill [8, 9]. The industrial ball mill is i shown in Fig. 10, and specifications are tabulated in II. The sensors are mounnted at different position of the ball mill as shown in red mark. The Zigbee transmission becomes inefficcient if the data is transmitted directly from surface mounnt sensors. The packet losses are more as the diameter of the ball mill is more, and the contact time between transsmitter and receiver is less during rotation. The transm mission losses are avoided by mounting the transmitter of the t sensors on the side wall of the mill as shown in the Fig. 10. TAB BLE II.
PARAMETERS OF IND DUSTRIAL BALL MILL Parameters
Value
Feed type Feed rate Feed size Diameter of mill Length of the mill R.P.M Ball diameter Pulp density
Copper ore 110-130MT/Hr -6mm 11.6 Ft (3.5 m) 18 Ft (5.49 m) 17.47 65 mm 75% ore & 25% water
(6)
Finally, it can be concluded from both tilt and variable angular position experiments thatt, the vibration
Fig. 10. Position of accelerom meter sensors on industrial ball mill
intensities are well within the range of the sensor. It can also be observed that the settling time of the proof mass of the sensor is much less than the impact loading time ( if settling time is too high, then there will be a dc offset with almost null zero crossing in the signal acquisition); this is a measure achievement in faithful signal acquisition. It shows that the sensor can be used to measure external vibration due to impact well below 140 rpm with significant intensity level well below ±10g for the specified ball mill.
10 Z 8
Amplitude g, m/sec2
6 4 2 0 -2 -4
ACKNOWLEDGEMENT
-6 -8 90
100
110
120
130 140 150 Sample Number
160
170
180
190
We wish to thank the Director CEERI, Pilani and the staff members of Digital Systems Group for their kind support to make these experiments successful.
(a)
REFERENCES Z
|MAGNITUDE| g, m/sec2
0.12
0.1
0.08
0.06
0.04
0.02
100
200
300
400
50
600
700
800
900
1000
Frequency (Hz)
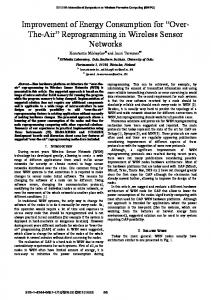
(b) Fig. 11 a) Time and b) Frequency response of ball mill
Fig. 11 shows the time and frequency domain graph of the ball mill obtained from the sensor after signal analysis. Fig. 11(a) shows that the change in g value due to high impact loading fall well below ±10g (data range is in between ±8g) and the signal is clipped free. Frequency domain signal obtained after FFT is shown in Fig. 11(b). The signal obtained from the ball mill is generally nonstationary in nature, but the non stationary signal is converted to stationary by matching the sampling rate of the sensor with rpm of the ball mill. The same result can be produced using empirical mode decomposition technique in [10] for higher resolution in the spectral analysis. It is observed from the Fig. 11(b) that the intensity after complex signal separation is around 0.13g and the frequency is around 240 Hz (the frequency due to impact loading is different from that of frequency obtained during tilt and rotation of the lathe machine). VI.
CONCLUSION
The sensor is characterized for different tilt angles and rpm of rotary system. The sensor results are validated in lab experiment setup (lathe machine) and further validated for ball mill application. The stable operating condition of the ball mill with impact forces, which contribute to the change in frequency and
[1]
A. Beliveau, G. T. Spencer, K. A. Thomas and S. L. Roberson, "Evaluation of MEMS capacitive accelerometers," IEEE Design and Test of Computers, vol. 16, no. 4, pp. 48-56, 1999. [2] I. Frosio, F. Pedersini and A. Borghese, “Auto calibration of tri axial MEMS accelerometer with automatic with sensor model selection,” IEEE Journals on Sensors, vol. 12, no. 6, pp. 21002108, 2012. [3] ADXL data sheet and product information from analog devices and basic of acceleration measurement. Available: http://www.analog.com/static/importedfiles/data_sheets/ ADXL210E.pdf http://www.mfpt.org/PDFs/MFPT%2059%20%20ACCELERATI ON%20MEASUREMENTS%20SESSION%204-1905_comp.pdf [4] T. K. Sethuramalingam and A. Vimalajuliet, "Design of mems based capacitive accelerometer," International Conference on Mechanical and Electrical Technology, pp. 565 - 568, Singapore, Sept. 2010. [5] K. C. Wang, L. Tang and Y. Huang, “Wireless sensor on rotating structures performance evaluation & radio link characterization," ACM, Wintech, Montreal, Canada, 2007. [6] L. Tang, K. C. Wang and Y. Huang, "Performance evaluation and reliable data transmission for wireless sensors on rotating mechanical structures", Structural and Health Monitoring, Sage Publication, 2009. [7] J. Y. Jung and J. W. Lee, "Zigbee device access control and reliable data transmission in Zigbee based health monitoring system,” International Conference on Advanced Communication Technology, pp. 795-797, 2008. [8] V. Upendranth, S. Mohanty, J. L. Raheja, K. S. Prasad and P. Bhanuprasad, "Autotracking the behaiour of ball mill using wireless sensor," International Seminar on Mineral Processing Technology, IMMT, Bhubaneswar, 2009. [9] P. Huang, M. Jia and B. Zhong, "A study on the technique of measuring the fill level based on the vibration signal of the ball mill shell," World Congress on Computer Science and Information Engineering, 2009. [10] S. Mohanty, K. K Gupta, K. S. Raju, A. Singh and S. Snigdha, "Vibro acoustic signal analysis in fault finding of bearing using empirical mode decomposition," IEEE International Conference on Advance Electronic Systems, pp. 29 - 33, 21-23 Sept. 2013.