assessed the sensitivity of the Köppen classes to long-term climate change on the .... In South America positive trends occur for temperate C and tropical A ...
CHARACTERIZING GLOBAL CLIMATE CHANGE BY MEANS OF KÖPPEN CLIMATE CLASSIFICATION Christoph Beck1, Jürgen Grieser1, Markus Kottek2, Franz Rubel2 and Bruno Rudolf1 1
Global Precipitation Climatology Centre, Deutscher Wetterdienst, Kaiserleistr. 44, 63067 Offenbach, Germany 2
Biometeorology Group, University of Veterinary Medicine, Veterinärplatz 1, 1210 Vienna, Austria
INTRODUCTION Global climate classifications were originally constructed in order to designate the manifold existing local climates to an adequate number of climate types and to determine the spatial distribution of these types on the basis of climatic data for a reference period. Thus, climate classifications are introduced in order to reflect the mean spatial climate characteristics. However, the underlying climate variables are subject to temporal variations and so are the results of climate classifications. Therefore climate classifications may not only be used to determine the mean state of the climate. They can also be utilized to analyse global and regional scale climate variations by applying them to varying time periods. Spatio-temporal variations of climate types resulting from effective climate classifications do not only reflect modifications of climatic parameters. By definition they are closely linked to different environmental conditions (e.g. vegetation) and therefore they may moreover be used for investigating the potential impact of past, present and projected future climate change on environmental systems. Varying aspects of global and regional climate change have been investigated on the basis of the well-known climate classification according to Köppen (e.g. Köppen 1936, Geiger 1961) by several authors. Fraedrich et al. (2001) analysed the shifts of modified Köppen climate types on a global and continental scale during the 20th century, Grieser et al. (2006) compared the results of a Köppen classification applied to gridded data from the periods 1951 – 1975 and 1976 - 2000. Focusing on a more regional perspective Suckling and Mitchell (2000) investigated variations of the boundary between the Köppen C and D climates in the Central United States and Wang and Overland (2004) analysed arctic climate change during the 20th century on the basis of a modified Köppen classification. Triantafyllou and Tsonis (1994) assessed the sensitivity of the Köppen classes to long-term climate change on the basis of long station time series. By applying the Köppen classification to the output of general circulation models (hereafter GCM) Guetter and Kutzbach (1990) estimated the main characteristics of glacial and interglacial climates, Kalvova et al. (2003) compared the results of Köppen classifications applied to several 20th century observational data sets and varying GCM outputs and Lohmann et al. (1993) used the Köppen classification to validate GCM control runs and as well to analyse scenario runs concerning spatio-temporal variations of climate types. In this contribution the spatio-temporal climate variations during the second half of the 20th century are investigated on global and continental scale by applying the Köppen climate classification to monthly precipitation and temperature data available from two most recently constructed globally gridded data sets (Mitchell and Jones 2005, Beck et al. 2005).
DATA AND METHODS Monthly temperature and precipitation data for the period 1951 - 2000 Monthly mean temperatures and monthly precipitation sums have been taken from the CRU TS 2.1 data set (Mitchell and Jones, 2005) provided by the Climatic Research Unit (CRU, University of East Anglia, Norwich, GB) and the VASClimO v1.1 data set (Beck et al. 2005) available from the Global Precipitation Climatology Centre (GPCC, Deutscher Wetterdienst, Offenbach, Germany) respectively. Both data sets cover the analysed period from 1951 – 2000 and provide data for the global land areas on a 0.5° by 0.5° lat./lon. grid. Due to insufficient station densities Greenland and Antarctica are not included within the VASClimO precipitation data set (Beck et al. 2005) and therefore these regions are also excluded from the analyses presented here. The same data base has also been used for applications of the Köppen climate classification on the basis of state of the art data sets most recently performed by Kottek et al. (2006) and Grieser et al. (2006). The Köppen climate classification Most global climate classifications are so called effective classifications which use threshold values (mostly of monthly temperature and precipitation data) based on environmental characteristics (e.g. vegetation) for the definition of boundaries separating different climate types. Probably the most prominent effective classification is the classification scheme according to Köppen (1936) that is based on the characteristics of the mean annual cycle of temperature and precipitation. Threshold values utilizing these climatic parameters have been defined in order to designate climate types that reflect major environmental characteristics (i.e. the 10° C isotherm of the warmest month in the year as indicator for tree growth). The resulting five major climate types according to Köppen (1936) designated by capital letters are: -
Tropical rain climates (A) – where the mean temperature of the coldest month exceeds +18.0°C.
-
Arid climates (B) – are defined as follows on the basis of the average annual precipitation sum R (cm) and the annual mean temperature T (°C): R < 2T + 28 (where summer rain is dominating) R < 2T +14 (where no pronounced annual cycle is observed) R < 2T (where winter rain is dominating)
-
Temperate rain climates (C) – where the mean temperature of the coldest month is between –3.0°C and +18.0°C.
-
Boreal forest and snow climates (D) – are characterized by a mean temperature of the warmest month exceeding 10.0°C and a mean temperature of the coldest month below –3.0°C.
-
Cold snow climates (E) – are defined by a mean temperature of the warmest month below 10.0°C.
A further subdivision of these five main types concerning further parameters representing temperature and precipitation conditions leads to subtypes designated by two resp. three letter codes (e.g. Cf – where f indicates humid conditions throughout the year, and Cfa – where a indicates hot summer conditions). In this paper the presentation of results is restricted to the five main Köppen types described above. A more comprehensive overview on the Köppen classification can be found for example in Kraus (2001). Analysing spatio-temporal variations of Köppen climates In order to investigate the spatiotemporal variations of Köppen climate types during the 1951 – 2000 period the classification scheme has been applied to monthly mean values determined for sliding 15-year intervals, as has been proposed by Fraedrich et al. (2001). For each of these 36 intervals (indicated by the respective central year) the areas that are designated to each Köppen climate type have been calculated and continuous time series of the varying relative area (percentage of the global resp. continental land area excluding Greenland and Antarctica) occupied by the certain types have been obtained. For each 15-year interval its similarity to the classification results obtained on the basis of long term mean values from the whole 50-year period from 1951 – 2000 is estimated in terms of the percentage of the global land area assigned to the same climate type. The spatial distribution of the differences between classification results obtained for the 50 year period and the one 15-year interval showing greatest deviations were determined and the respective transfer matrix summarizing the respective redistributions between the five main climate types was calculated. As a change from one climate type to another between two periods may be caused by rather small differences concerning the relevant climatic parameter (e.g. annual precipitation sum) for those gridcells assigned to different climate types in the two periods it is furthermore investigated in how far these differences reflect a statistical significant climate change concerning those parameters that are relevant for the respective redistribution by applying the non-parametric U-test according to MannWhitney (e. g. Bahrenberg et al. 1990). Concerning for example a change from climate type A to climate type C it is tested if the temperature of the coldest month shows statistical significant differences (at the 90% or 95% level) between the two periods. RESULTS The Köppen classification restricted to the five main types based on monthly mean values for the period 1951 – 2000 is shown in Fig. 1. The temporal variations of the relative area occupied by each of the five main Köppen climates estimated for sliding 15-year intervals during the 1951 – 2000 period are depicted in Fig. 2 for the whole globe and in Fig. 3 for the continental scale regions (marked by grey rectangles in Fig. 1).
Concerning the long-term variations of the global land area occupied by the five main Köppen types (see Fig. 2) the most striking features are a distinct reduction of the areas assigned to the polar E and boreal D climates as well as a concomitant expansion of dry B climates. Tropical A and temperate C climates on the other hand, although showing marked decadal scale variations exhibit no such distinct long term trends.
Figure 1: Spatial distribution of the five main Köppen climate types determined for the period 1951 – 2000. Rectangles indicate the continental sub-regions for which selected results are presented.
As depicted in Fig. 3 the trends in land fractions occupied by Köppen classes for each of the continental-scale regions may differ considerable from the global trends. North America Most striking for North America appear distinct reductions of polar E and as well dry B climates. Simultaneously the area occupied by the temperate C and boreal D climate types increases. Asia In Asia polar E climates exhibit a reduction in coverage as well. But in contrast to North America dry B climates expand whereas temperate C and boreal D climates feature downward trends in coverage. Europe An expansion of dry B climates can also be stated for Europe but most important appears a sharp increase / decrease of the area occupied by temperate C / boreal D climates affecting up to 10% of the European land area. South America In South America positive trends occur for temperate C and tropical A climates whereas dry B climates undergo a long term reduction in coverage. Additionally a slightly decreasing trend in the coverage of cold E climate can be detected.
Africa The expansion of dry B climates that can also be seen on the global scale and in Europe and Asia appears most striking in Africa where its increase in percentage since 1951 reaches around 5%. This expansion of dry B climates is compensated by concomitant reductions of the area covered by tropical A and especially temperate C climates. Australia Australia shows marked inversely coupled decadal scale variations of tropical climate types A (and partly temperate C climates) on the one hand and dry B climates on the other hand. However no clear-cut long-term trends can be deduced.
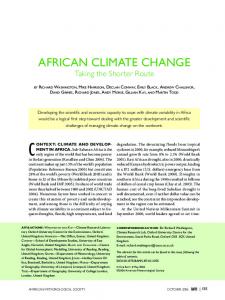
Figure 2: Time series of the relative area (percentage of the global land area excluding Greenland and Antarctica) occupied by the main Köppen types.
North America
Asia
Europe
South America
Figure 3: Time series of the relative area (percentage of the resp. continental land area excluding Greenland and Antarctica) occupied by the main Köppen types. For the continental scale subregions indicated in Fig. 1.
Africa
Australia
Figure 3: cont.
With respect to Fig. 2 it may be concluded that the last decades of the 20th century represent exceptional climate conditions in terms of the distribution of Köppen climate types. For example the area assigned to dry B climates reaches its maximum in the 1986 – 2000 period while boreal D and cold E climates exhibit global minima concerning their coverage on the global scale. For each 15-year interval Fig. 4 shows the relative area assigned to the same climate type as in the 1951 – 2000 period. It becomes clear that the 1986 – 2000 period indeed shows the most distinct differences to classification results obtained for the whole period. This is consistent with the general knowledge that the 1986 – 2000 interval represents a period of accentuated global warming as it comprises 13 of the 15 warmest years within the period 1951 – 2000. Thus, it may be considered as a recent representation of a projected globally warmer future climate documented by e.g. IPCC (2001).
Figure 4: Time series of the relative fraction of global land area denoted to the same Köppen climate type as in the period 1951 – 2000. Sliding 15-year intervals have been applied.
Against this background it is desirable to take a closer look at the differences between the results of Köppen classifications applied to the 1986 – 2000 interval and the whole analysis period from 1951 – 2000. The respective redistributions between the five main Köppen climate types are summarized in the transfer diagram given in Fig. 5. The resulting differences between the two periods concerning the spatial distribution of climate types are depicted in Fig. 6. 96.7% of the global land area are assigned to the same main Köppen climate in the two periods under consideration. For the remaining 3.3% land fraction redistributions between the five classes occur between 1951 – 2000 and 1986 – 2000. According to Fig. 5 major transfers between the five main climates took place from climate type C to A, from climate types A, C and D to B, from D to C and from E to D. As result the area occupied by the dry climate type B increases towards the end of the 20th century while the boreal and cold climates D and especially E exhibit reductions in coverage in the most recent 15-year interval. The tropical A climate and the temperate C climate feature only minor differences – slight expansions during 1986 – 2000 - between the two periods.
Fig. 5: Transfers between the five main Köppen climate types from the period 1951 - 2000 to the most recent 15-year interval from 1986 - 2000 in terms of percentages of the global land area (excluding Greenland and Antarctica). The four rectangles and the oval represent the five main Köppen climate types characterised by temperature and precipitation conditions respectively. Numbers above/below the one letter Köppen codes indicate the relative area occupied by each type during the 1951 – 2000/1986 – 2000 period respectively. Blue/red Numbers to the right represent the associated area gains/losses. Arrows indicate redistributions between climate types exceeding 0.01%.
Only around 92% of the global land area appear as stable climates when comparing the two selected periods on the basis of the two letter coded 14 Köppen subtypes.
Except for the dry B climates these 14 classes are differentiated concerning precipitation characteristics. Thus it can be stated that considerable redistributions occur within the five main climate types, mainly due to precipitation variations (not shown here). In summary the differences between the period 1951 – 2000 and the interval 1986 - 2000 regarding the extension of the five main Köppen climates as displayed in Fig. 5 support a global warming tendency towards the end of the 20th century. This warming trend is reflected particularly by a reduction of the area occupied by boreal D and cold E climate types as well as by a decrease in precipitation implying an expansion of dry B climates. As can be seen from Fig. 6 the reduction of the area designated to the boreal and cold climate types D and E appears most pronounced in high latitudes of North America and in the north-eastern part of Asia where cold E climates are replaced by boreal D climates, which in turn are substituted over large areas by temperate C climates in Eastern Europe and the USA. Expansions of dry B climates on the other hand occur most strikingly in southern and sub-Saharian Africa and the eastern and central parts of Asia. Concerning tropical A climates - as temperate C climates exhibiting slight increases in coverage on the global scale (Fig. 5) – the spatially most coherent changes can be found in southern Africa where tropical A climates gain area mainly on the expense of temperate C climates.
Figure 6: Köppen climate types for the period 1986 - 2000 for gridcells with different Köppen climates within the periods 1951 – 2000 and 1986 – 2000, respectively. Grey and black dots indicate gridcells for which a difference concerning the respective relevant climate parameter between the two periods can be determined on the 90% or 95% level of significance, respectively.
With respect to the statistical significance of differences of the parameters relevant for classification results between the two periods (as indicated by grey and black dots for exceedance of the 90% and 95% level of significance respectively in Fig. 6) it turns out that for around 1.63% of the global land areas a change from one climate type to another is accompanied by a statistical significant shift in the mean of the respective relevant climatic parameter at least at the 90% level of significance. Thus for about 50% of the area for which changes are found these changes can significantly be attributed to the main variable. Statistical significant differences over large areas occur especially
-
in Africa where temperate C climates are substituted by tropical A climates, in Africa and eastern Asia where dry B climates replace tropical A and temperate C climates or boreal D climates respectively, and in the sub-polar regions of North America and north-eastern Asia where boreal D climates increased their coverage at the expense of cold E climates.
Also climatic differences linked to the distinct expansion of temperate C climates in eastern Europe and the USA frequently reach statistical significance although most often merely at the 90% level. Regarding the expansion and partly also reduction of dry B climates it has to be mentioned that there are regional differences concerning the climatic parameter to which the detected redistributions can be attributed. Especially in the western and central Sahel regions and throughout Australia but also in the USA redistributions affecting dry B climates seem to be rather connected with temperature variations than with precipitation changes. SUMMARY AND CONCLUSIONS The application of the global climate classification according to Köppen (1936) to globally gridded climate data for sliding 15-year intervals in the period 1951 – 2000 yields an overview of the spatio-temporal variations of main climatic types in a global and when applied to regional data subsets in a continental perspective. On the global scale the main temporal variations concerning the area occupied by the five main Köppen climate types are characterized on the one hand by long-term declining trends of the area designated to the climate types representing boreal and cold climates (D and E) and on the other hand by increasing coverages of the dry B climates. Although tropical A and temperate C climates show marked decadal to multi-decadal scale variations - including a decline of A climates until the mid 1980s and a distinct increase of C climates since the 2nd half of the 1960s – no such clear cut tendencies lasting over the whole 1951 – 2000 period as detected for the above mentioned types become obvious for these two types. However respective variations on the continental scale show partly distinctly differing behaviour. The comparison of classification results achieved for individual 15-year intervals with the spatial distribution of climate classes obtained on the basis of the whole 1951 – 2000 period reveals that the most recent sub-period from 1986 – 2000 shows greatest deviations to the long-term mean climate in terms of area fractions of different climate types. The redistributions between the five main Köppen climate types that occurred between the 1951 – 2000 period and the 1986 – 2000 interval affect 3.3% of the global land area. But only for about the half of this area differing classification results can be attributed to statistical significant differences of the respective relevant climatic parameter between the two periods. Transfers between climate types result in a most recent increase of the dry B climate and concurrent reductions of boreal D and cold E climates whereas for tropical A and temperate C climates only minor expansions become visible.
The above findings concerning spatio-temporal variations of the five main Köppen climates during the 2nd half of the 20th century are on a global scale generally in line with the results obtained by several authors who applied the Köppen classification or modifications of it to observed 20th century climate data (e.g. Fraedrich et al. 2001, Kalvova 2003, Grieser et al. 2006) and with respect to more regional scale variations are furthermore supported for example by Wang and Overland (2004) and Serreze et al. (2000) concerning the reduction of cold E climates and by Gonzalez (2001) concerning the expansion of dry B climates in Africa. As 13 out of the 15 globally warmest years within the 1951 – 2000 period occured between 1986 and 2000 this most recent period does not only comprise the effects of the global warming observed in the 20th century but it may also be considered as an analogue for a globally warmer climate as it is projected for the future (e.g. IPCC 2001). Thus it may be concluded that the shifts of the main climate types detected for the 1986 – 2000 interval will persist or may even be amplified under most likely future conditions of further global warming. This conclusion is supported by the results of applications of the Köppen climate classification performed on the basis of model output of coupled and uncoupled GCMs (e.g. Lohmann et al. 1993, Kalvova et al. 2003) indicating an expansion of tropical A and dry B climates and a reduction of boreal D and cold E climates under the assumption of further greenhouse gas warming. REFERENCES Bahrenberg, G., E. Giese and J. Nipper (1990): Statistische Methoden in der Geographie – Band 1: Univariate und bivariate Statistik.- Teubner, Stuttgart. Beck, C., J. Grieser and B. Rudolf (2005): A New Monthly Precipitation Climatology for the Global Land Areas for the Period 1951 to 2000. Climate Status Report 2004, 181 - 190, German Weather Service, Offenbach, Germany. Reprint available at http://gpcc.dwd.de. Fraedrich, K., F.-W. Gerstengarbe and P. C. Werner (2001): Climate shifts during the last century. Climatic Change 50: 405-417. Geiger, R. (1961): Überarbeitete Neuausgabe von Geiger, R.: Köppen-Geiger / Klima der Erde. (Wandkarte 1:16 Mill.), Darmstadt. Gonzalez, P. (2001): Desertification and a shift of forest species in the West African Sahel. Climate Research 17: 217-228. Grieser, J., M. Kottek, C. Beck, F. Rubel and B. Rudolf (2006): World Maps of Köppen-Geiger Climates calculated from CRU TS 2.1 and VASClimO v1.1, in preparation. Guetter, P. J. and J. E. Kutzbach (1990): A modified Koeppen classification applied to model simulations of glacial and interglacial climates. Climatic change 16: 193 – 215. IPCC (2001): Climate change 2001: The scientific basis. Contribution of working group I to the Third Assessment Report of the IPCC. Houghton, J. T. et al. (eds) Cambridge University Press. Kalvova, J., T. Halenka, K. Bezpalcova and I. Nemesova (2003): Köppen climate types in observed and simulated climates. Stud. Geophys. Geod. 47: 185-202. Köppen, W. (1936): Das geographische System der Klimate (Handbuch der Klimatologie, Bd. 1, Teil C). Kottek, M., J. Grieser, C. Beck, B. Rudolf and F. Rubel (2006): World Map of Köppen-Geiger Climate Classification Updated. submitted to Meteorologische Zeitschrift.
Kraus, H. (2001): Die Atmosphäre der Erde. 2. Ed. Springer, Berlin. Lohmann, U., R. Sausen, L. Bengtsson, U. Cubasch, J. Perlwitz and E. Roeckner (1993): The Köppen climate classification as a diagnostic tool for general circulation models. Clim. Res. 3: 177-193. Mitchell, T. and P. Jones, 2005: An improved method of constructing a database of monthly climate observations and associated high-resolution grids. Int. J. Climatol. 25, 693-712. Serreze, M. C., J. E. Walsh, F. S. Chapin III, T. Osterkamp, M. Dyurgerov, V. Romanovsky, W. C. Oechel, J. Morison, T. Zhang and R. G. Barry (2000): Observational evidence of recent change in the northern high-latitude environment. Climatic Change 46: 159-207. Suckling, P. W. and M. D. Mitchell (2000): Variation of the Köppen C/D climate boundary in the Central United States during the 20th century. Physical Geography 21: 38-45. Triantafyllou, G. N. and A. A. Tsonis (1994): Assessing the ability of the Köppen system to delineate the general world patterns of climates. Geophysical Research Letters 21: 2809-2812. Wang, M. and. J. E. Overland (2004): Detecting arctic climate change using Köppen climate classification. Climatic Change 67: 43-62.