The 'Superlativist' claim, as named by Green et al. (1991) .... Hierarchical Nested style requires 'fall back' (Green, 1982). ..... Thomas Green for his kind advice.
A Comprehensibility Comparison of Three Visual Representations and a Textual Program in Two Paradigms
Jarinee Chattratichart and Jasna Kuljis The VIVID Centre Department of Information Systems and Computing Brunel University, United Kingdom {Jarinee.Chattratichart, Jasna.Kuljis}@brunel.ac.uk
ABSTRACT It is well known among visual programming researchers that support from empirical evidence is very much needed, at least to justify the use of visual over textual programming languages among certain groups of end users. This paper reports an experimental study that compared comprehensibility of three visual representations with a textual program, in control flow and data flow paradigms. Response time and accuracy analyses revealed that the visual representations outperformed the textual program in both paradigms and that programming paradigm only affected response time performance. Unlike the textual program, performance of all three visual programs was not affected by question type. INTRODUCTION Programming is not only hard to learn but also hard to teach. Evidence from research in psychology of programming indicates that expressing algorithms in a textual programming language syntax is a major obstacle for novices (Soloway, Bonar and Ehrlich, 1983; Soloway, Ehrlich, Bonar and Greenspan, 1983; Samurcay, 1990; Eisenstadt and Breuker, 1992). A tool that allows programs to be specified visually could help breaking the syntax barrier. This is our research initiative. Graphical and visual programming languages let programmers specify programs by means of diagrams incorporating graphical objects and/or icons. However, many of them are not as easy to use and to comprehend as they are commonly claimed. Numerous diagramming techniques have been proposed and used for program specification but very few have empirical support for such claims or for such designs. The lack of empirical evidence is one of the main problems in visual programming research (Whitley, 1997). Given the variations in experimental design, languages, representations, paradigms, user groups and the tasks studied, it is difficult to draw any conclusion from these researches to answer our first question: 'Is graphics better than text?'. Only when graphical programs can be shown better than textual programs can we justify our research initiative. This study attempts to find the answer to our research question above. This paper discusses relevant research and highlights the area that empirical evidence is much needed to answer the question. The sections that follow describe the experiments that we have carried out, the results and their discussion, report some of our observations and draw conclusions.
RESEARCH BACKGROUND Since our aim is to teach student programmers by way of visual program specification it is only justified if visual programs can be shown to be easier than textual ones. The first question that needs to be addressed is whether or not a visual programming language will be easier to use than a textual one, at least to novice programmers. The 'Superlativist' claim, as named by Green et al. (1991), that 'graphical is naturally the best', was not always supported empirically. In two separate studies Green et al. (1991) and Moher et al. (1993) compared the comprehensibility of textual programs and visual programs with experienced programmers. The former used a commercial VPL called LabView and the latter used Petri nets. Both found that response time performance in their experiments for textual programs was significantly shorter than that for the visual programs. A comprehensive research program conducted by Curtis et al. (1989) compared nine combinations of symbology and spatial arrangement. The three types of symbology were natural language, constrained language and ideograms and the three types of spatial arrangement were sequential, branching, and hierarchical. They found that the combination of constrained language and sequential spatial arrangement, which is an equivalent of a program design language, performed best. On the other hand, Scanlan (1989) compared comprehension of conditional logics in pseudocode with structured flowcharts and reported that flowcharts outperformed pseudocode in all three program sizes used in his study. Pandey and Burnett (1993) reported positive result in favour of VPL in their study, which compared two textual matrix manipulation programs with Form/3. There have also been many flowchart utility studies which gave mixed results [see, for example, Weinberg (1971), Aron (1974), Wright and Reid (1973), Kammann (1975), Mayer (1975), Shneiderman et al. (1977), Brooke and Duncan (1980a, 1980b), Gilmore and Smith (1984) and Scanlan (1989)]. An interesting point has arisen. The VPLs compared were in more than one programming paradigm since existing VPLs, with a few exceptions, are either control flow or data flow languages. Our next question is therefore 'Will graphics be better than text in both paradigms?'. Research on graphical control flow languages studied flowchart utilities. In these studies flowcharts or structured flowcharts and their variants were not used as programs themselves, but rather as documentation to aid program understanding. One cannot conclude that VPLs are better than text as program specification language just because they were found useful as documentation. Other studies which used flowcharts as programs such as Pascal/HSD by Diaz-Herrera and Flude (1980), PIGS by Pong and Ng (1983), Pict by Glinert and Tanimoto (1984), and FPL by Taylor et al. (1986) and by Cunniff et al. (1986) provide a better indication. These systems were developed to help teaching students to program using executable flowcharts or structured flowcharts. All of them reported positive results. Research on visual data flow languages is rare. The comparison between textual programs and visual programs by Green et al. (1991) and Moher et al. (1993) favoured textual programs. Although Petri nets use state-transition diagrams, the way the programs were represented in their study was closer to a data flow model than a control flow model. Anjaneyulu and Anderson (1992) compared DRLP (Data flow Representation Language for Programming) with LISP. The result was inconclusive. The work above conducted comparison in only one programming paradigm. For paradigm comparison, results from within-study research would be more reliable. As far as we know, there have been two experimental studies by Good (1999) who
compared comprehensibility of two visual micro programs, one control flow and one data flow, on information types. For details on information types see Pennington (1987). Results from the first experiment with MSc students indicated that both overall response time and accuracy performances were higher in the control flow group than the data flow group. However, the difference was not statistically significant. In her subsequent experiment with second year student programmers in their first term, significant paradigm difference for overall response time in favour of control flow was reported but not for accuracy. The data showed, however, that control flow accuracy performance was slightly better than data flow performance. Good's results (Good, 1999) suggest that programming paradigm may have some effects on program comprehension, at least among novices. Different notations highlight different information. No one notation is good for all tasks. As Green (1991) wrote, 'Notations in general designed to highlight one type of information. In the process they usually obscure other types of information.' A program represented in two different paradigms may not be equally information accessible. EXPERIMENT The purpose of this experiment was to compare comprehensibility of low-level program algorithm of four different program modes in two programming paradigms: control flow and data flow. The four program modes consisted of one textual program and three graphical programs. The three graphical programs differed by traversing style. Traversing style dictates how flow of control or data is traversed in a diagram. We speculated that traversing style might affect comprehensibility in graphical programs. However, this issue is not the subject of this present study and will not be given in detail here. If our speculation is correct, the result obtained from comparing the textual program to only one graphical program would be valid only for the traversing style used. However, comparing the textual program to ten or twenty different graphical programs, each in different layout, would not be economical or practical. The three traversing style used in this experiment were Top Down, Hierarchical Nested, and Free Style (Figures 2 to 7). The former two styles are the most commonly used in graphical programming. The task required of participants was question-answering for both forward and backward questions similar to the one used by Green et al. (1991). Forward questions are questions that give conditions and ask for the outcome. Backward questions give the outcome and ask for the conditions for the outcome. The programs consisted of conditional structures and simple loops. Hypotheses Conditionals and simple loops were used in these programs. The textual program (figure 1) was very similar to a conventional program listing. Even though indentation and white space were used, we anticipated that the number of If, Else, End If, and End loop would make tracing the program difficult. With the graphical programs there was no redundant representation that would clutter or confuse readers. Layout organization varied in degree of clarity so performance in some graphical programs might suffer. Nevertheless we expected that the textual program would be very hard to trace indeed. Hypothesis 1 Top Down style resembles family trees and organization charts often seen in everyday life. We expected participants to be familiar with it. Its layout organization is also good. Branching at decision points is an advantage over sequential text. Moreover, the branching arms go in opposite direction from the
decision point, and always either to the left or to the right, not in any random direction. We expected that this style would outperform text. Hypothesis 2. Hierarchical Nested style requires 'fall back' (Green, 1982). This will increase mental load for the participants and may cause them to forget to return to where they left off or to confuse them. Branching would be an advantage over text but we did not know the overall effect of 'fall back' and branching so we speculated that their performance might not differ much. Hypothesis 3. Diagrams were larger than the screen space available and scroll bars were provided. The problem that we anticipated with the Free Style is finding where to start if the starting graphical primitive could not be seen when the diagram appeared. This could make comparison unfair because the starting point of the textual program and the other two styles could be recognized when they were seen the first time. The starting graphical primitive of the Free Style diagram was hence brought to the center of the screen when it was first shown. The random placement of graphical primitives and diagram size would be a disadvantage but branching would be an advantage over text. However, since arrows were used and there was no 'fall back', we speculated that this style might perform better than text. Hypothesis 4. Data flow programs were generally larger than their control flow counterparts. Provided with limited scrolling space on the screen, it would be difficult to trace and would increase mental load on the participants. We expected that data flow performance would be much poorer than control flow performance. Hypothesis 5. According to Green et al. (1991), the implication of the 'matchmismatch' conjecture (Gilmore and Green, 1984) was that forward questions were easier than backward questions for a sequential program and that backward questions were easier in a circumstantial program. The textual program is sequential so we expected to observe better performance in forward questions than in backward questions. The graphical programs are circumstantial so we expected that backward questions would give better performance than forward questions. Method Participants. Twenty-two first year students at Brunel University participated in this experiment. Of all participants, eighteen were Computer Science students, three were Mathematics students and one was an Engineering student. The average number of programming languages that the participants have learned was 2.6. 20.4 % of the languages known were self rated as poor, 53.1 % as average, 22.5 % as good, and 4 % as very good. Procedure. Participants were given a lecture on the traversing styles and the textual program in the first session. Lecture notes and questionnaires were given at the beginning. Half of the participants were given the lecture in control flow paradigm first while the other half received the lecture in data flow paradigm first. The purpose of the lecture was to ensure that everyone knew how to read and understand the programs in all three traversing styles and a textual program. No assumption was made that participants were conversant with textual program mode although they had already learned an average of 2.6 programming languages. The working examples in the lecture session were based on the same program but in different styles. Example questions to test their understanding were both forward and backward questions.
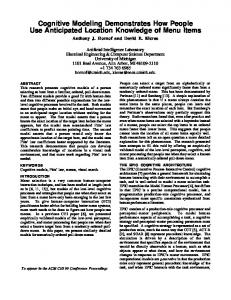
After the lecture, participants took the test for the paradigm they were taught. Later in the second session participants were given another lecture in the other paradigm. The same procedure as the previous session was followed and the test that participants took was for the paradigm they newly learned. The experiment was within-subjects design and consisted of two subexperiments. All participants did one control flow experiment and one data flow experiment. The programs used in the two experiments were written or drawn for the same programming problem. In control flow experiment, graphical control flow programs were used and in the data flow experiment, data flow programs were used. The same textual program was used in both experiments. The textual program should not be affected by paradigm difference but it was included in both experiments simply to be compared with the three visual programs in both paradigms. The textual program was a mini conventional style program (Figure 1) that matches a string, S, for adjectives: Bad, Pretty, Sad, etc. and prints verbs: Wink, Shout, Nod, etc. In control flow programs (Figures 2 to 4), arrow represented flow of control. In data flow programs (Figures 5 to 7), arrow represented flow of data. The data flow programs used the token model. The conditional construct in the data flow programs used a selector and a distributor as described in (Shu, 1992) with slight modification. Both used the same iteration construct, which encapsulated Figure 1. Textual program the iterative process. The iterative process was represented by flow of control, test nodes, and action nodes in control flow programs. In data flow programs, the iterative process was represented by flow of data, test nodes, and function nodes. The experiment was administered online, using a 17-inch monitor, 1024 x 768 pixels screen resolution. The program was written in Visual Basic. All participants were given an on-line practice session first. A sample program that mimicked the real test was run and the participants went through the whole procedure at his/her own pace. Participants could repeat the practice if they wished. In our previous experiment (Chattratichart and Kuljis, 2000), we found that students performed better in that
experiment when they were told of their marks at the end than when they were not. Students were therefore given their marks at the end of the test. In this test every participant answered four forward questions and four backward questions (Figure 8), one pair of forward and backward questions in each program mode. The order of diagrams, questions, and question types seen by each participant was randomized. Participants never saw the same diagram or same question type on two consecutive trials. The first diagram and first question type of the series that each participant saw was also randomized. The screen was divided into two sections, diagram and question-answer sections. First, the question-answer section appeared with a graphical image irrelevant to the problem task on the other section of the screen. The participant clicked the button Ready on the question-answer section when he/she felt ready to start. A diagram along with scroll bars appeared. The participant worked through the diagram and clicked the answer(s) in the question-answer section and the button Finish when he/she finished. During this time, response time was recorded along with the final answers and question details. The whole process repeated until all eight questions were answered. Participants were encouraged to take a break in between questions. Before the program ended, the program informed the participant the total marks he/she achieved.
Figure 2. Control flow, Top Down
Figure 4. Control flow, Free Style
Figure 3. Control flow, Hierarchical Nested
Figure 5. Data flow, Top Down
Figure 6. Data flow, Hierarchical Nested
Figure 7. Data flow, Free Style
Figure 8. Examples of forward and backward questions
Results The mean of total score achieved was 6.24 for the control flow experiment and 5.55 for the data flow experiment. There were twenty-one participants in the control flow experiment. One participant did not take part due to an unforeseen circumstance. However, all twenty-two participants participated in the data flow experiment. 67% of the participants achieved 6 or higher in the control flow experiment. In the data flow experiment the figure was 64%. Following our analysis procedure in Chattratichart and Kuljis (2000), the correct response criterion for this experiment was 6 for both experiments. Response time analysis was then made on only data from participants who met the criterion. However, for accuracy analysis all data were used so that the results would reflect the difficulty of the programs and the paradigms. Control flow experiment
Response Time Analysis A two-factor, repeated measures ANOVA analysis was performed on data from thirteen participants. The two factors were program mode (four levels: Top Down, Hierarchical Nested, Free Style, and Text) and question type (two levels: forward and backward). The dependent variable was the response time taken. There were main effects of program mode, F (1.901, 22.812) = 10.486, p < 0.001 and of question type, F (1,12) = 7.009, p < 0.021. No interaction between the two factors was found. Pairwise comparison was made to compare total response time taken for forward and backward questions of different pairs of program modes. The t-tests revealed the following: •
Significant difference between Top Down and text, t = -5.294; df = 12; p < 0.0005.
•
Significant difference between Hierarchical Nested and text, t = -3.107; df = 13; p < 0.008.
•
No significant difference between Free Style and text
Pairwise comparison between question types for graphical modes was not performed to avoid type I error. The result of the t-test for text mode revealed significant difference between question types for text, t = -2.288, df = 13, p < 0.040. Accuracy Analysis A one-factor, repeated measures ANOVA was performed on data from all twenty-one participants. The factor was program mode. The dependent variable was the sum of forward and backward scores. The ANOVA revealed main effect of program mode, F (3,60) = 5.617, p < 0.002. Pairwise comparison for three pairs was tested for graphical program modes and text mode. The t-tests revealed the following: •
Significant difference between Top Down and Text, t = 2.750; df = 20; p = 0.012.
•
Significant difference between Hierarchical Nested and Text, t = 2.950; df = 20; p = 0.008.
•
Significant difference between Free Style and Text, t = 3.833; df = 20; p = .001.
McNemar Test revealed significant difference between forward and backward questions in text only, p < 0.006. Data flow experiment
The same data analysis procedure as in the control flow experiment was performed for fourteen participants in the response time analysis and for all twenty-two participants in the accuracy analysis. Response Time Analysis The ANOVA revealed main effect of program mode, F (1.772, 23.039) = 4.347, p < 0.029. There was no main effect of question type, or interaction. Since there was no main effect of question type, a t-test was performed on the sum of response time taken for the two types of questions. The t-test did not reveal difference between any graphical program and text. However, significant difference between graphical programs was revealed as follows: •
Significant difference between Top Down and Hierarchical Nested, t = -4.918, df = 13, p < 0.0005.
•
Significant difference between Top Down and Free Style, t = -2.997, df = 13, p < 0.01.
Accuracy Analysis The ANOVA revealed main effect of program mode, F (3,60) = 5.250, p < 0.003. Pairwise comparison revealed the following: •
Significant difference between Top Down and Text, t = 3.169, df = 21, p = 0.005.
•
Significant difference between Hierarchical Nested and Text, t = 4.183, df = 21, p = 0.0005.
•
Significant difference between Free Style and Text, t = 3.250, df = 21, p = 0.0004.
McNemar Test revealed no significant difference between question types for any of the program modes. Paradigm analysis
Response Time Analysis Fifteen pairs of control flow/data flow participants were matched. For participants who passed the criterion in only one experiment their data from the other experiment were also included in this analysis. A two-factor, repeated measures ANOVA was performed. The two factors were program mode and paradigm. The dependent variable was the sum of response time for both types of questions. The ANOVA revealed main effects of program mode, F (1.578,22.085) = 5.805, p < 0.014, and strong effect of paradigm, F (1,14) = 24.059, p < 0.0005. However, there was an interaction, program mode * paradigm, F (2.073,29.015) = 3.704, p < 0.036. This was because the textual program was not affected by paradigm difference.
Pairwise comparison revealed paradigm difference for each graphical program mode. •
Significant difference between paradigms for Top Down, t = -3.593, df = 14, p = 0.003. • Significant difference between paradigms for Hierarchical Nested, t = -6.048, df = 14, p = .0005. • Significant difference between paradigms for Free Style, t = -3.868, df = 14, p = 0.002.
Accuracy Analysis A two-factor, repeated measures ANOVA analysis was performed. The two factors were program mode and paradigm. The dependent variable was the sum of scores for both types of questions. The ANOVA revealed strong main effect of program mode, F (3,60) = 11.753, p < 0.0005 but there was no main effect of paradigm, nor interaction. Figures 9 to 13 illustrate the effects of program mode, question type, and paradigm on response time and accuracy performance. Table 1 tabulates statistical findings and their summary. Response Time vs Program Mode
Response Time vs Program Mode
for Forward and Backward Questions
for Forward and Backward Questions Mean Response Time (s)
50
Mean Response Time (s)
60
60
50
40
40
30
Question Type
20
Forward
10
Backward
Question Type
30 Forward
Top Down
Free Style
Hierarchical-Nested
20
Backward
Top Down
Text
Hierarchical-Nested
Free Style
Text
Program Mode
Program Mode
Figure 9. Response time performance of the control flow programs
Accuracy Performance vs Program Mode
Accuracy Performance vs Program Mode
and Question Type
and Question Type 1.0
1.0
Mean Score
Mean score
.9
.8
.6
Question Type
.8 .7 .6 .5
Question Type
.4
.2 Top Down
Free Style
Hierarchical-Nested
Text
Program Mode
Forward
.4
Backward
.3 .2 Top Down
Forward Backward Hierarchical-Nested
Free Style
Program Mode
(These graphs were generated for comparison only.)
Figure 10. Accuracy performance of the control flow programs
Text
Response Time vs Program Mode
Response Time vs Program Mode and Question Type
for Forward and Backward Questions Mean Response Time (s)
90 80 70
Question Type
60
Mean Response Time (s)
100
100
90 80 70
60
Question Type
Forward
50
50
Forward
Backward
40 Top Down
Free Style
Hierarchical Nested
40 Top Down
Text
Backward Hierarchical-Nested
Free Style
Text
Program Mode
Program Mode
Figure 11. Response time performance of the data flow programs
Accuracy Performance vs Program Mode
Accuracy Performance vs Program Mode and Question Type
and Question Type .9
.8
.8
Mean Score
Mean score
.9
.7
.7
.6
.6
.5
Question Type
.4
Forward
.5
Question Type
.4
.3
Forward
Backward Top Down
Free Style Hierarchical-Nested
.3 Top Down
Text
Program Mode
Backward Hierarchical-Nested
Free Style
Text
Program Mode
(These graphs were generated for comparison only.)
Figure 12. Accuracy preformance of the data flow programs
Accuracy Performance vs Program Mode
Response Time vs Program Mode and Paradigm
and Paradigm 1.8
Mean Response Time (s)
160
140
Mean Score
1.6
120
1.4
100
80
Paradigm
Paradigm
1.2
60
Control flow
40
Data flow
Top Down
Hierarchical-Nested
Free Style
Text
Control flow Data flow
1.0 Top Down
Hierarchical-Nested
Program Mode
Figure 13. Paradigm Effect on Performance
Free Style
Program Mode
Text
Table 1. Summary of statistical findings from the experimental results. (TD = Top Down; HN = Hierarchical Nested; FS = Free Style, CF = Control flow, DF =Data flow.)
Factor
Program Mode
Question Type
Paradigm
Finding
Response Time CF
DF
CF
DF
yes
yes
yes
yes
TD vs Text
yes
no
yes
yes
HN vs Text
yes
no
yes
yes
FS vs Text
no
no
yes
yes
yes
no
n/a
n/a
TD
n/a
-
no
no
HN
n/a
-
no
no
FS
n/a
-
no
no
Text
yes
-
yes
no
Main effect Significant difference
Accuracy
Main effect Effect for:
Main effect Effect for:
yes
no
TD
yes
-
HN
yes
-
FS
yes
-
Summary Research questions:
Response Time
Accuracy
CF
DF
CF
DF
Is graphics better than text?
yes
inconclusive
yes
yes
Effect of question type
text
no effect
text only
no
only Effect of paradigm
graphical programs only
effect none
DISCUSSION Hypothesis 1 was supported for the control flow program. The Top Down graphical program outperformed Text in both response time and accuracy. However, there was no difference in terms of response time for the data flow program. Hypothesis 2 was not supported. We thought that 'fall back' would be difficult enough for Text to beat the Hierarchical Nested graphical program. We were wrong. We found the same behaviour as with Top Down, comparing to Text. This can be explained by the results from another experiment (not reported here) which showed
that Ôfall backÕ was a problem when the arrows used in this experiment were replaced by lines. Hypothesis 3 was only partially supported. The Free Style graphical program did not perform significantly better than text in terms of response time for both paradigms. However, its accuracy performance outperformed that of Text in both paradigms. Hypothesis 4 was supported in terms of response time only. The time taken to finish the task for the data flow programs was much longer than for the control flow programs. However, there was no paradigm effect in terms of accuracy. Hypothesis 5 was supported for Text only. The Ômatch-mismatchÕ effect was observed in the textual program. Backward question performance was significantly poorer than forward question performance in both response time and accuracy. With the graphical programs no effect of question type was found and the Ômatch-mismatchÕ effect was not observed. Nevertheless, this finding at least shows that backward question tracing in graphical programs is not as hard as in textual programs. The finding agrees with Green who once stated that Ôbackwards tracing is easier in graphical notations than in programming languagesÕ (Green, 1982). It was surprising that there was no paradigm effect on accuracy performance. Participants were first year students and had no experience in data flow programming languages. This was the first time they were taught such a representation. Moreover, the programs used here strictly followed the data flow model, i.e. the distributor and the selector were not omitted, hence there were more lines to confuse readers. Yet, accuracy performance did not suffer from paradigm difference. The difference in response time might have been due to diagram size which affected the demand on working memory. We looked for an explanation for the accuracy result. We investigated the data of participants who were taught the control flow representation first (control flow group) and the data flow representation first (data flow group) separately. Their total accuracy performance was plotted in figure 14. The graph shows that the control flow group did equally well in both paradigms. Such was not the case with data flow group. This group learned data flow and did the data flow experiment first. Yet, their control flow performance was better than data flow performance. This may be an indication that the control flow programs are easier to learn as a first programming language than data flow programs for our participants and that data flow programs can be learned once control flow has been learned. Nevertheless, the issue of paradigm preference is complex and we shall not attempt to reach any conclusion here. Our observation awaits more empirical data.
Accuracy Performance in both Paradigms for the two Taught Groups
Mean Total Score
6.4 6.2
6.3
6.3 6.2
6.0 5.8 5.6
Paradigm
5.4 5.3
5.2 5.0
Control flo w Data flow
Controlflowgroup
Data flowgroup
Taught Group
Figure 14. Mean total score achieved by the two taught groups.
CONCLUSION Our experimental study has answered our first research question in favour of graphical programs. Our students performed much better in low-level comprehension task with all three graphical programs than with the textual program in both control flow and data flow paradigms. The programs used in this study consisted of conditional structures and few simple loops. We conclude that the graphical programs facilitated decision tasks better than the textual program. While question type strongly affected performance of the textual program, it did not significantly affect that of the graphical programs. These advantages of a graphical/visual over a conventional textual notation justify our research initiative. On the paradigm issue, we investigated the effect of the two most common programming paradigms in visual programming: control flow and data flow. Results were interesting. There was a clear-cut paradigm difference in terms of response time but not accuracy. It has been suggested that the difference may have been influenced by diagram size, which made the data flow programs more difficult to trace. Yet, the accuracy performance of the textual program did not outperform that of the data flow programs. A well-designed reasonable sized data flow notation may fare as well as an equivalent control flow notation. This speculation has yet to be supported by empirical work. Furthermore, we have observed that students could learn both control flow and data flow programs. This may be the reason why accuracy performance was not affected. However, they did better in data flow programs when they were taught control flow programs first. The implication is that, for student programmers, a control flow language may be more suitable than a data flow language as the first programming language. Again, this is a mere suggestion based on our results, which are only limited to the representations used in the experiment. The experiment presented here only studied low-level micro-structure comprehension. The next question is whether this finding will still apply in high-level comprehension. However, students find expressing algorithms difficult. This requires low-level comprehension. The results so far indicate that we are on the right track although, admittedly, we are still in early phases of our research. We believe that notation design is an important factor contributing to the success of VPLs. What factors make a VPL hard or easy? At least in the context of graphical programs, we agree with Moher et al. (Moher, et al., 1993) that two sub-tasks are required in performing the comprehension tasks, find and follow. This encourages us to seek a representation that supports these two tasks. We have been investigating this issue, i.e. to find what makes find and follow easy in the hope of finding a suitable visual notation for our student programmers. ACKNOWLEDGEMENTS This research is supported by the EPSRC grant number GR/M08387. We thank Thomas Green for his kind advice. REFERENCES Aron, J. (1974). The Program Development Process: The Individual Programmer, Addison-Wesley, Mass., U.S.A., 104-106.
Anjaneyulu, K.S.R. and Anderson, J.R. (1992). The advantages of data flow diagrams for beginning programming. In C. Frasson, G. Gauthier, and G. I. McCalla (eds.), Intelligent Tutoring Systems: Second International Conference, ITS' 92, 585-592. Brooke, J.B. and Duncan, K.D. (1980a). An experimental study of flowcharts as an aid to identification of procedural faults, Ergonomics, 23(11), 387-399. Brooke, J.B. and Duncan, K.D. (1980b). Experimental studies of flowchart use at different stages of program debugging, Ergonomics, 23(11), 1057-1091. Chattratichart, J. and Kuljis, J. (2000). An assessment of visual representations for the 'flow of control'. In A.F. Blackwell and E. Bilotta (eds.), Proceedings of the 12th Annual Meeting of the Psychology of Programming Interest Group, 45-58. Cunniff, N., Taylor, R. P., and Black, J. B. (1986). Does programming language affect the type of conceptual bugs in beginner's program?: A comparison of FPL and Pascal. In Proceedings of CHI '86 Conference Human Factor in Computing Systems, ACM Press, 175-182. Curtis, B., Sheppard, S. B., Bailey, E. K., Bailey, J., and Boehm-Davis, D. A. (1989). Experimental evaluation of software documentation formats, The Journal of Systems and Software, 9, 167-207. Diaz-Herrera, J. L. and Flude, R. C. (1980), Pascal/HSD: A graphical programming system, Proceedings of IEEE Compsac '80, 723-728. Eisenstadt, M. and Breuker, J. (1992). Na•ve iteration: An account of the conceptualizations underlying buggy looping program. In M. Eisenstadt, M. T. Keane and T. Rajan (eds.), Novice Programming Environments: Exploration in Human-Computer Interaction and Artificial Intelligence, Lawrence Erlbaun Associates, UK (1992), 173-188. Gilmore, D. J. and Green, T. R. G. (1984). Comprehension and recall of miniature programs, International Journal of Man-Machine Studies, 21, 31-48. Gilmore, D. J. and Smith, H. T. (1984). An investigation of the utility of flowcharts during computer program debugging, International Journal of Man-Machine Studies, 20, 357-372. Glinert, E. P. and Tanimoto, S. L. (1984). Pict: An interactive graphical programming environment, IEEE Computer, 17(11), 7-25. Good, J. (1999). Programming paradigms, information types and graphical representations: Empirical investigations of novice program comprehension, Unpublished PhD Dissertation, Edinburgh University, Edinburgh, UK. Green, T. R. G. (1982). Pictures of programs and other processes, or how to do things with lines, Behaviour and Information Technology, 1(1), 3-36. Green, T. R. G., Petre, M., and Bellamy, R. K. E. (1991). Comprehensibility of visual and textual programs: A test of superlativism against the Ômatch-mismatchÕ conjecture. In J. Koenemann Belliveau, T. G. Moher, and S. P. Robertson (eds.), Empirical Studies of Programmers: Fourth Workshop, Ablex, Norwood, NJ, 121141. Kammann, R. (1975). The comprehensibility of printed instructions and the flowchart alternatives, Human Factors, 17(2), 183-191.
Mayer, R. E. (1975). Different problem-solving competencies established in learning computer programming with and without meaningful models, Journal of Educational Psychology, 67(6), 725-734. Moher, T. G., Mak, D. C., Blumenthal, B., and Leventhal, L. M. (1993). Comparing the comprehensibility of textual and graphical programs: The case of Petri Nets. In C. R.Cook, J. C. Scholtz, and J. C. Spohrer (eds.), Empirical Studies of Programmers: Fifth Workshop, Ablex, Norwood, NJ, 137-161. Pandey, R. K. and Burnett, M. M. (1993). Is it easier to write a matrix manipulation programs visually or textually? An empircal study. In Proceedings of the 1993 IEEE Symposium on Visual Languages, 344-351. Pennington, N. (1987). Stimulus structures and mental representations in expert comprehension of computer programs, Cognitive Psychology, 19, 295-341. Pong, M. C. and Ng, N. (1983). PIGS--A system for programming with interactive graphical support, Software Practice and Experience, 13(9), 847-855. Samurcay, R. (1990). Understanding the cognitive difficulties of novice programmers: A didactic approach. In P. Falzon (ed.), Cognitive Ergonomics: Understanding, Learning and Designing Human-Computer Interaction, Academic Press, London, 187-198. Scanlan, D.A. (1989). Structured flowcharts outperform pseudocode: An experimental comparison, IEEE Software, 6(5), 28-36. Shneiderman, B., Mayer, R., McKay, D. and Heller, P. (1977). Experimental investigations of the utility of detailed flowcharts in programming, Communication of the ACM, 20(6), 373-381. Shu, N. C. (1992). Visual Programming, Van Nostrand Reinhold, NY. Soloway, E., Bonar J. and Ehrlich, K. (1983). Cognitive strategies and looping constructs: An empirical study, Communication of the ACM, 26(11), 853-860. Soloway, E., Ehrlich, K., Bonar, J. and Greenspan, J. (1983). What do novice know about programming? In B. Shneiderman and A. Badre (eds), Directions in HumanComputer Interactions, Ablex, Norwood, NJ, 27-54. Taylor, R. P., Cunniff, N., and Uchiyama M. (1986). Learning, research, and the graphical representation of programming, Proceedings of 1986 Fall Joint Computer Conference, 56-63. Weinberg, G.M. (1971). The Psychology of Computer Programming, Van Nostrand, Princeton, N.J. Whitley, K. N. (1997). Visual programming languages and the empirical evidence for and against, Journal of Visual Languages and Computing, 8, 109-142. Wright, P. and Reid, F. (1973). Written information: some alternatives to prose for expressing the outcomes of complex contingencies, Journal of Applied Psychology, 57, 2, 160-166.