N ot e s
on
Geographic Distribution
Check List 10(3): 689–691, 2014 © 2014 Check List and Authors ISSN 1809-127X (available at www.checklist.org.br)
Chec
List
Journal of species lists and distribution
Using species distribution models as a tool to discover new populations of Phaedranassa brevifolia Meerow, 1987 (Liliopsida: Amaryllidaceae) in Northern Ecuador
Nora H. Oleas 1,2,3*, Alan W. Meerow 4, Kenneth J. Feeley 1,3, Jennifer Gebelein 5 and Javier FranciscoOrtega 1,3
1 Universidad Tecnológica Indoamérica, Centro para el estudio de la Biodiversidad y Cambio Climático, Machala y Sabanilla, CP. EC170103, Quito, Ecuador. 2 Florida International University, Department of Biological Sciences, 11200 SW 8th St., Miami, Florida, 33199, USA. 3 Fairchild Tropical Botanic Garden, Kushlan Tropical Science Institute, 10901 Old Cutler Road, Coral Gables, Miami, Florida, 33156, USA. 4 USDA-ARS-SHRS, National Germplasm Repository, 13601 Old Cutler Rd., Miami, Florida 33158, USA. 5 Florida International University, Department of Earth and Environment, 11200 SW 8th St., Miami, Florida, 33199, USA. * Corresponding author: e-mail:
[email protected]
Abstract: Phaedranassa brevifolia Meerow (1987) is an endangered plant species endemic to Ecuador. Until recently, this species was only known by the type location and four other adjacent subpopulations in a restricted area of less than four km2. We combined geo-referenced occurrences of this species and bioclimatic variables to generate a prospective species distribution model. Using the resulting map as a guide for field work, we found three new populations of P. brevifolia, increasing its geographic distribution to 16 km2. DOI: 10.15560/10.3.689
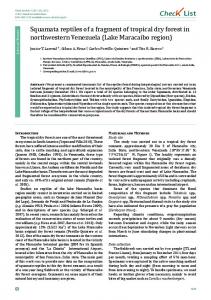
Phaedranassa brevifolia was first described from a single specimen collected in 1978 in Northern Ecuador (Meerow 1987) in a habitat classified as Dry Montane Scrub, characterized by thorny dry forest (Valencia et al. 1999). The above-ground parts of this bulbous species consist of only one or two leaves approximately 12 cm in length (Meerow 1990), which are hard to locate among other shrubs. The reproductive biology of P. brevifolia is unknown, but the general phenological pattern of the genus is to flower once annually, before the wet season (N. Oleas, personal observations). Above-ground leaves are absent before flowering, which makes spotting individuals especially difficult during that time of the year. At flowering, each plant is a 39-56 cm stem or scape, with five to seven funnel-shaped to ventricose flowers (Meerow 1990) (Figure 1A). After an extensive survey in 1999, the species was found in the type location and another four nearby subpopulations located in an area of less than four km2 (Figure 1B) (Oleas and Pitman 2003). One of the difficulties for finding new records of P. brevifolia is the small size of the plant. Species Distribution Models (SDMs) can be used to identify areas where species might be potentially found (de Siqueira et al. 2009). The SDMs are a general set of simulations that forecast the ranges of species based on the relation between real field records and a set of environmental predictors (Guisan and Zimmermann 2000). The resulting model can be used to judge habitat suitability and hence predict the species’ potential distribution, across large landscapes (Elith and Leathwick 2009), making them a valuable tool in biogeography and conservation biology. One of the challenges for modeling
the distribution of poorly-known species is that the models generally require a minimum of 20 records (Hernandez et al. 2006; Wisz et al. 2008) or more (Feeley and Silman 2011) in order to produce accurate models. However, for rare species, even SDMs generated with less than the optimal number of records may still be valuable if they can suggest areas that may have suitable habitats, and thereby help direct collecting efforts (de Siqueira et al. 2009). Ideally, new collections can then be incorporated back into the SDM in an iterative process such that each new record helps to improve the accuracy of range predictions and increase the likelihood of finding new populations (Guisan et al. 2006). We used the geo-referenced data of the five known locations of P. brevifolia to develop a preliminary distribution model for the species (Figure 1C). The model was generated through a maximum entropy approach as implemented in the program MAXENT ver. 3.3.3a (Phillips et al. 2006) with the default settings, which have been shown to provide good results (Syfert et al. 2013). The settings included: 10000 maximum number of background points, crossvalidated replicate run, 500 maximum iterations, 0,00001 convergence threshold. MAXENT is appropriate for presence/absence data (Newbold et al. 2010) and is one of the most commonly-used method to generate SDMs. MAXENT has shown superior prediction accuracy compared to other methods (Elith et al. 2006) and is less sensitive to sample size than other SDMs (Hernandez et al. 2006; Pearson et al. 2007; Hernandez et al. 2008; Wisz et al. 2008). For our model, we used 19 bioclimatic variables derived from monthly temperature and rainfall values (www.worldclim.org, spatial resolution of 30 arc 689
Oleas et al. | Distribution modelling of Phaedranassa brevifolia in Ecuador
second or ~ 1 km2) (Hijmans et al. 2005) as the underlying environmental surfaces. The bioclimatic variables include annual trends like mean annual temperature and annual precipitation, seasonality that takes into consideration the annual range of precipitation and temperature and extreme environmental conditions as temperature of the coldest and warmest month (Hijmans et al. 2005). The output of MAXENT is a continuous probability field which we transformed into a predicted suitable vs. unsuitable map based on thresholding with the cutoff set as the point of maximum training sensitivity plus specificity as suggested by Jiménez-Valverde et al. (2008). Maximum training sensitivity refers to minimize false negatives and specificity aims to reduce false positives. We assessed model performance with the receiver operating characteristic analysis (ROC) as the Area under the curve
(AUC) as implemented in MAXENT (Phillips et al. 2006). Our model had an AUC value of 0.9995, which indicates a better than random model performance (Manel et al. 2001; Franklin, 2009). In July–December 2009, we searched previously unexplored areas predicted as suitable for the occurrence of the species according to the SDM map. We need to point out finding new records of P. brevifolia is not an easy task. Each sterile individual aboveground is only one leave of 12 cm, which is difficult to distinguish, especially during the rainy season, when the vegetation is fuller. Furthermore, P. brevifolia habitat is located in one of the most deforested areas in Ecuador (Valencia et al. 1999), where agricultural practice includes setting up fire to clear the sites for agricultural purposes (N. Oleas, personal observations). Our species distribution model, based on the few available
Figure 1. New records of Phaedranassa brevifolia (Amaryllidaceae). (A) P. brevifolia in the wild, (B) Map of Ecuador showing P. brevifolia distribution, (C) Species Distribution Model (black area) estimating potentially suitable areas based on the five previously known registers (red dots), (D) New records of the species (green dots) and Species Distribution Model of potentially suitable areas estimated with the combined dataset of new and old records (black area).
690
Oleas et al. | Distribution modelling of Phaedranassa brevifolia in Ecuador
records before this study, suggested that the species could be found in adjacent areas to the west (Fig. 1C). The SDM increase the altitudinal range of P. brevifolia from 12001500 m to 800 to 1800 m. The habitat of P. brevifolia then would extend from Dry Montane Scrub habitats at the eastern portion of the geographic range to Wet Montane Scrub at the western part of the range. Within this area, we found three new locations expanding the known distribution of P. brevifolia to 16 km2 to the west of the previously known range (Figure 1B). Botanical vouchers for these locations are deposited at the National Herbarium (QCNE) in Quito, Ecuador (Oleas # 1010, 1011, 1012). The conservation status of P. brevifolia, even with these new populations does not change. The previously reported five populations in Oleas and Pitman (2003) correspond to a very small area, with each record
separated by less than two km2. Because of this, they can be considered one location or at most two, so that the total number of locations for P. brevifolia after incorporating the new populations is still just five. It is likely that there are more populations of P. brevifolia in the wild, but additional fieldwork is needed to find new populations. Thus, P. brevifolia is Endangered (EN) under the IUCN criteria B1ab (iii); C2a (i) (IUCN, 2001). Figure 1D shows a SDM including the new records found at the field; information that can be used to located new records of the species in the future. Our experience supports the potential application of SDMs as a tool to guide the search for new populations of rare species, even when models are based on limited sample sizes. Indeed, the use of SDMs has the potential to decrease time and effort to direct field efforts
Literature Cited de Siqueira, M.F., G. Durigan, P.J. de Marco and A.T. Peterson. 2009. Something from nothing: Using landscape similarity and ecological niche modeling to find rare plant species. Journal for Nature Conservation 17(1): 25‒32 (doi: 10.1016/j.jnc.2008.11.001). Elith, J., C.H. Graham, R.P. Anderson, M. Dudík, S. Ferrier, A. Guisan, R.J. Hijmans, F. Huettmann, J.R. Leathwick, A. Lehmann, J. Li, L.G. Lohmann, B.A. Loiselle, G. Manion, C. Moritz, M. Nakamura, Y. Nakazawa, J. McC..M. Overton, A.T. Peterson, S.J. Phillips, K. Richardson, R. Scachetti-Pereira, R.E. Schapire, J. Soberón, S. Williams, M.S. Wisz and N.E. Zimmermann. 2006. Novel methods improve prediction of species’ distributions from occurrence data. Ecography 29(2): 129– 151 (doi: 10.1111/j.2006.0906-7590.04596.x). Elith, J. and J.R. Leathwick. 2009. Species distribution models: ecological explanation and prediction across space and time. Annual Review of Ecology, Evolution and Systematics 40: 677–697 (doi: 10.1146/ annurev.ecolsys.110308.120159). Feeley, J.K. and M.R. Silman. 2011. Keep collecting: accurate species distribution modeling requires more collections than previously thought. Diversity and Distributions 17(6): 1132–1140 (doi: 10.1111/ j.1472-4642.2011.00813.x) Guisan, A. and N.E. Zimmermann. 2000. Predictive habitat distribution models in ecology. Ecological Modelling 135(2–3): 147–186 (doi: 10.1016/S0304-3800(00)00354-9) Guisan, A., O. Broennimann, R. Engler, M. Vust, N.G. Yoccoz, A. Lehmann and N.E. Zimmermann. 2006. Using niche-based models to improve the sampling of rare species. Conservation Biology 20(2): 501–511 (doi: 10.1111/j.1523-1739.2006.00354.x). Franklin, J. 2009. Mapping species distributions: spatial inference and prediction. Cambridge University Press, Cambridge, New York. 338 pp. Hernandez, P.A., C.H. Graham, L.L. Master and D.L. Albert. 2006. The effect of sample size and species characteristics on performance of different species distribution modeling methods. Ecography 29(5): 773–785 (doi: 10.1111/j.0906-7590.2006.04700.x). Hernandez, P.A., I. Franke, S.K. Herzog, V. Pacheco, L. Paniagua, H.L. Quintana, A. Soto, J.J. Swenson, C. Tovar, T.H. Valqui, J. Vargas, and B.E. Young. 2008. Predicting species distributions in poorly-studied landscapes. Biodiversity and Conservation 17(6): 1353–1366 (doi: 10.1007/s10531-007-9314-z). Hijmans R.J., J.D. Cameron, J.L. Parra, P.G Jones and A. Jarvis. 2005. Very high resolution interpolated climate surface for global land areas.
Received: February 2012 Accepted: March 2014 Published online: July 2014 Editorial responsibility: Frederico Augusto Guimarães Guilherme
Acknowledgments: We thank the Ministerio del Ambiente for collecting permit FLORA 04-09-IC-FLO-DNB/MA. We thank our fieldwork assistants: Teresa Gonzalez, Maria, Roberto and Luciana Melo, Patricio Vallejo, Susana and Patricio Oleas. This study was financed by the Dissertation Evidence Acquisition Fellowship at Florida International University and by a grant from The South Florida Chapter of the Explorers Club to N.O. We thank the suggestions of Augusto Francener Nogueira Gonzaga and one anonymous reviewer for their comments to improve this paper. This is contribution 278 from the Tropical Biology Program of FIU.
International Journal of Climatology 25(15): 1965–1978 (doi: 10.1002/joc.1276). IUCN. 2001. IUCN Red List Categories and Criteria: Version 3.1. , Gland, Switzerland and Cambridge, UK: IUCN Species Survival Commission.30 pp. Jiménez-Valverde, A., J.M. Lobo and J. Hortal. 2008. Not as good as they seem: the importance of concepts in species distribution modelling. Diversity and Distributions 14(6): 885–890 (doi: 10.1111/j.14724642.2008.00496.x). Manel S., H.C. Williams and S.J. Ormerod. 2001. Evaluating presenceabsence models in ecology: the need to account for prevalence. Journal of Applied Ecology 38(5): 921–931 (doi: 10.1046/j.13652664.2001.00647.x). Meerow, A.W. 1987. New species of Phaedranassa and Eucharis (Amaryllidaceae). Sida 12(1): 29–49. Meerow, A.W. 1990. Amaryllidaceae; pp. 1–54, in: G. Harling and L. Andersson (ed.). Flora of Ecuador. Volume 41. Goteborg, Stockholm, Quito: University of Gotenborg; Riksmuseum, Pontificia Universidad Católica del Ecuador. Newbold, T., T. Reader, A. El-Gabbas, W. Berg, W.M. Shohdi, S. Zalat, S. Baha El Din and F. Gilbert. 2010. Testing the accuracy of species distribution models using species records from a new field survey. Oikos 119(8): 1326–1334 (doi: 10.1111/j.1600-0706.2009.18295.x). Oleas, N. and N. Pitman. 2003. Phaedranassa brevifolia. In: IUCN 2011. IUCN Red List of Threatened Species. Version 2011.2. Accessible at http://www.iucnredlist.org. Captured on 09 January 2012. Pearson, R.G., C.J. Raxworthy, M. Nakamura and A.P. Townsend. 2007. Predicting species distributions from small numbers of occurrence records: a test case using cryptic geckos in Madagascar. Journal of Biogeography 34(1): 102–117 (doi: 10.1111/j.13652699.2006.01594.x). Phillips, S. J., R.P. Anderson and R. E. Schapire. 2006. Maximum entropy modeling of species geographic distributions. Ecological Modelling 190(3-4): 231–259 (doi: 10.1016/j.ecolmodel.2005.03.026). Syfert, M.M., M. J. Smith and D.A. Coomes. 2013. The effects of sampling bias and model complexity on the predictive performance of MaxEnt species distribution models. PlosOne 8(2): e55158 (doi: 10.1371/ journal.pone.0055158). Valencia, R., C. Cerón,W. Palacios and R. Sierra. 1999. Las formaciones naturales de la sierra del Ecuador; pp. 79–108, in: R. Sierra (ed.). Propuesta preliminar de un sistema de clasificación de vegetación para el Ecuador continental. Proyecto INEFAN/GEF-BIRF y EcoCiencia. Wisz, M.S., R.J. Hijmans, J. Li, A.T. Peterson, C.H. Graham, A. Guisan and Group N.P.S.D.W. 2008. Effects of sample size on the performance of species distribution models. Diversity and Distributions 14(5): 763– 773 (doi: 10.1111/j.1472-4642.2008.00482.x).
691